
 Detection of Cyanobacteria in Closed Water Systems in Southern Louisiana (USA)
Hurlburt BK1*, Brashear SS1, Zimba PV23
1 United States Department of Agriculture, Agricultural Research Service, Southern Regional Research Center, 1100 Robert E. Lee Blvd., New Orleans, LA 70124 USA
2 Thad Cochran National Warmwater Aquaculture Center, Agricultural Research Service, United States Department of Agriculture, Stoneville, Mississippi 38776 USA
3 Current address: Texas A&M University – Corpus Christi, Natural Resources Center 3200, 6300 Ocean Drive, Unit 5866, Corpus Christi, TX 78412 USA
* Correspondence: : Tel: (504)286-4462; Fax: (504)286-4430; Email: barry.hurlburt@ars.usda.gov
Key Words: cyanobacteria, Louisiana, denaturing gradient gel electrophoresis, succession, water
Received March 02, 2011. Accepted June 06, 2011. Published September 14, 2011. Available online September 29, 2011.
Summary
Cyanobacteria are seemingly ubiquitous in nature, being found in hot springs, fresh and saline surface water bodies, both as a liquid or as ice, as well as soil and rock. The composition and abundance of component species in a particular ecosystem can be very dynamic in response to nutrient availability and weather. In fresh water systems used for drinking or aquaculture, cyanobacterial blooms can be problematic due to the release of toxins or off-flavor metabolites. One very rich environment for the study of cyanobacterial communities is aquaculture ponds in the southeastern United States. Aquaculture farms are comprised of multiple ponds that are arranged in close proximity, but usually have different populations of cyanobacteria. In an effort to begin to understand the dynamics of cyanobacterial population fluxes, we examined the composition of the community in twenty ponds on a commercial aquaculture farm in southern Louisiana using denaturing gradient gel electrophoresis (DGGE) during weekly sampling over approximately a 8 month period. We found that Microcystis sp. predominated, but several innocuous and other harmful species were present at varying times during the study.
Article Outline
Introduction
Cyanobacteria can be found in nearly all environments and via photosynthesis are key producers of atmospheric oxygen. In bodies of water blooms of cyanobacteria are common when weather and nutrient conditions are favorable. Closed aquaculture systems provide a useful environment to examine the succession of cyanobacteria over time. The high-density stocking practices of catfish farmers in the southern United States and the commensurate high feed levels often result in cyanobacterial blooms. Since these organisms are photosynthetic they produce oxygen which aids in fish growth and health. Unfortunately, certain species of cyanobacteria synthesize the off-flavor compounds geosmin and 2-methylisoborneol (Persson, 1980; Smith et al., 2008; Tucker, 2000; Young et al., 1996; Zimba and Grimm, 2003) and/or cyanotoxins (Lefaive and Ten-hage, 2007; Smith et al., 2008). In the work presented here, we sought to examine the cyanobacterial composition in ponds on a commercial catfish farm over time in an effort to begin to understand the dynamics of that complex community.
It is obvious that the phytoplankton in farm ponds can vary dramatically. In Figure 1a are shown aerial photographs of the farm we studied over time showing differential blooms. For the current work, denaturing gradient gel electrophoresis (DGGE), a molecular technique commonly used in qualitative ecological studies of cyanobacteria (Boutte et al., 2006; Ferris et al., 1996; Geiß et al., 2004; Janse et al., 2003; Muyzer et al., 1994; Saker et al., 2009), was applied to the cyanobacteria pond communities which allows the objective analysis of a very large number of samples.
Materials and Methods
Organisms Used in This Study, Culture Conditions and DNA Isolation
Unialgal cultures were used to develop the DGGE reference library (Table 1). All strains were cultured in modified BG-11 medium with silica (Zimba et al., 2001a) with a 12 hour light/dark cycle. Approximately 35 μmol m2 s-1 of light were provided by cool-white fluorescent lighting. Exponentially-growing cells were harvested by centrifugation at 10,000 x g, 10 minutes, 4 °C. 200 mg of wet weight cell paste were lysed in a FastPrep FP120 (Invitrogen, Carlsbad, CA), setting #4, 10 seconds using the FastDNA prep tubes with both garnet and pellet present. The lysates were cleared by centrifugation. DNA was isolated from the lysates using the FastDNA kit according to the manufacturer’s instructions (Invitrogen, Carlsbad, CA). The concentration of DNA was determined by absorbance at 260 nm.
Field Samples
Three research ponds at the Louisiana State University’s Aquaculture Center in Baton Rouge, LA, and several commercial ponds at Limco, Inc in Crowley, LA (U.S.) were also tested. The Limco farm consists of 36 ponds (Figure 1). Twenty of these ponds were sampled between 10:00 and 12:00 weekly from October 2002 to May 2003. The stars in Figure 1b indicate the position of a small dock where all samples were collected. An integrated sampler (5 cm x 100 cm) was used to collect 2 L of pond water. The samples were stored on ice overnight prior to further processing. Cells were harvested from the samples by centrifugation at 10,000 x g, 10 minutes, 4 °C.
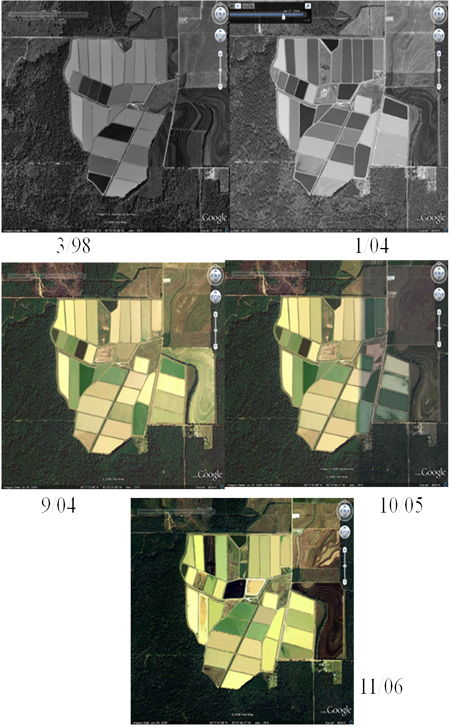
Figure 1-a: Satellite images of Limco, Inc. from Google Earth. The date of the image collection is indicated.
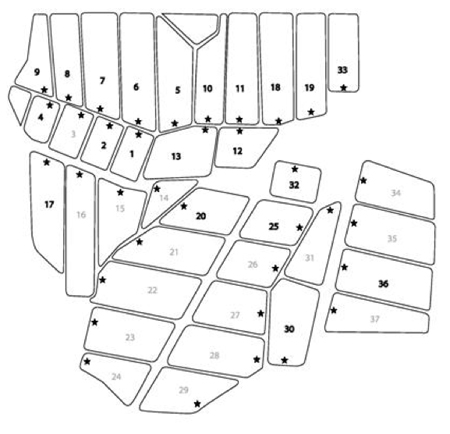
Figure 1-b: Schematic of the ponds at Limco catfish farm. All ponds are numbered. The numbers in bold font denote ponds used in this study. The stars indicate the position where samples were removed from the ponds.
Denaturing Gradient Gel Electrophoresis
Primers CYA359F and equimolar CYA781R (a and b) were used for PCR (Nubel et al., 1997). These primers are specific for the 16S rRNA gene of cyanobacteria and the plastids of some eukaryotic phytoplankton. The final concentrations of the reagents in the PCR amplifications were: 2 pM genomic DNA, 0.5 μM each primer, 200 μM dNTPs, 2.5 U Taq polymerase, 10 mM Tris-Cl pH – 9.0, 50 mM KCl, 0.01 % Triton X-100, and 1.5 mM MgCl2. The thermocycler (Delta Cycler I, Ericomp, San Diego, CA) was programmed as follows: 5 minutes at 95 °C, 11 cycles of annealing for 30 seconds, 60 second extension at 72 °C, 30 second denaturation at 94 °C. The initial annealing temperature was 66 °C and was reduced by 1 degree per cycle, to a final of temperature of 56 °C. That was followed by 20 cycles of 30 seconds at 94 °C, 30 seconds at 56 °C and 60 seconds at 72 °C. There was a final 10 minute extension at 72 °C. The amplification reactants were extracted twice with water saturated chloroform and precipitated with ethanol. Electrophoresis was carried out in a Protean II (BioRad, Hercules, CA) apparatus attached to a recirculating heater using 10 uL sample size per lane. The apparatus was half submerged in a water bath to aid in temperature control. The gels were 18 cm x 16 cm x 1 mm. A linear gradient of 35 % to 60 % denaturant, where 100 % denaturant is 7 M urea and 40 % formamide was used. The gel was 37.5:1 acrylamide:bis, 6.5% total acrylamide, 1X TAE. Gels were run for 1200 volt-hours, usually 70 volts for 17 hours, at 60 °C. Following ethidium bromide staining, the banding patterns were analyzed using Image One (BioRad).
Cloning of 16S rRNA Genes and Novel Bands in DGGE
PCR products were purified from agarose gels with the Qiaex II system (Qiagen, Valencia, CA). In addition, some complex samples from catfish ponds contained some novel bands in DGGE. Gel slices containing these bands were soaked overnight in 2 volumes of TEN (10 mM Tris-Cl, pH 7.5, 1 mM EDTA, 0.3 M sodium acetate) followed by ethanol precipitation. The DNA fragments excised from DGGE gels were cloned into the pCR2.1-TOPO vector using the TOPO TA cloning system (Invitrogen, Carlsbad, CA) according to the manufacturer’s instructions. Sequencing services were provided by the Sequencing Core Facility at the University of Arkansas for Medical Sciences. All sequence analysis was performed using GCG software package (Devereux et al., 1984).
Results and Discussion
DGGE Analysis
Each organism in our culture collection was subjected to DGGE analysis (a representative subset is shown in Figure 2). As can be seen in the figure, most organisms had a characteristic migration in these gels that is due to both the overall GC content, as well as local nucleotide composition. Anabaena circinalis and Oscillatoria splendida both migrated the same distance, as did Raphidiopsis brookii and Anabaena varibilis. The latter two species do not produce toxins or off-flavor metabolites. O. splendida does produce geosmin. In certain cases, there were multiple bands arising from a single species. These were cloned and sequenced revealing that some species generate multiple bands in this assay, even though the sequences were the same.
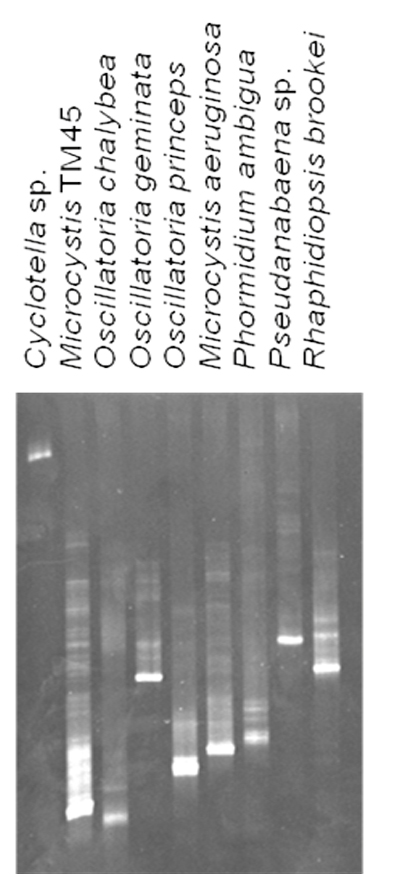
Figure 2: Representative DGGE analysis of laboratory strains. 10 μL of the PCR reaction was resolved on a 35% – 60% denaturant gel followed by staining with ethidium bromide.
This phenomenon has been previously reported (Ferris et al., 1996). Since there were no co-migrating bands from different species, this anomaly was not considered problematic. We also observed the same phenomena in field samples. It would be impossible to develop standards for all species, therefore, we scaled migration as a percentage of the furthest migrating bands of Oscillatoria cf. chalybea, which was set at 100%. The relative migration (Rf) of each species was calculated and is presented in Table 1. It should also be noted that although identical amounts of template DNA were used in the PCR reactions, varying amounts of PCR products resulted. Therefore, detection of a species in a complex mixture will not necessarily reflect its abundance.
Table 1: Reference organisms used in this study. Known problematic metabolites produced by these strains are listed. The Rf values for the PCR product in DGGE are listed.
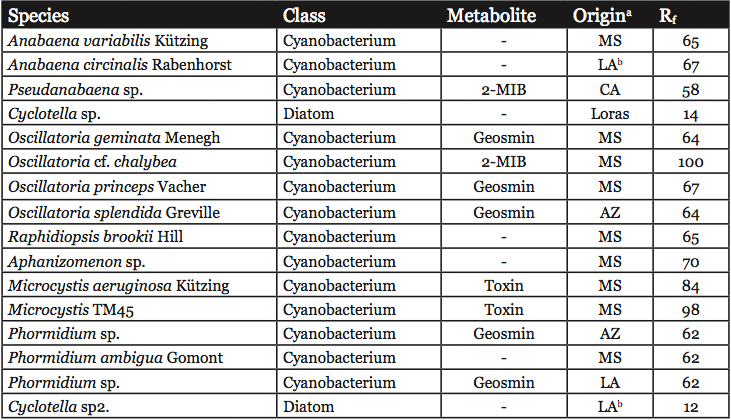
a MS = Mississippi, LA = Louisiana, CA = California, AZ = Arizona, Loras = Loras Culture Collection
b These strains are not in culture, but the values presented were taken from the gel shown in Figure 2. The identity of the organism was based on database searches using the sequence of the cloned bands as described in Materials and Methods.
Analysis of Complex Field Samples
To test the feasibility of a large field study, samples from research ponds at the LSU Aquaculture Center in Baton Rouge, LA were examined. The samples were processed as described for the laboratory cultures and subjected to DGGE analysis (Figure 3). To enable more accurate identification of the band in the field samples, we combined DGGE samples from some of the cultured samples to create two sets of standards. In the standard S1, Cyclotella, Pseudanabaena sp., Anabaena variabilis, Aphanizomenon sp. and Microcystis TM45 were used. The three centrally migrating species in standard S1 have been reported to be commonly found in catfish ponds (Zimba et al., 2001b). Lanes 1 – 3 were from LSU ponds T11, T13 and A5, respectively. The bands were excised, cloned and sequenced. In Figure 3, lanes 1 and 2 have a band corresponding to Cyclotella sp., but none of the other bands align with the standards. The Rf values for each band was determined and compared to our reference table (Table 1). In the initial experiments, we could not identify the bands with slower migration than Cyclotella sp. or the band in the Anabaena variabilis area of the gel (indicated with black arrows in Figure 3). The upper bands from the samples in lanes 1 and 3 both had identical sequences. Blast searches revealed 97% identity with several diatom species. As such it was designated as Cyclotella sp2. It should be noted that the lack of a band does not indicate the lack of diatoms or eukaryotic algae. The lower band from lanes 1 and 2 (indicated with an arrow) was found to be Anabaena circinalis. The Rf values for these organisms were then added to our database, increasing our ability to identify the various species present in field samples.
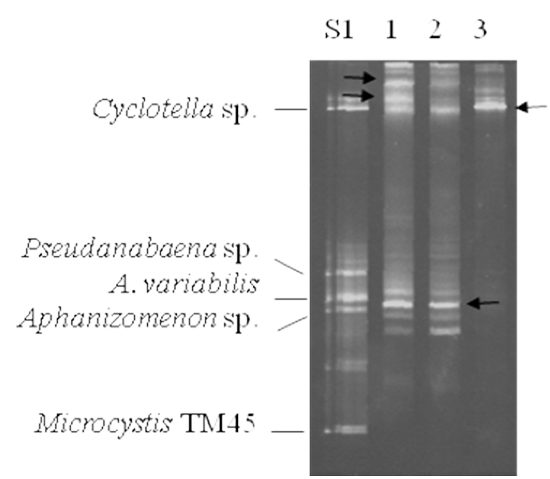
Figure 3: Representative DGGE analysis of catfish pond samples from LSU Aquaculture Center. 10 μL of the PCR reaction was resolved on a 35% – 60% denaturant gel followed by staining with ethidium bromide. PCR products of the species used for standards were pooled and are indicated on the left, S1. Lanes 1 – 3 were samples taken from research ponds T11, T13 and A5 at LSU, respectively. The black arrows indicate DGGE bands that did not correlate with our database of standards.
Determination of Cyanobacteria and Diatoms at a Commercial Catfish Farm
Samples were collected weekly from the commercial production ponds at Limco, Inc. in Crowley, LA and diatom and cyanobacteria seasonality was examined. A map of the farm is shown in Figure 1b. Representative data are shown in Figure 4. In standard S2 Cyclotella, Pseudanabaena sp., Oscillatoria geminata and Microcystis aeruginosa were used. Lanes 1 – 7 show samples from ponds 1, 3, 5, 7, 11 and 32, respectively. Whereas most of the bands corresponded to migrations in Table 1, representatives were excised, cloned, sequenced and identified by database searches for confirmation. Lanes 1 and 2 contained barely detectable amounts of Phormidium sp. and Aphanizomenon sp. Lanes 3 and 5 had high levels of Phomidium sp. and lower levels of Cyclotella sp. Lane 5 also contained Microcystis sp. Lane 4 showed a moderate level of Oscillatoria cf. chalybea and a lower level of Phormidium sp. Lane 6 complex. The bands corresponded to Aphanizomenon sp., Anabaena circinalis and Anabaena variabilis. Lane 7 had Microcystis sp. and a low level of Phormidium sp. The contiguous samples that were analyzed are summarized in Figure 5. It is clear that no two ponds had the same complement of organisms. Microcystis species (aeruginosa and TM45) were the dominant species in nearly all ponds. Geosmin- and MIB-producing cyanobacteria were detected in all ponds, however, not at all times. The data presented in Hurlburt et al. (2009) show that most of the ponds had detectable levels of both geosmin and MIB all the time. The presence of these metabolites and the absence of detectable producer species could arise for several reasons including: residual off-flavor from previous blooms, release of off-flavor into the water from tainted fish or from producing actinomycetes. It is interesting to note that no fish kills occurred in the ponds examined, although there was one in pond 35. The water from pond 35 was tested after the kill and a high concentration of Microcystis aeruginosa was found. The presence of microcystin was not tested.
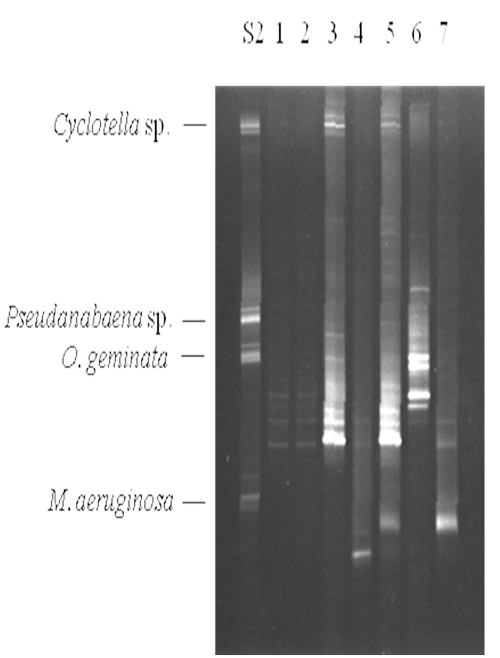
Figure 4: Representative DGGE analysis of commercial production ponds at Limco, Inc. 10 μL of the PCR reaction was resolved on a 35% – 60% denaturant gel followed by staining with ethidium bromide. The species used in standard S2 are indicated on the left. Lanes 1 – 7 were from ponds 1, 3, 5, 7, 11 and 32, respectively.
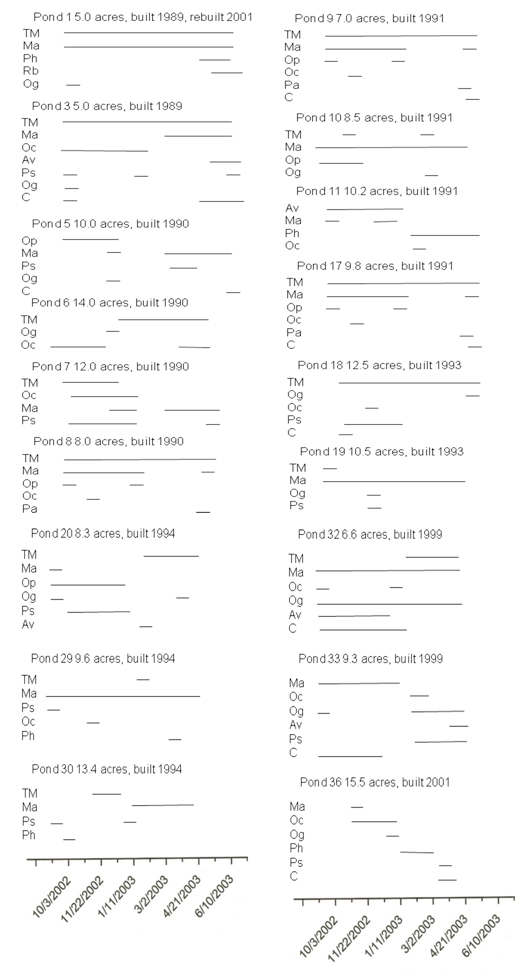
Figure 5: Compilation of DGGE data for entire sampling period at Limco Farm, Crowley, LA. Pond number, size and age are indicated. Horizontal lines indicate the presence of particular organisms. TM=Microcystis TM45, Ma=Microcystis aeruginosa, Ph=Phormidium sp., Rb=Rhaphidiopsis brookii, Og=Oscillatoria geminata, Oc=Oscillatoria chalybea, Os=Oscillatoria splendida,Op=Oscillatoria princeps, Ps=Pseudanabaena sp, C=Cyclotella sp., Pa=Phormidium ambigua, Av=Anabaena variabilis.
Microcystis was the dominant genera throughout the 8 month sampling period. This taxon occurred in over 80% of all samples collected, and was present in most ponds during the entire study period. We found that even though the ponds are in close proximity to each other, no two ponds had the same patterns of detectable organisms.
Acknowledgements
We are indebted to Russell Freeland of Limco, Inc. for access to their commercial production ponds, as well as Robert Romaire for access to research ponds at the LSU Aquaculture Center. We thank Qiang Hu, Arizona State University for help with DGGE. We also thank Jane McBride, Casey Grimm, Soheila Maleki and Elaine Champagne for critical reviews of the manuscript. This work was supported by intramural CRIS 6435-43440-040-00D from the Agricultural Research Service, United States Department of Agriculture. Mention of a trade name, proprietary product, or specific equipment does not constitute a guarantee or warranty by the US Department of Agriculture and does not imply approval of the product to the exclusion of others that may be available.
References
Boutte C, Grubsic S, Balthasart P, Wilmotte A. (2006) Testing of primers for the study of cyanobacterial molecular diversity by DGGE. J Micro Methods 65: 542 – 550.
Devereux J, Haeberli P, Smithies O (1984) A comprehensive set of sequence analysis programs for the VAX. Nucl Acids Res 12: 387 – 395.
Ferris MJ, Muyzer G, Ward DM (1996) Denaturing gradient gel electrophoresis profiles of 16S rRNA – defined populations inhabiting a hot spring microbial mat community. Appl Environ Micro 62: 340 – 346.
Geiβ U, Selig U, Schumann R, Seinbruch R, Bastrop R, Hagemann M, Schoor A (2004) Investigations on cyanobacterial diversity in a shallow estuary (Southen Baltic Sea) including genes relevant to salinity resistance and iron starvation acclimation. Environ Micro 6: 377 – 387.
Grimm CC, Zimba PV (2003) Applications of an instrumental method for the analysis of off-flavors in fresh water aquaculture. In: Rimando AM, Schrader KK, Ed. ACS Symp Series 848.
Hurlburt BK, Thomson JL, Brashear SS, Lloyd SW, Grimm CC, Zimba, P.V. (2009) The impact of weather on off-flavor episodes at a Louisiana (USA) commercial catfish farm. Aqua Res 40: 566 – 574.
Janse I, Meima M, Kardinaal EA, Zwart G (2003) High-resolution differentiation of cyanobacteria by using rRNA-internal transcribed spacer denaturing gradient gel electrophoresis. Appl Environ Micro 69: 6634 – 6643.
Leflaive J, Ten-Hage L (2007) Algal and cyanobacterial secondary metabolites in freshwaters: a comparison of allelopathic compounds and toxins. Freshwater Biol. 52, 199 – 214.
Muyzer G, DeWaal EC, Uitterlinden AG (1994) Profiling of complex microbial populations by denaturing gradient gel electrophoresis analysis of polymerase chain reaction-amplified genes coding for 16S rRNA. Appl Environ Micro 59: 695 – 700.
Nübel U, Garcia-Pichel F, Muyzer G (1997) PCR primers to amplify 16s rRNA genes from cyanobacteria. Appl Environ Micro 63: 3327 – 3332.
Persson P (1980) On the odor of 2-methylisoborneol. Water Res 14: 1113 – 1118.
Saker M, Moreira C, Martins J, Neilan B and Vasconcelos VM (2009) DNA profiling of complex baterial populations: toxic cyanobacterial blooms. Appl Micro Biotech 85:237 – 252.
Smith JL, Boyer GL, Zimba PV (2008) A review of cyanobacterial odorous and bioactive metabolites: impacts and management alternatives in aquaculture. Aquaculture 280: 5 – 20.
Tucker CS (2000) Off-flavors in catfish aquaculture. Rev Fish Sci 8: 45 – 88.
Young WF, Horth H, Crane R, Ogden T, Arnott M (1996) Taste and odor threshold concentrations of potential potable water contaminants. Water Sci Tech 30: 331 – 340.
Zimba PV, Dionigi CP, Brashear SS (2001) Selective toxicity of exogenous l-lysine to cyanobacteria, relative to a chlorophyte and a diatom. Phycologia 40: 483 – 486.
Zimba PV, Grimm CC, Dionigi CP, Weirich, CR (2001) Phytoplankton community structure, biomass and off-flavor: Pond size relationships in Louisiana catfish ponds. J World Aqua Soc 32: 96 – 104.
Zimba, PV, Mischke, CC, Brashear, SS (2003) Pond age-water column trophic relationships in channel catfish Ictalurus punctatus production ponds. Aquaculture 219: 291 – 301.
Zimba PV, Grimm CC (2003) A synoptic survey of musty/muddy odor metabolites and microcystin toxin occurrence and concentration in southeastem USA channel catfish (Ictalurus punctatus Ralfinesque) production ponds. Aquaculture 218: 81 – 87.