
![]()
Energizing Water through Static Storage: Integrated Research and Development of Storage Containers
Johansson Ba,* and Capjon Jb
aAkloma Bioscience AB, Medeon Science Park, 212 05 Malmö, Sweden
bUniversity of South-Eastern Norway, 31184 Borre, Norway
*Corresponding author: Email: benny@akloma.com
Keywords: carafe, projective geometry, coherent water, reduction in IR emission, fractal scaling, long-range correlation, self-regulation, plasmonic waves, quantum electrodynamics
Submitted: March 14, 2023
Reviewed: October 19, 2023
Accepted: November 2, 2023
Published: February 26, 2024
Abstract
This study shows that still water contained in a projective geometry (PG)-designed carafe oscillates in tune with a self-trapped electromagnetic field of resonant stationary waves to which some coherent configurations are associated, well defined at specific coherent frequencies. The resonant coherent oscillations produce an ensemble of quasi-free, high-grade, and low-entropy energy electrons, able to collect and transmit incident light in the visible and low near-infrared light spectrum (LNIR). The frequencies of transfer and informational waves become ever smaller as coherent molecular size increases, with a breakthrough in the LNIR range above 650 nm, increasing formation of a fractal set of coherent low-density water clusters. The fluctuation of local structures of high- and low-density water shifted from a dominance of the high-density liquid (80%) in ordinary water toward a low-density balance of 60% in carafe-contained water. This is confirmed by the change in low-density water chemistry, i.e., from the fractal scaling boundary of change and decline in thermal infrared (IR) emission aligned with structural conformity, with the donated electrons causing a reduction in oxidation-reduction potential, and extracted quasi-free electrons captured by oxygen molecules, forming hydroxyl-ions followed by an increase in pH. It has been postulated that the glassiness of water is geometrically associated with a tetrahedral low-density water structure, which is observed in tetrahedral amorphous silica. In contrast, high-density water lacks tetrahedral symmetry. Governed by the rise in low-density water clusters, the highly coherent interaction between the tetrahedral configuration and fractal ordering of the PG glass carafe and the contiguous aqueous phase increases its bioenergy and bioavailability, with a plausible biophilic interconnective potential.
Acronyms and Definitions
| CAD modelling | Computer aided design modelling, |
| CDs | Coherent domains of water, |
| DFA | Detrended Fluctuation Analysis; determines mono-fractal scaling behavior of numeric data, |
| DTC | Down-scaled glass test containers, |
| EMF | Electro Magnetic Field, |
| FD | Fractal Dimension; estimates fractal complexity of shapes, |
| FDC | Full-scale design carafe, |
| FFOL | Fibonacci Fractal Optical Lattice, |
| FOL | Fractal Optical Lattice, |
| FTC | Full-sized test carafe, |
| FOLC | Fractal Optical Lattice conditioned in full-sized carafe water, |
| FOLCW | Fractal Optical Lattice conditioned in control water, |
| HDE | High-grade energy, e.g., electrons or photons that can be used by biosystems, |
| HDW | High-density/high entropy water – less ordered – absent of tetrahedral symmetry, |
| LDW | Low-density/Low-entropy water – highly ordered tetrahedral-like coherent water, |
| NUCs | Non-uniformity calibrations, |
| PET | Polyethylene terephthalate, |
| PG | Projective Geometry, |
| ORP | Redox Potential – Oxidation-Reduction Potential, Quasi-free – quantum system where electrons can move almost freely, |
| QED | Quantum Electrodynamic Theory, |
| SEM | Scanning Electron Microscopy, |
| TIRI | Thermal Infrared Imaging, |
| UV/VIS/LNIR SPECTROSCOPY |
Ultraviolet/Visible/Low Near-Infrared Spectroscopy. Vortical resonant transfer and informational waves imply formation of two interlocked waves following a 3D vortical path, one low-frequency transfer wave (unmodulated wave) and the other informational (gain in ordering). |
Background
It was recently shown that less organized low-grade thermal energy obtained from the environment could be transformed into high-grade energy by means of the induced formation of energizing double-vortex figure-eight streaming flow in water by running water over a specific flow surface technology (Flowform [FF]) (Johansson et al., 2021; Wilkes, 2003). The dynamic water flow across the FF is shaped by projective geometry (PG) (Web ref. 1) of the FF surface. A highly organized and coherent low-density liquid water state forms in the dynamic water flow of the designed flow-path surfaces of two out of the four studied vessels (Manawa and Greenhouse stack FF vessels) (Web ref. 2). The difference between high-grade energy/low-density coherent phase of water activating and non-activating FF designs causing different vortical paths of flowing water is aligned with the fact that liquid water can alternate between two liquid states – low- and high-density water (Wernet et al., 2004; Huang et al., 2009; Perakis et al., 2017; Renati P et al., 2020). Despite variation in FF water temperature fluctuations during the study time, the repeated formation of a low-density liquid dominated the dynamics of the coherently flowing water. The results are conjectured to support the quantum electrodynamic nature of the vortical flow-path surfaces of the Manawa vase and Greenhouse stack (Del Giudice et al., 2005). In addition, it is proposed that the formation of an unidentified density state by non-activating flowing FF water (Matatiki bowl and Glonn vertical stack) shifts the high- and low-density fluctuations toward an increase of the high-density water fraction.
Could the same research methodology be employed to establish whether water can increase its nonlocal fractal coherency in a similar way, if it is statically stored in containers of particular shapes – geometries that are found in nature and recreated mathematically?
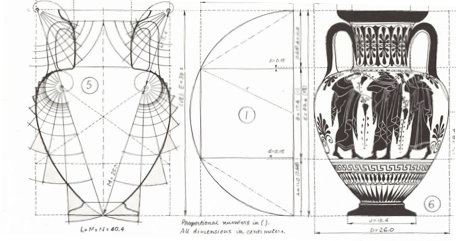
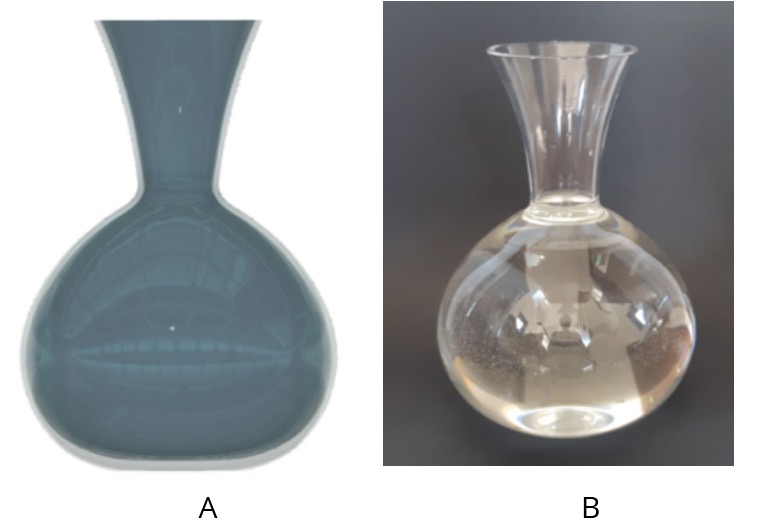
Inspiration for this hypothesis was found in the conjecture that ancient amphorae for wine and water storage could have such an ability (Fig. 1). Viktor Schauberger has repeatedly suggested this (Schauberger V, 2006; Coats C, 1995). György Doczi (1994) shows, e.g., how the contour of such ancient containers can be shaped according to “golden” geometry (Fig. 2), incorporating “Fibonacci sequences” that have multiple manifestations in nature, as well as in the molecular lattice of water (Web ref. 3). But golden geometry representation is dependent on a specific value of phi (1.618….), which is not always the case in natural forms.
We have chosen the different and complementary approach of structural “biomimicry” (Web ref. 4), which has full-form flexibility and shape dynamics but retains the ability to mathematically copy and describe the charm of the forms extracted from natural patterns: projective geometry (PG).
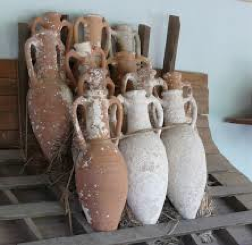
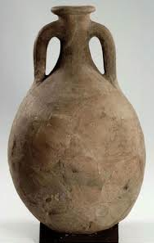
Figure 1. Ancient amphorae
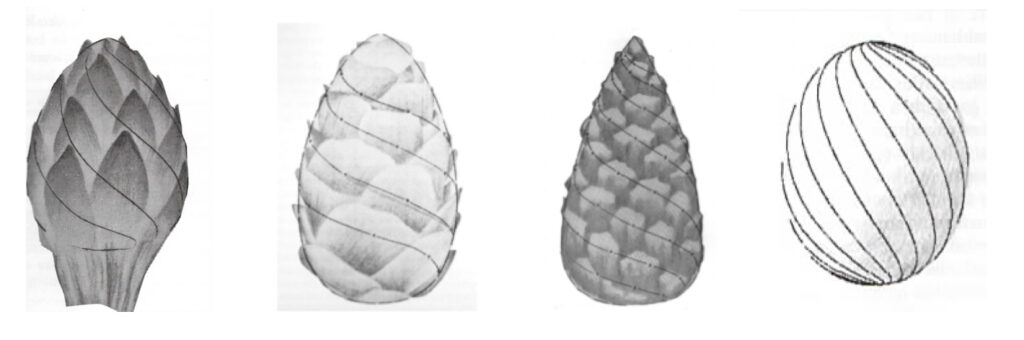
The theoretical basis for this geometry is found in Lawrence Edwards’ The vortex of life (1993) and highlighted in Almon (1979) and Web refs. 1, 5 and 6. Edwards built a device to make exact geometrical measurements of cones, flower and tree buds, and eggs (Fig. 3), which are organic forms in nature where life forces manifest (e.g. sprouting). In thousands of measurements of many different species he found that 92% of these had “very good” or “good” fit with the path curve geometry.
What is path curve geometry?
Path curve construction in PG is a complex framework, where radical abbreviations will complicate any understanding. The above references (see, e.g., Web ref. 5) give basic explanations of this superficial extract: Collineations are projective transformations that map points to points and lines to lines. In PG, collineations leave three real or imaginary points invariant (fixed), and if they are not lying on the same line, they form an “invariant” triangle. In 2D PG, the plane consists of such connected invariant triangles, where “growth measures” can be set up along their boundary lines. Such growth measures are sequences of points (of a certain cross-ratio) that are mapped, one to the other, by projective transformations between two fixed points on each line. By systematically plotting the crossings of connection lines between the sequences of points on two lines and drawing connecting curves through the plots, one can create so-called path curves. If one fixed point of an invariant triangle is moved to infinity, the growth measures of points on two (then parallel) lines is in geometric progression, characterized by individual cross-ratios on each line, and if the remaining line is vertical, it is called a “semi-imaginary” triangle. With different cross-ratios on each parallel line of a semi-imaginary triangle, the path curves typically depict half cross-sections of bud shapes. The 3D bud shapes can then be obtained by spinning the half 2D cross-section around the vertical line of the invariant triangle. The form of the path curve family produced in this way (Fig. 4) is characterized by the form factor lambda (λ), which is defined as the ratio of the natural logarithms of the cross-ratios (e.g., a and b) of points on the two lines:
λ = ln a / ln b
Edwards (1993, p.38) explains: If we take the ratio of the logarithms of these two numbers, this leads us to a number (or parameter) to which we give the name λ; and the value of λ informs us of the form of the complete family of curves. By changing the values of a and b one obtains different forms of the cross-section families. This research project is based on defining 3D shapes through spinning 2D path curves of different lambda (λ) values around the vertical axis. Different λ values thereby describe the basic cross-section form (degree of bluntness or sharpness). In 3D projective geometry the curves spin around the so-obtained object with different gradients defined by another factor, epsilon (ε), but since that is beyond the scope of the project further description is omitted here (Edwards, 1993, p. 54). Figure 5 depicts typical differentiations between the λ and ε factors.
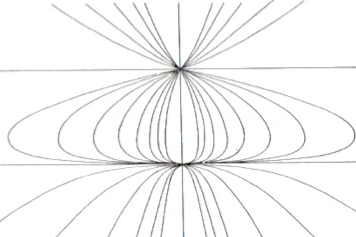
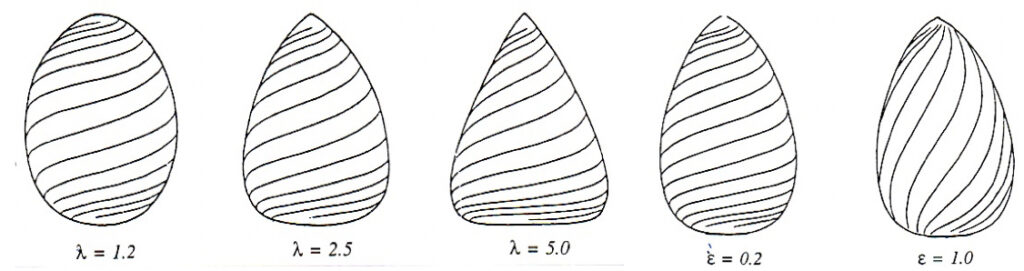
A λ value does not apply to one specific shape only, but it basically shapes a field (or family) of forms, mathematically filling space (like the layers in an onion) and all having the same λ value, but with different shapes in different layers (Fig. 4). In Figure 5 only one layer of each λ value is selected.
A research question was formulated: Can containers for water storage propose a shift toward a dominance of the low-density liquid if containers are shaped in accordance with path curve algorithms?
Notwithstanding the proposed PG-based outlines, it was shown in Johansson and Lukacs (2019) that the geometry of two concentric Fibonacci fractal optical circles acts as a wave-guiding lattice (Fibonacci Fractal Optical Lattice [FFOL]), generating high-grade energy, thus, transforming novel nonlinear and double-twisted electromagnetic waves to induce photons to self-organize spatially with fractal symmetry, lowered density, and entropy, and accumulated and self-trapped within extended coherent domains (CDs) of water (Johansson and Sukhotskaya, 2012). The helical mode and intensity pattern of the optical vortex generated by the FFOL depicts a specific fractal functional device, with fractal scaling properties that have novel non-linear impacts on living biosystems (Johansson, 2008; Johansson 2009, Johansson and Sukhotskaya 2016; Ahnblad and Nordkvist, 2017).
Can a similar biophilic effect (Web ref. 7) be obtained in a PG-shaped carafe – if constituting a fractal structuring component inducing equally striking effects – with non-linear impact on CDs of water?
Materials and Methods
Summary of methodology, applications and aims.
- Appropriate carafe design: Selection of an appropriate carafe design from five DTCs,
- Full-sized glass carafes: Production of a functional FDC,
- Analyses of TIRI and water chemistry (Redox Potential, pH and Conductivity) in water obtained from DTCs and FDCs,
- Quantification (percentage) of CDs in FDC water, where the porous structure of silica-PET encapsulates and anchors water CDs in FOLCW and especially FOLC,
- This section describes UV/VIS/LNIR analysis of three different silica PET foils (baseline, FOLCW and FOLC). The preparation of the different silica PET foils was described in section (iv). Additionally, the frequency spectrum of UV/VIS/LNIR transmittance data was evaluated by Fourier analysis,
- TIRI of water was obtained from the DTCs and FDCs,
- DFA determines the mono-fractal scaling behavior of pixel data obtained from TIRI of water from DTCs and FDCs,
- Fractal Dimension (FD) estimates fractal complexity of the FDC shapes,
- Scanning electron microscopy was obtained on pyrogenic silica nanoelements and silica agglomerates embedded in the PET foil aimed for determination of FD of the silica PET fractal structure,
- CAD modelling was obtained on different 2D path curves transformed into 3D shapes aimed for glassblowing.
For a conclusive shortcut summary of methodology, purpose and results see Table 4.
Appropriate carafe design (i)
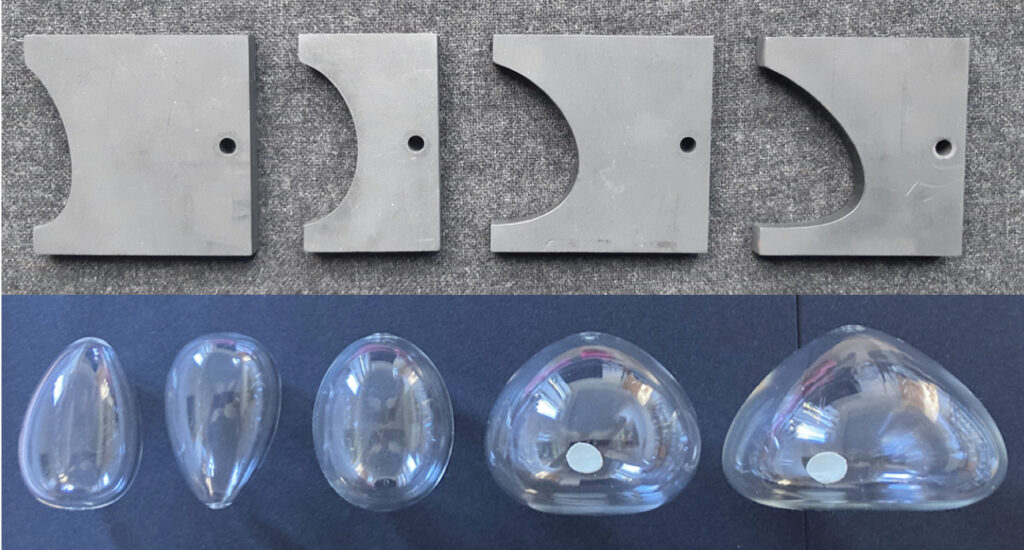
Path curve geometries can be extracted for an infinite number of possible carafe designs: which one would yield optimal properties related to a high-grade energy and low-density state of coherent water, and with an appropriate biophilic potential? To approach this question, it was decided to blow five alternative downscaled glass test containers (DTCs) of different shapes. Containers in glass are preferable due to its high content of tetrahedral amorphous quartz, geometrically similar with the tetrahedral configuration of low-density water. And they can be blown to exact geometrical specifications, not obtainable in terracotta, etc.
To search for appropriate container shapes different λ values (defining form-families) can be evaluated, and a certain layer within a family can be decided upon – as shown in Figure 5 (analysis algorithm in Web ref. 6).
The five tentative choices in Figure 6 represent organic equivalents of buds, eggs, and cones. The shapes were chosen to align with design specifications for a carafe aimed at everyday use, where aesthetics, grip, and stability are central claims. Graphite patterns with high accuracy 2D profiles of alternative selected λ values and shapes (layers) were produced, and 3D glass containers were blown in a professional turning machine. Carafes no. 1 and 2 are blown in the same pattern, but upside-down to detect the possibility of difference.
Due to the small opening on the top of the path curve surfaces of the DTCs, each one was filled up with distilled water (Apoteket AB, Sweden) using a syringe with a thin needle penetrating the entrance hole. Water samples were taken from the bulk volume with a pipette. Each sample was analyzed by thermal IR imagining (TIRI), according to a standard protocol. The experimental details are given in section (vi) (Johansson and Sukhotskaya, 2012). DTCs were conditioned for 24 h at ambient temperature (23°C) and compared to control water stored in a 50 ml beaker.
experiments.
Full-sized glass carafes (ii)
Since the DTCs were downscaled (for experimental reasons) in relation to containers that could be usable as water carafes, the primary experimental findings (Table 1) had to be verified for full-sized carafes. Through employment of the path curve algorithm, the profile with the most profound rise in high-grade energy of the DTC series (no. 4 in Fig. 6) was then chosen for up-scaling to 1.6-liter volume.
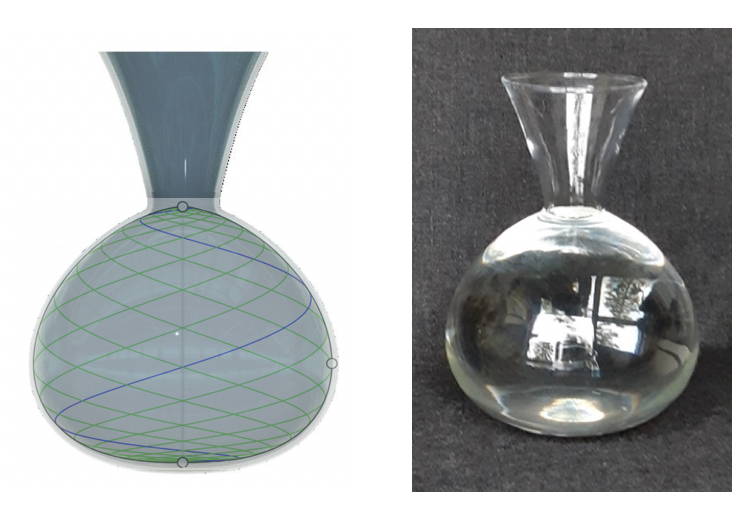
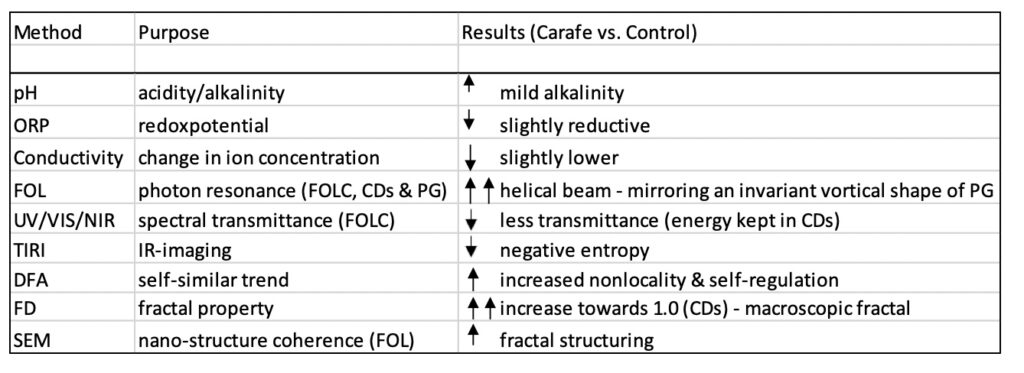
An accurate wood-form was produced and a full-sized test carafe (FTC) with an exact rounded bottom was blown (Cerva, Czech Republic; made of approximately 70% quartz glass). Figure 7 shows the FTC: as 3D CAD model with its superimposed path curve form in (A) and the resulting test carafe in (B).
All performed tests up to this point had confirmed a high-grade energy state in the stored water, but the first FTC proved to have functional and aesthetic disadvantages related to practical handling. It was accordingly decided to redesign the carafe with an objective to obtain a functional form for practical application: with an appropriate throat and a small flat bottom for balance, plus a small form compensation for an unavoidable added wall thickness at the bottom.
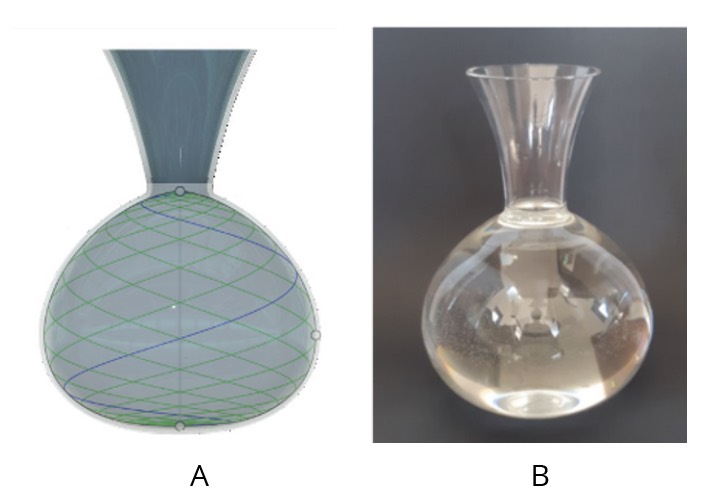
A revised accurate wood form was produced, and a prototype series of full-scale design carafes (FDCs) were blown for the following high-grade energy testing (Fig. 8). Two FDCs were finally used for full-scale studies on water compared to a 500 mL control beaker. Experimental and control local mineral water were conditioned at ambient conditions for 24 h before TIRI and analysis of water chemistry (pH, redox potential, and conductivity), repeatedly, for four days.
Redox potential, pH, and conductivity (iii)
Local mineral water (Maglehem, Sweden) was stored and conditioned in a 500 mL beaker (control) or in the full-sized carafe filled up to the neck and conditioned for 24 h at ambient room temperature before starting the analyses. The redox potential (ORP), pH, and conductivity were measured using an Inolab 740 multifunctional meter (WTW International, Stockholm, Sweden) as in previous studies (Johansson and Sukhotskaya, 2012; Johansson and Lukacs, 2019; Johansson et al., 2021). The ORP was measured using a SenTix® ORP electrode (WTW International, Stockholm, Sweden). The pH was measured using a high-stability Schott A77803K pH electrode (Schott AG, Mainz, Germany). The conductivity was measured using a TetraCon® 325 standard cell (Fisher Scientific, Gothenburg, Sweden). All three electrodes were located 2 cm below the surface of the bulk water sample. The ORP, pH, and conductivity electrodes were calibrated every day. The variation in the electrochemical stability of the ORP electrode was ± 5 mV. The ORP of the control or FDC water (25 mL) stored in a 30-mL plastic or glass beaker (Fisher Scientific) was measured every 60 s for 120 min. The pH was followed in 25 mL of water for 90 min until stability was reached. The conductivity was also followed in 25 mL of water for 60 min. Data were collected using Multilab® pilot software. The ORP, pH, and conductivity were measured as the mean ± SD of three water samples, each analyzed in triplicate.
Fractal Optical Lattice (FOL) – Photonic absorber/transmitter (iv)
A thermo-stabilized transparent polyethylene terephthalate (PET) foil (Kemafoil®HSPL 20), 50 µm thick, covered with self-assembling pyrogenic, porous, and high-internal-surface-area silica agglomerates, was obtained from Coveme s.p.a. (Italy). During an etching procedure, the pyrogenic silica nanoelements (average size 20–30 nm) (Fig. 9A; Scanning Electron Microscopy (SEM)), were melted to a depth of 500–1000 nm into the PET surface, under which these silica nanoelements coalesced by self-assembling to form porous growing silica agglomerates (silica-PET) (average size 50–250 nm), anchored to the substrate and remaining embedded during solidification (Fig. 9B).
The silica-PET structure exists as a porous amorphous (transparent) and semi-crystalline polymer (Zachmann and Wutz, 1993). This semi-crystalline material can appear transparent (particle size <500 nm) or opaque/white (lamellar particle size up to several microns), depending on its crystal structure and particle size. It is known that the crystalline fraction within the lamellar stacks of the silica-PET material is considerably larger than the overall degree of crystallinity (Crutz et al., 1991). The lamellar stacks consist of 3–6 coherently scattering crystal lamellae, while the amorphous regions outside the lamellar stacks are larger than those within the stacks. Hence, the polymer consists of a differentiated distribution of amorphous and crystalline regions, i.e., acting as a metamaterial. The coherently scattering crystalline lamellae can be correlated to coherent light paths through the polymer that are similar in size or smaller than the wavelength of incident visual or thermal light (Soukoulis and Wegener, 2011).
Given the morphology of the regular structure of amorphous and semi-crystalline porous nanostructured silica-PET agglomerate and the photonic interaction of encapsulated nonlinear liquid low-density water, a fractal coherent trajectory landscape is constituted, which may contribute to novel plasmonic wave-guiding properties and formation of surface plasmons (Soukoulis and Wegener, 2011; Wurtz et al., 2011).
Exact pieces (15 × 45 mm) of the silica-PET foil were each equilibrated and conditioned in control (FOLCW) or full-sized carafe (FOLC) stored water for 24 h at ambient temperature (23°C) and subsequently air-dried overnight at ambient temperature. The inherent nonlinearity of the electromagnetic propagation of simulated incident photons (Johansson and Lukacs, 2019) through the fractal route of the control and experimental silica-PET lattice was recorded by UV/VIS/low NIR spectroscopy and evaluated by their difference in transmittance spectrum, which enables an approximate percentage quantification of the low-density water molecular cluster balance of the carafe water. The propagation of low intensity simulated light through the PET-silica lattice implicates a fractal nature of the lattice itself with a Fractal Dimension of 1.68, generating stable and repeatable nonlinear oscillations in the visible and LNIR wavelength range (Johansson and Lukacs, 2019).
UV/VIS spectroscopy (v)
Experiments with UV/VIS/low NIR (LNIR) spectroscopy (190–1100 nm, LNIR 700–1100 nm) intended to simulate the photonic properties of the silica-PET foils were performed using a double-beam T 80+ UV/VIS spectrophotometer (PG Instruments Ltd, UK). The cell holder was partly modified by a set of two staples (20 × 45 mm) connected on the front of the experimental cell holder and on the reference cell holder, respectively. A piece of the experimental silica-PET foil (15 × 45 mm) was positioned in the experimental staple. The control foil was positioned likewise in the control staple. The operating mode was set to the absorbance spectrum. The incident light path length was 10 mm, scanning wavelength range was 190–1100 nm, and scan speed was set to medium. The cell holder compartment was thermo-stabilized at 30°C. To sort out the absorption optical density attributable to the silica-PET film itself, baseline correction was initially conducted in each series of experiments using a control silica-PET film positioned in both staples. The UV/VIS/LNIR spectrum was recorded for the baseline silica-PET, silica PET conditioned in control water (FOLCW) and experimental full-sized carafe samples (FOLC) (ten of each specimen). The data were collected and displayed by the software supplied with the spectrophotometer.
The frequency spectrum of the simulated UV/VIS/LNIR absorbance data was evaluated by means of Fourier analysis (Web ref. 8) (Johansson and Sukhotskaya, 2016).
Thermal Infrared Imaging (TIRI) (vi)
Thermal infrared image (TIRI) frames (1 cm2) were acquired using a RAZ-IR Thermal camera system 8–14 µm LWIR (collecting emitted light [photons] from the surface of water samples), thermal sensitivity ≤100 mK at 30°C, thermal resolution 160 × 120 pixels/frame, 25 µm; Sierra Pacific Innovations Corporation, Las Vegas, NV, USA) (Johansson and Sukhotskaya, 2012). The equipment was set up in a very clean closed room used for analytical measurements. A sheet of aluminum foil was placed on a table beneath the camera to standardize the background emissivity. The camera was mounted and secured on a plastic stand and oriented vertically with the lens focused at 7 cm (fixed position) from the top of two 45 × 10 × 10 mm vertical polystyrene optical cells (D-51588; Sarstedt, Aktien Gesellschaft & Company, Nümbrecht, Germany) containing 5.0 mL of control or experimental water. The cells were positioned and secured in an upright position 1.0 mm apart and conditioned at room temperature for 60 min before measurement. Importantly, during the development of the TIRI method (given reference) the equilibration time of 60 min was found necessary to stabilize the TIRI temperature of the 5 mL volume of water. Following “power on,” the camera automatically performed three non-uniformity calibrations (NUCs) after 5, 25, and 45 s. While turned on, the camera automatically performs NUCs at regular intervals. NUC allows automatic clean-up of the image noise, ensuring the normalization and sharpness of the live image. Six repeated image frames were acquired in sequence on a total of 20 water samples collected from each FF (measured at random intervals for two months) or FDCs and saved for image analysis (i.e., temperature profiles of the pixel area and graphical representation of temperature data) using IR Analyzer software (Sierra Pacific Innovations Corporation). The temperature data were obtained from a defined pixel area of the water surface in each of the two cells; the image frames were transformed into numerical data by the IR Analyzer software and exported to an Excel spreadsheet for statistical evaluation.
Detrended Fluctuation Analysis (DFA) (vii)
Detrended fluctuation analysis (DFA) (Goldberger et al., 2002) (Web ref. 9) determines the monofractal scaling behavior of numeric data (e.g., time series data) in the presence of possible trends without knowledge of their origin. The DFA algorithm permits the detection of intrinsic self-similarity embedded in a non-stationary time series. Monofractals are homogeneous in that they have the same scaling properties, characterized by only one singularity exponent throughout the signal (Goldberger et al., 2002).
To illustrate the DFA algorithm briefly the original integrated time series of data is divided into boxes of equal length, n. For each box of length, n, a least square line is fitted to the data. The calculation is repeated over all time scales (box sizes). The root mean square fluctuation of the integrated and detrended time series, F(n), behaves as a power-law function of n and a log-log graph of F(n), against n is constructed (Peng et al., 1994).
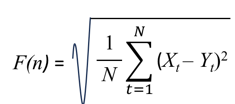
(1)
A linear relationship on the log-log graph indicates statistical fractal self-similarity expressed as F(n) α nd. The DFA exponent, d, is defined as the slope of the regression line log n vs. F(n). A DFA exponent in the range 0.5 ≤ d ≤ 1 indicates long-range power-law correlations growing stronger toward 1, the larger the value of d, the smoother the time series. In this context, DFA can be interpreted as a compromise between the complete unpredictability of white noise (d ≤ 0.5) and the smoother landscape of Brownian noise (d ≥ 1.5). The monofractal DFA exponent was calculated on TIRI temperature pixel data obtained on water, using PhysioNet software (Web ref. 9), to serve as a quantitative index of the inherent photonic monofractal scaling properties of control or experimental distilled or local mineral water.
Fractal dimension (viii)
Fractals are self-similar patterns over a range of magnification scales, resulting in visual stimuli that are inherently complex and organized. The fractal boundaries have a fractal dimension (FD) between 1 and 2 (FD ≥ 1 or ≤ 2 indicate the presence of fractal properties), where fractal and fine scale complexity grows stronger toward 2.
The fractal dimension was calculated on graphic black and white images of the full-sized carafe using the Box-Counting method with Benoit 1.3 software (Web ref. 10). The method covers the image with a computerized mesh of identical size-d squares in the 2D plane. The number of squares, N(d), with a self-similar pattern was counted. For comparison, decreasing the square size repeatedly fills the image with the pattern at different magnifications, allowing scale invariance, a characteristic of a fractal pattern, to be identified. The FD is an estimate of the linear portion in log scale of the behavior of the power-law function:
N(d) = 1/dFD (2)
A set of measurements on three separate graphics of the carafe gave the mean FD value.
Scanning electron microscopy (ix)
Scanning electron microscopy (SEM) micrographs of pyrogenic silica nanoelements and silica agglomerates embedded in the PET foil were obtained using a Zeiss EVO LS10 scanning electron microscope equipped with an LaB6 filament. Imaging was conducted in high-vacuum mode using a secondary electron detector at an accelerating voltage of 15 kV, a probe current of 50 pA, and a working distance of 5–7 mm. Samples were attached to alumina SEM sample stubs using carbon adhesive disks (Agar Scientific, UK) and sputtered with gold for 40 s using an Agar Scientific automatic sputter coater at a current of 30 mA and a pressure of 0.08 mbar. A conducting silver bridge was painted from the top of the sample down to the stub using Electrodag 1415 conducting silver paint (Agar Scientific) (Falkman, 2017).
CAD modeling (x)
Autodesk Fusion 360 (Web ref. 11) software has been employed for all CAD modelling. Basically, 2D path curves of different lambda values have been plotted and rotated to form 3D shapes that have been used for making all the patterns and molds for high-accuracy glass blowing.
Statistics
Descriptive statistics were evaluated using SPSS Statistics for Windows v.27. Armonk, NY: IBM Corp. USA). Data are presented as means ± standard deviations and a probability level of p<0.05 was considered significant.
Results
Fractal scaling and TIRI temperature
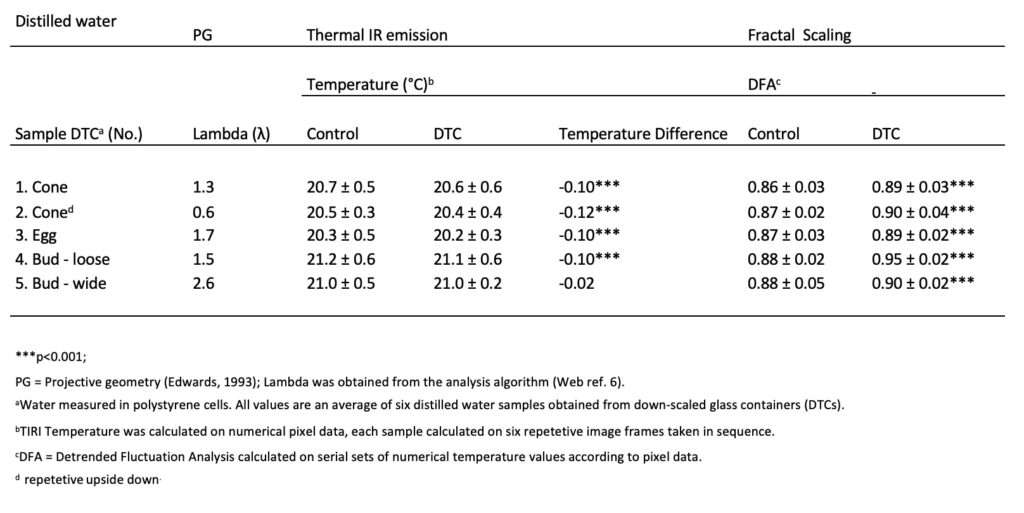
Downscaled Glass Test Containers. From the pre-study on DTCs filled up with distilled water, the differences in temperature (Table 1) between control and experimental water show that all DTCs except No. 5 were significantly decreased (p<0.001). Additionally, the change in the DFA value showed a significant increase (p<0.001) in all DTCs, with the most significant rise (0.95 ± 0.02) in DTC No. 4, and thus this was selected for full-sized carafe production.
From the observations on DTCs, the scientific hypothesis was confirmed; four out of five DTCs, all with different path curves and lambda values, generated “high-grade energetic imprints” related to formation of its low-density water state, evaluated by its lowered IR emissivity, decreased TIRI temperature, and increase in the monofractal scaling behavior of DFA.
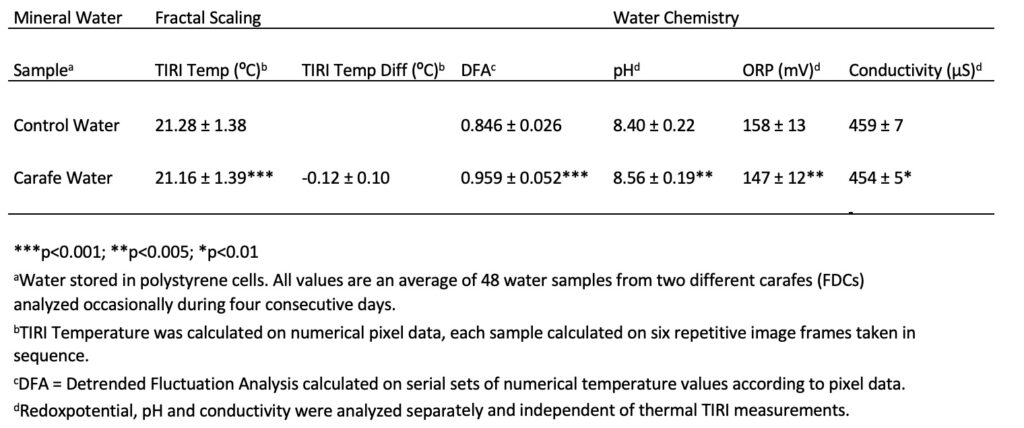
Full-sized final carafe. The mean results for fractal scaling properties (DFA exponent), and water chemistry (i.e., pH, redox potential, and conductivity) are shown in Table 2.
The thermal IR emissions and water surface temperature in the water samples from the full-sized carafe are lower than the control water, as illustrated in Table 2 and Figure 10. The molecular ordering of water obtained from the carafe generated a decrease in mean surface temperature of 0.12 ± 0.10°C (p<0.001).
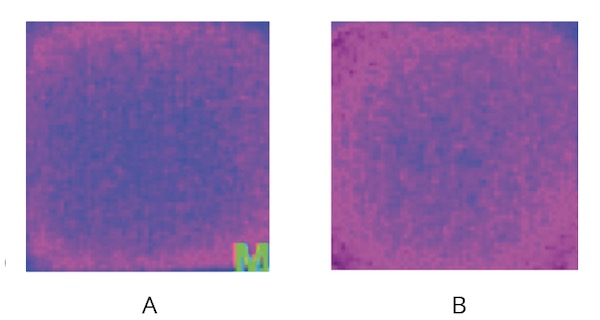
control water (A) and carafe water (B) stored in 5-mL
polystyrene cells. The image of the carafe water shows a higher state of structural organization of the liquid water. The mean TIRI temperature of the given single carafe sample was on average 0.3°C lower in experimental water. The temperature is decreasing according to the color gradient blue, blue/red, and red.
Due to the continuous change in daily environmental temperature and a previous observation that, during cloudy and rainy days, the temperature difference between control and experimental samples is less compared to sunny days, repetitive measurements were performed for several days (the mean TIRI value is obtained from 48 water samples measured occasionally for four days).
The structural ordering of the carafe water is illustrated by the red color zone (Fig. 10 B) (the temperature decreases according to the following color gradient: blue, blue/red, and red) along and close to the wall of the polystyrene cells, following a subsiding circular low-density fraction gradient decreasing from the external to the internal part. The IR emissions from the more distant regions in the center radiate normally. The IR radiation from the carafe water (Fig. 10 B) close to the interfacial zone expands toward the center and covers the entire water surface, following a lower peripheral IR emission with an increase in emissivity toward the central part. The structurally ordered circular gradient water layer shows the consistency with a plausible distribution in the volume of the low-density fraction.
The results of DFA analysis (Table 2) reveal a clear power-law relationship in the thermal IR emissions from water obtained from the carafe water. The DFA exponent increased significantly (p<0.001) from 0.846 ± 0.023 (control) to 0.959 ± 0.052 in water from the carafe. The change in DFA exponent shows that the flickering of thermal IR emissions is characterized by highly persistent long-distance attraction due to non-thermal interaction among water molecules in the increased low-density coherent fraction. The interaction of water molecules with the confined IR electromagnetic field makes all molecules oscillate in unison (Shimokawa et al. 2004; Yokono et al., 2009; Katsir et al., 2007; Johansson and Sukhotskaya, 2012), in tune with many self-trapped photons and a sizeable electromagnetic field, giving rise to a common phase within extended mesoscopic space regions, i.e., formation of coherent domains (CDs) (Del Giudice et al., 2009; Marchettini et al., 2010). In water CDs, the thermal fluctuation is aligned with and unifies the magnetic field oscillations of freely moving electrons, leading to long-range oscillation and structural stabilization among the coherent water clusters (Johansson and Sukhotskaya, 2012). Thus, the existence of CDs implies the presence of ordering magnetic fields in ordered water, due to the nonlocal characteristics of the low-density liquid enhanced by the fractal characteristics of the carafe – following its path curve geometry.
Water chemistry (pH, ORP, and conductivity)
The mild changes in pH (p<0.005), ORP, and conductivity (p<0.01) in water from the carafe (Table 2) are consistent with the state of water CDs, where the importance of long-range ordering with exceptional stability and feedback dynamics reflects the self-organizing ability with extended coherence of the inherent oscillations produced by the system itself (Fröhlich, 1969; Del Giudice et al., 1985). The storing of further energy in the form of self-trapped electromagnetic (IR) modes implies the choice of higher energetic levels occupied by the quasi-free collective electrons (cold vortexes) at the periphery of each CD of water. This implies a lowering of ORP (less energy required to extract electrons out of a CD, thus more reducing power and ability to donate electrons also to those solutes that subtract them), and a consequent tiny prevalence of OH-groups with respect to H+ and a mildly more alkaline pH.
The pH of the control water was 8.40 ± 0.22 and the concomitant pH of carafe water was 8.56 ± 0.19.
The shift toward a decrease in ORP from 158 ± 13 mV (control water) to 147 ± 12 mV (carafe water) accompanied by the rise in the pH of the ordered carafe water indicates the self-regulative dynamics of circulating water aligned with long-range oscillations and lowered intrinsic entropy. This gives rise to structural ordering and allometric scaling behavior, all of which are characteristic of dissipative structures (Turning, 1952; Del Giudice and Tedeschi, 2009). Accordingly, the significant change and decrease in ORP substantiates the existence of stabilized reductive water CDs that enable a reservoir of quasi-free electrons (Voeikov and Del Giudice, 2009).
As the coherent ordering of water increases, the descending temperature will result in the dissolution of fewer mineral salts and a tendency to exclude tinier particles, so the electric conductivity will subside (Israelachvili, 1992, Johansson and Sukhotskaya, 2012, Johansson et al., 2021). Besides, since hydrogen ions concentrate at the boundary between the negative surface of CDs and the bulk volume of water, a small decrease in electric conductivity follows. The electric conductivity decreased equally and significantly (p<0.01) from baseline (459 ± 7 μS) in control water to 454 ± 5 μS in carafe water.
UV/VIS spectroscopy
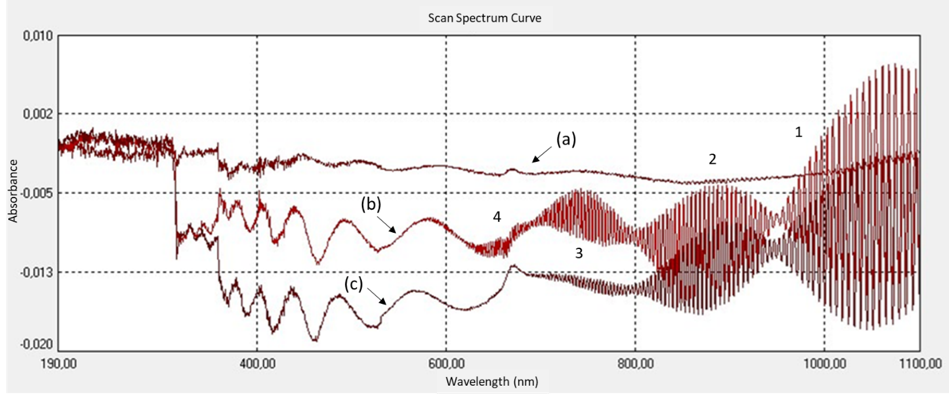
The significant rise in DFA-value related to the TIRI of carafe water (Table 2) is illustrated and replicated in the UV/VIS/LNIR transmittance curve of simulated light waves as obtained by the FOLC (Fig. 11) and reveals a clear power-law and nonlinear fractal scaling relationship of resonant coherent modes. The scaling behavior of the FOLC, acting as a photonic transmitter (Dekker et al., 2008) of incident electromagnetic radiation, is characterized by high persistence and strong long-term memory, describing the transmission of novel fractal FOLC photonic radiance in the optical and LNIR spectral range. The coherence of simulating incident low-intensity propagating waves aligns with a fractal arithmetic clustering shape of the FOLC resonance structure, which possesses fractal and electromagnetic stationary-wave dynamics characterized by multifrequency behavior within the relevant spectral wavelength range of the light spectrum. The DFA of FOLC follows a fractal trajectory that translates macroscopic structural coherent dynamics of the fractal PG carafe characteristics into self-similar fluctuations in the radiation of engaged quantum-entangled photons.
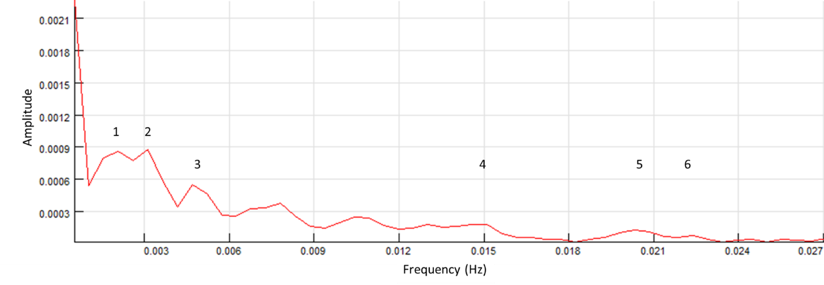
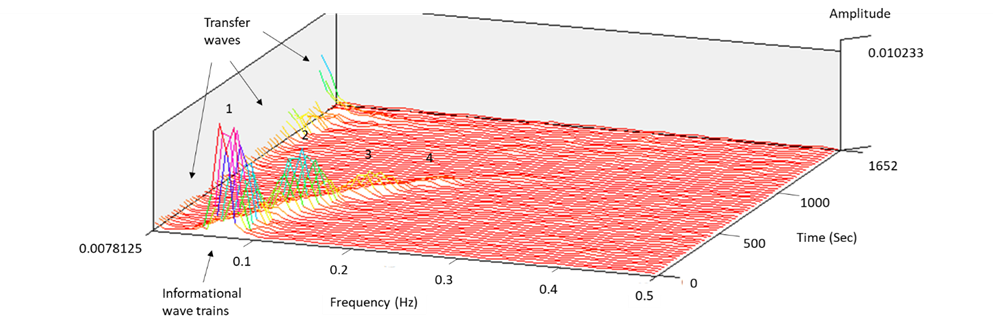
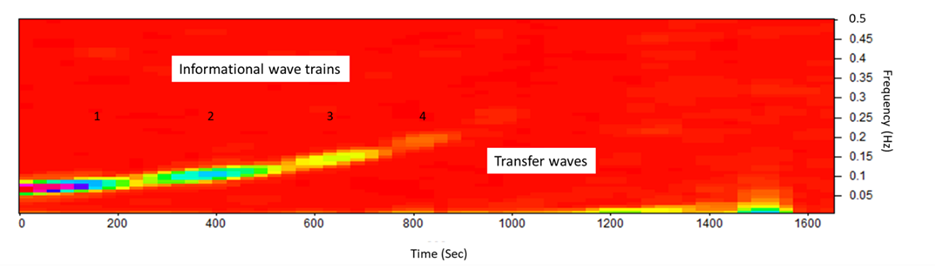
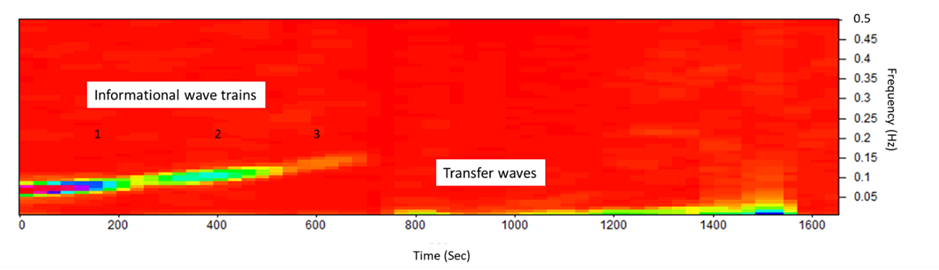
The propagation of low-intensity spectral light through the fractal island geometry of the FOLC (Figure 9) generates stable and repeatable nonlinear coherent oscillations in the visible and LNIR wavelength range between 340 and 1100 nm (equally to 3.65–1.13 eV) (Fig. 11). Two interlocked wave structures were identified as long-period waves (ten frequency components in the frequency range of 0.52–22 MHz) (Fig. 12A) and short-period coherent wave trains (a serial set of four wave trains in the frequency range of 0.07–0.21 Hz) (Fig. 12B and C). Similarly, twelve long-periodic waves of FOLCW appeared in the wavelength range of 0.52-21 MHz and three short periodic coherent wave trains of 0.07-0.156 Hz (Fig.12 D).
The formation of periodic waves that are highly coherent (Wolf, 2007) and organized as a stable pattern of repeating waves, with a decrease in oscillatory frequency with increased scanning spectral wavelength, implies that the two interlocked waves follow a 3D vortical path, one low-frequency “transfer” wave (unmodulated wave) (Kim, 2013) and the other “informational” (a gain in information relates to a decrease in entropy, i.e., a gain in ordering) (Tiller, 1997) with a higher frequency and characteristic amplitude-modulated wave trains. Thus, six unique transfer wave frequencies were identified for the FOLC at 2.08, 3.10, 4,68, 15.0, 20.0 and 22.0 MHz (Figure 12A) and one unique coherent wave train in the range of 0.179–0.213 Hz (Figures 12B and C). The “banana curve” evolution (Figure 12 C) follows a self-stabilizing fractal topography (Jin et al., 2017), progressively expressed in a water system with an expanded coherent low-density water fraction. The FOLC and FOLCW encapsulated water CDs of the backbone silica-PET structure transmits highly organized photons, where the two waves are spatially linked in an interlocked configuration (Figures 12B, C and D). Short-periodic LNIR coupled low-amplitude transfer waves are intertwisted with high-amplitude informational waves. The scale-invariant phase profile of the fractal photonic lattice transforms the parallel waves of an incident light mode into the topology of a proposed interlocked helical mode. Thus, a screw-like dislocation of the helical beam appears with its focus to a central axis and with its intensity being redistributed superficially, around the optical axis of a transfer wave, to a vortical ring of light. Importantly, the photons in helical beams carry a conserved orbital angular momentum distinct from their intrinsic spin angular momentum (Allen et al., 1992). Helical beams thus have potential applications in secure and parallel informative communication, with information being carried in topological channels or being encoded in a beam’s topology (Leach et al., 2002).
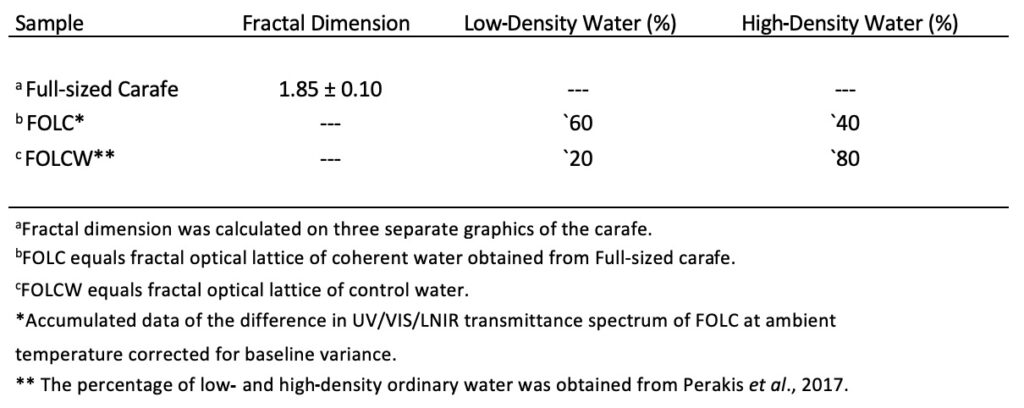
Importantly, the ensemble of quasi-free electrons, present in each CD of water, was excited by the externally supplied energy from the simulated incident spectral waves, represented by long periodic oscillations (3.65–1.13 eV) in the wavelength range of 340–1100 nm, similarly short periodic oscillations (2.25–1.13 eV) between 550–1100 nm and, particularly, short-periodic coherent oscillations (1.91–1.13 eV) at 650–1100 nm (Figure 11), producing “cold” electron vortices, since the electrons are in a coherent state (Del Giudice et al., 2009). The excitation of vortical energy cannot be released, neither thermally nor electromagnetically, which explains the extreme stability of excited expanded water CDs, shown in less transmittance of simulated light through the FOLC resonance structure (b) (Figure 11). The accumulated data of the difference in UV/VIS/LNIR transmittance spectrum between FOLC (b) and FOLCW (c) at ambient temperature, each corrected from baseline variance (a), illustrates a shift in adjustable fluctuations of water molecules toward a non-local low-density balance of water molecular clusters (60%) of the FOLC, compared to the approximate 20%/80% low-density/high-density ratio of ordinary control water of the FOLCW (Table 3).
The FOLC’s allometric scaling behavior, i.e. its fractal nature, allows the exchange of energy and entropy with the environment and permits the use of the FOLC in its ability as a metamaterial to create independent tailored electromagnetic responses in incident radiation, i.e. to change the allometric dimension of incident EMF waves into fractal nonlocal oscillations and to lower the intrinsic entropy, fostering the coherence of oscillating transfer and informational waves, both of which are characteristic of a dissipative structure (Turning, 1952; Prigogine and Nicolis, 1977). The plasmonic behavior of the coherent electron oscillations of the FOLC strongly confined to the interface surface between silica-PET and encapsulated water CDs enables a strong resonant enhancement of the local density of photon states (Boriskina, 2013). The nonlinear coherent state of surface plasmons makes the interplay of local EMFs very important for efficient frequency conversion, i.e., from the 1016 Hz frequency range of plasmons to the oscillations in the hertz range of simulated UV/VIS/LNIR transmittance of ordered photons obtained from FOLC and FOLCW. These nonlocal low-entropy photons can be trapped in water (Johansson and Sukhotskaya, 2012), building a sizeable EMF in this region and giving rise to co-resonance of molecules of the same species; this produces a unified oscillation phase of all the trapped molecules used to charge and displace the equilibrium toward the dominance of water CDs (Del Giudice et al., 2010). In this process, atoms and photons lose their original identity, being raised to energized matter made up of quasi-particles entangled in the CDs.
Fractal dimension
The mean peak preference FD of the carafe was 1.85 ± 0.10 (Table 3). Figure 13 shows an example of the FD boundary log-log plot figure of the carafe fractal shape, illustrating the fine structure and high ordering of fractal complexity.
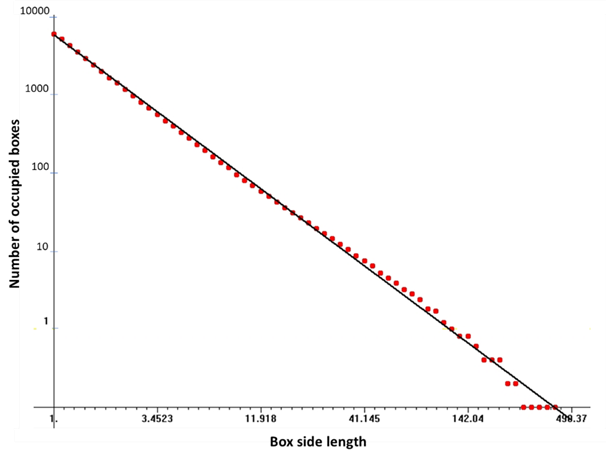
This means that the boundary of the carafe PG geometry keeps a high DFA value of contained low-density water, which corresponds to FD close to the fine scale boundary optimum value of 2, and equally adjacent to FD of the highly complex curve boundary of the classical Mandelbrot set (Bown, 1991), acting as a driving force in the formation of a coherent liquid low-density state of carafe water. Thus, this follows a natural fractal self-assembling process, supported by formation of a correlation wave, bringing elementary components phased-locked in their in-tune oscillations (Matija and Koruga, 2002), by embracing and keeping numerous nested hierarchies of oscillator cycles interacting globally without self-interference and manifesting as a general phase-correlation all over the system. Consequently, the perfection of balance of ordering of PG geometry renders the carafe as a highly complex macroscopic fractal, self-similar on all scales (Fig. 14) (Vitiello, 2012), which maintains a coherent liquid water state and engenders ordering in water enforced by the assembly of coherent fractal CDs, through resonance on different fractal scale levels of ordered liquid water.
Discussion
From the present results, the quantum characteristics of fractal coherent liquid water, as resonating with and captured from the fractally inductive nature of the macroscopic fractal carafe, relate to the quantum electrodynamic (QED) theory (Del Giudice et al., 1985; Madl and Renati, 2023) and particularly the uncertainty relationship (Preparata, 1995). Accordingly, the coherent state was evoked by the interaction between the high-entropy photons of incident ordinary daylight with impact on the high/low-density ratio of liquid carafe water. Referring to the theory of dissipative systems’ ability to self-regulate (Prigogine and Nicolis, 1977), it was implied that the exchange of energy and entropy with the environment relied on the fact that the absorption of spatially self-organized low-entropy photons of incident light into high-grade energy with low entropy displaces the bi-phasic equilibrium toward a dominance of coherent eigenstates of low-density water CDs (Voeikov, 2001).
When energy from the quantum field was captured by the incident photons, they were self-trapped and turned into an excited state of coherent photons oscillating in unison with the quantum electromagnetic field (EMF) (Del Giudice et al., 1985). At this point, the Lamb-like shift (which would constitute a negligible contribution, 1 ppm to the total energy of the system), becomes relevant when a critical number of coherent water molecules are tuned together and are enclosed within the CDs, where a phase transition occurs toward a state whose ground energy (vacuum level) of each oscillator/molecule is lower than the one proper to the uncorrelated/isolated components. The coherent oscillations of the molecules in the CDs no longer require any external supply of energy. The coherent state has lower energy than the non-coherent state, providing a ground configuration where molecules keep their electrons tightly bound (ionization energy is 12.6 eV), and the excited expanding state where one quasi-free electron oscillates at 12.06 eV – thus, 0.54 eV below the ionization potential and corresponding to a water CD size of 0.1 µm with variant shapes, forming a reservoir of millions of quasi-free electrons that are easily excitable (Del Giudice and Tedeschi, 2009).
The propagation of simulated low-intensity spectral light through the fractal island geometry of the FOLC gives rise to a number of collected external high-entropy excitations, whose entropy is low (high-grade and low-entropy energy) where inherent oscillations of water CDs occur in the range of 1.13–3.65 eV of simulated incident light. The spectrum of excited water CDs is limited upwards by the energy gap, which is 0.26 eV per molecule; since in a CD there are about six million molecules, it is apparent that the high entropy-uptake spectrum of an isolated CD has practically no upper limit (Del Giudice and Preparata, 1998). This means that within CDs it is possible to store amounts of energy that reach the visible and the invisible light of UV, IR, and micro-wave spectra (Gudkov et al., 2011). In this way, the water CD would become an extensive energy converter, also aligning with Earth’s magnetic field, and transform environmental energy into high-density energy, able to induce electronic excitations in guest molecules, e.g., in the biomolecules surrounding the CDs. Since biomolecules constitute only 1% of the number of water molecules, these “guest” molecules become part of the resonant coherent dynamics of water (Del Giudice and Tedeschi, 2009). Following nonlinear dynamics, the extended coherence, where CDs of water and “guest” molecules become components of even more extended “super-coherent domains,” i.e., a hierarchy of levels of coherence, could be various physiological organs where the entire system is able to act as a self-organizing living system with biophilic impact on the healthy physiological aqueous state in, e.g., healthy humans (Johansson, 2008; Johansson, 2009; Johansson and Sukhotskaya, 2016). Thus, the whole organism is a quantum system with a multi-well energy profile. The lowest ground energy state corresponds to the healthy state of the entire organism (Brizhik et al., 2009).
The onset of coherence among low-density water CDs allows the formation of much spatially wider molecules because they are a combination of the ground state and a much more extended excited state. Thus, low-density water molecules become tightly packed together in extended regions of coherence, whose size is governed by the wavelength of the light mode responsible for its formation (Del Giudice and Tedeschi, 2009). The corresponding frequencies of the vortical path of the transfer or informational waves of either the FOLC or FOLCW become smaller and smaller by increasing the coherent water low-density molecular size in this region, with a breakthrough in the LNIR wavelength range above 650 nm, initiating formation of highly fractal sets of coherent low-density water, where molecules are oscillating in tune with each other within a self-trapped EMF. It is conceivable that irradiation from LNIR up to microwaves could gain, in the support of dissolved atmospheric gases, an extended coherence of liquid water (Katsir and Miller, 2007; Alexanderson, 2002; Bartholomew, 2003; Web ref. 12).
The fluctuation of local structures of surface-coated high- and low-density water of FOLCW and FOLC, respectively, with reference to FOLCW (dominating around 80%) is shifted toward a dominance of the low-density liquid of FOLC by changing the background oscillatory nature of the CDs. The mode of the quantum field high-grade working frequencies of incident photons, being self-trapped in extremely stable cold vortices and becoming coherent photons in the excited state, oscillates in phase with the quantum electromagnetic field, which governs the local evolution of the entire system (Del Giudice et al., 2005). Equally, this is confirmed by the fractal scaling boundary of thermal IR emission flickering of the full-sized design carafe coherent water state, which implies the presence of nonlocal ordering magnetic fields, due to the fractal characteristics of the PG-shaped carafe. The time-dependent set of unique working frequencies, following the topology of an intertwined helical light mode, constitutes its “identity and specificity” and its non-random evolutionary path given by the thermodynamic and electrodynamic boundary conditions – a point where a coherent system can respond to any given incident external perturbation (Del Giudice et al., 2005).
The macroscopic fractal FD boundary of the carafe revealed a direct correlation between path curve surfaces extracted through the PG design and the observed coherency of low-density water and the FOLC. A further outline of PG theory has raised some interesting questions, particularly in relation to the apparent wave guiding characteristics of the FOL device: I) In extraction of 3D path curves the 2D invariant analysis triangle (see Background – What is path curve geometry) is exchanged with an invariant tetrahedron, where the “semi-imaginary” variant has two of its intersection points “circling at infinity” (Edwards, 1993). Could this PG-aligned tetrahedron tentatively enable a significant structural resonance with the tetrahedral molecular structure of low-density water? II) In the invariant tetrahedron, the lambda factor, is extracted from the relation between multipliers (“speeds” according to Edwards, 1993) of logarithmic spirals on two invariant planes of the semi-imaginary tetrahedron. Can this relationship be correlated to the unique transfer and informational waves of the FOLC? III) Can a direct correlation be found between path curve extractions, e.g., expressed through lambda values, and the fractal boundary of the carafe?
In approaching such (vaguely outlined) hypotheses, one would need to start out from an analysis of three-dimensional path curve geometry. That has not been necessary in this study because extraction of 3D form has been explained through spinning 2D path curve contours around the vertical side of the invariant triangle, which is a simpler method. But our main observation of an increase in low-density water obtained from a PG-designed carafe, confirmed by six independent analytical methods, strongly suggests that projective geometry may be of importance in future research on water´s high-grade and low-entropy energy extraction.
In view of the novel observation that the coherent water of living cells, where each water molecule adjacent to bio-surfaces is in the range of a few hundred angstroms, assumes a soft glassy rheology (Zhou et al., 2009), which probe a mechanical behavior and robustness of the cell under different modes of stress and deformation, and is essential to its function and survival. Interfacial and intracellular water is directly involved in the formation of amorphous matrices, with glass-like structural and dynamical properties. It is postulated that this glassiness of water, geometrically confined as a temperature-dependent fluctuation equilibrium model, is associated with formation of a tetrahedral low-density water structure, which is commonly observed in amorphous quartz and other tetrahedral structures (Shi and Tanaka, 2020; Perakis et al., 2017). In contrast, the characteristic of high-density water is that it lacks tetrahedral symmetry in ambient conditions. The glassiness of physiological water, geometrically fine-tuned by the presence of solid intracellular surfaces, is proposed as a key characteristic exploited by nature as a mechanism able to regulate the timescales in cellular protein solvent dynamics and protein turnover times, to sustain biological functions (Pagnotta and Bruni, 2007). Equally important is that the same mechanism can balance biological processes as a protection against extreme conditions such as low temperature or dehydration (Pagnotta and Bruni, 2007).
More precisely, aligned with the low-density water molecule, silica or quartz has a tetrahedral geometry, and oscillatory frequency in accordance and coupling with certain oscillatory modes of the quantum field (Carfora, 2009), enabling a significant structural resonance across these quintessential domains (Brizhik et al., 2009). When water enters a resonant state with coherent partners in the CD, as well as its capacity to hold information being potentiated, the excited increase in energy could be transferred in one stroke, where the non-local phase velocity, entanglement and resonance among systems enables a unified oscillation at the same mode and turns phased-locked (Del Giudice and Vitiello, 2006). The FOLCW, and particularly the FOLC, with its porous high-internal surface area of tetrahedral amorphous silica nanoelements, encapsulated with the nonlinear tetrahedral low-density liquid, may contribute to the plasmonic coherent wave-guiding properties with a unique set of resonant coherent oscillations (Soukoulis and Wegener, 2011). Thus, the FOLC device serves as photonic metamaterial, composed of tailored micro- or nanostructured coherent subwavelength building elements that are similar or smaller than the incident wavelength of light. This densely packed concept provides an anisotropic metamaterial with enhanced nonlinear optical properties and acts as a fractal photonic scale-invariant coding device. Consequently, governed by extensive percentage rise in low-density water CDs, the highly coherent interaction between the tetrahedral configuration and fractal ordering of the PG-designed glass carafe, and its extended region of a highly coherent functional water, increases its bioenergy. Thus, the highly ordered water turns it more bioavailable, optimizing healthy conditions, growth, and vitality, certainly in healthy humans (Johansson and Sukhotskaya, 2016).
The interplay between the electromagnetic field and water chemistry depends on the collective oscillation of all the CDs. Because of the coherence, as an excitation of the electromagnetic field trapped in the CDs of the low-density state of carafe water, the ensemble of CD quasi-free electrons could either give rise to excited cold vortices or be released out of the CD, either by quantum tunnel effect or by mild external perturbation (Del Giudice and Tedeschi, 2009; Del Giudice et al., 2010). The second consequence accounts for the presence of electron transfer properties of the carafe coherent water. The interface between CDs and the bulk volume of high-density water becomes a redox pile (Szent-Gyorgyi, 1960), where enough electrons are easily releasable to account for a reduction in carafe water ORP. The release of electrons from water CDs in the low-density fraction of water leaves behind alkaline hydroxyl ions, which reach the high-density fraction of water, supporting the rise in pH (Johansson and Sukhotskaya, 2012; Johansson et al., 2021). The extremely ordered coherent low-density state of carafe water, with a descending temperature, will exclude any mineral salts or particles from the low-density water fraction (Israelachvili, 1992; Johansson et al., 2021).
Conclusion
Through correlating measurements of multiple methods, it has been shown that ordinary high-density water can obtain high- and low-density energy through storage in path-curve-shaped glass carafes. We have considered the quantum coherence of water as consistent with the QED theory, giving a straight answer to the question posed in the “Background” section of this paper, that enables the low-density state of still water to transform and transfer energy in water and in biosystems with maximum efficiency and minimum dissipation. The fractal scaling and stabilization of the coherent low-density water fraction of the macroscopic carafe implies a high physical connection of supporting standing waves between merging fractal structural patterns; this is gained by the fractal and geometrical PG architecture of the carafe, its tetrahedral amorphous resonant state of quartz and the molecular tetrahedral arrangement and several fractal scale and coherency levels of low-density water, and the ability of these fractal entities to efficiently disperse energy to be shared between local and global states and donated to any local point where it is needed, and conversely, to be spread globally from any local source. Since the fractal hierarchy arises because incremental processes with matching space-times interact most strongly through resonance, the entire tetrahedron-based arrangement of quantum harmonic vortical oscillators follow a holographic multi-mass structural resonance across all fractal scales. Equally, this is tentatively transferable to healthy human physiological conditions, promoting its biomimetic potential.
Acknowledgments
We thank Florin Secosan for all his projective geometry elaborations and calculations of the carafes in the project’s initial phase. And thanks also to Graham Calderwood, who contributed to the project with his general path curve algorithm and supportive advice regarding elaborations of projective and fractal geometries. We would further like to thank Stefano Farvero and Luigi D’Arco at Coveme s.p.a., Italy, for their professional guidance and technical information relating to the fabrication of the PET foil.
References
Ahnblad P, Nordkvist A (2017). A randomized, placebo-controlled double blind, parallel groups study evaluating the performance and safety of a steady state coherent biomodulator patch in the treatment of subjective tinnitus. Int Tinnitus J 21 (2): 157–167.
Allen L, Beijersbergen MW, SpreeuW RJC, Woerdman JP (1992). Orbital angular-momentum of light and the transformation of Laguerre-Gausian laser modes. Phys Rev A 45: 8185-8189.
Alexandersson O (2002). Living Water. Gill Books (IRL) ISBN, 9-780-71713-390-1.
Almon C (1979). Path Curves and Plant Buds. An Introduction to the Work of Lawrence Edwards. International Institute for Applied Systems Analysis A-2361, Laxenburg, Austria, pp. 1-25.
Bartholomew A (2003). Hidden Nature – the Startling Insight of Viktor Schauberger. Floris Books. ISBN-13, 978-0863154324.
Bown W (1991). Science: Mandelbrot set is as complex as it should be. New Scientist, 28 September, 14.
Boriskina SV, Ghasemi H, Chen G (2013). Plasmonic materials for energy: From physics to applications. Materials Today 16: 379-380.
Brizhik LS, Del Giudice E, Popp FA, Maric-Oehler W, Schlebusch KP (2009). On the dynamics of self-organization in living organisms. Electromagn Biol Med 28: 28–40.
Carfora M, Marzuoli, Rasetti, M (2009). Quantum Tetrahedra. J Phys Chem A: 113 15367-15373.
Coats C (1995). Living Energies – Viktor Schauberger´s brilliant work with natural energy explained. Gateway Books, Bath (UK), pp. 55-76.
Crutz CS, Stribeck N, Zachmann, HG (1991). Novel aspects in the structure of polyethylene terephthalate as revealed by means of small-angle X-ray scattering. Macromol 24: 5980–5990.
Dekker R, Usechak N, Först M, Driessen A (2008). Ultrafast nonlinear all-optical processes in silicon-on-insulator waveguides. J Phys D 40 (14): R249–R271.
Del Giudice E, De Ninno A, Fleischmann M, Mengoli G, Milani M, Talpo G, Vitiello G (2005). Coherent quantum electrodynamics in living matter. Electromagn Biol Med 24: 199–219.
Del Giudice E, Doglia S, Milani M, Vitiello G (1985). Elec-tromagnetic field and spontaneous symmetry breaking in biological matter. Nucl Phys B251 (FS13): 375–400.
Del Giudice E, Preparata G (1998). A new QED picture of water. Understanding a few fascinating phenomena. In Sassaroli E, Srivastava Y, Swain J, Widom A. (Eds), Macroscopic Quantum Coherence. World Scientific, Hackensack, NJ, USA, pp. 108–129.
Del Giudice E, Pulselli RM, Tiezze E (2009). Thermodynamics of irreversible processes and quantum field theory: an interplay for the understanding of ecosystem dynamics. Ecol Model 20: 1874–1879.
Del Giudice E, Spinetti PR, Tedeschi A (2010). Water dynamics at the root of metamorphosis in living organisms. Water J 2: 566–586.
Del Giudice E, Tedeschi A (2009). Water and autocatalysis in living matter. Electromag Biol Med 28: 46–52.
Del Giudice E, Vitiello G (2006). Role of the electromagnetic field in the formation of domains in the process of symmetry-breaking phase transitions. Phys Rev A 74: 1–9.
Doczi G (1994). The Power of Limits. Shambhala, Boston & London, 20.
Edwards L (1993). The Vortex of Life. Nature’s patterns in space and time. Floris Books, Edinburgh, pp. 60-339.
Falkman P (2017). The SEM analysis was performed in collaboration with Biofilms – Research Center for Biointerfaces, Malmö University, Malmö, Sweden.
Fröhlich H (1969). Theoretical physics and biology. In Marois M (Ed.) Proceedings of the first international conference on theoretical physics and biology, Versailles 1967. Amsterdam, Holland.
Goldberger GL, Amaral LAN, Hausdorff JM, Ivanov, PCh, Peng CK, Stanley HE (2002). Fractal dynamics in physiology: Alterations with disease and aging. PNAS 99 (19): 2466–24 72.
Gudkov SV, Bruskov VI, Astashev ME, Chernikov AV, Yaguzhinsky LS, Zakharov SD (2011). Oxygen-dependent auto-oscillations of water luminescence triggered by the 1264 nm radiation. J Phys Chem B. 16; 115(23): 7693-8.
Huang C, Wikfeldt, KT, Tokushima T, Nordlund D, Harada Y, Bergmann U, Niebuhr M, Weiss TM. Horikawa Y, Leetmaa M, Ljungberg MP, Takahashi O, Lenz A, Ojamäe L, Lyubartsev AP, Shin S, Pettersson LGM, Nilsson A. (2009). The inhomogeneous structure of water. PNAS 106:15214-15218.
Israelachvili J (1992). Intermolecular and surface forces. Academic Press, San Diego, pp. 282-287.
Jin Yi, Ying Wu, Hui Ki, Zhao M, Pan J (2017). Definition of fractal topography to essential understanding of scale-invariance. Scientific Reports (7:46672)
Johansson B (2008). Heart rate and heart rate variability response to the transpiration of vortex-water by Begonia Eliator plants to the air in an office during visual display terminal work. J Altern Comp Med 14 (8): 993–1003.
Johansson B (2009). Effects of functional water on heart rate, heart rate variability, and salivary immunoglobulin A in healthy humans: a pilot study. J Altern Comp Med 15: 871–877.
Johansson B, Sukhotskaya S (2012). Allometric scaling behaviour – A quantum dissipative state implies a reduction in thermal infrared emission and fractal ordering in distilled coherent water. Water J 3: 100–121.
Johansson B, Sukhotskaya S (2016). Drinking functional coherent mineral water accompanies a strengthening of the very low frequency impact on heart rate variability, and mono and multifractal heart rate dynamics in healthy humans. Func Food Health Dis 6 (6): 388–413.
Johansson B, Lukacs A (2019). Fibonacci optical lattice: A fractal biomodulation device. Fractals 27 (3) 1950039-1-13.
Johansson B, Trousdell I, Capjon J (2021). Energizing water through dynamic flow. Water J 12: 17–27.
Kim Won H (2013). Era for a new paradigm. Vortex Sci Tecknol 1 (1): 1-2.
Leach J, Padgett MJ, Barnett SM, Franke-Arnold S, Courtial J (2002). Measuring the orbital angular momentum of a single photon. Phys Rev Lett 88: 257901.
Katsir Y, Miller L (2007). The effect of rf-irradiation on electrochemical deposition and its stabilization by nanoparticle doping. J Electrochem Soc 154: D249–D259.
Madl P, Renati P (2023) “Quantum Electrodynamics Coherence and Hormesis: Foundations of Quantum Biology. IJMS 24(18): 14003.
Marchettini N, Del Giudice E, Voeikov V, Tiezzi E (2010). Water: A medium where dissipative structures are produced by coherent dynamics. J Theor Biol 265: 511–516.
Matija L, Kortuga D (2002). Golden mean as a driving force of self-assembly. Proc 10th Foresight Conf Molecular Nanotechnology. Bethesda, USA, pp. 1-2.
Pagnotta S, Bruni F (2007). The glassy state of water: A ‘stop and go’ device for biological processes. In Pollack GH, Cameron IL, Wheatley DN (Eds), Water and Cell. Springer, Heidelberg, 93–112.
Peng CK, Buldyrev SV, Havelin S, Simons M, Stanley HE, Goldberger AL (1994). Mosaic organization of DNA nucleotides . Phys Rev E 49 (2): 1685–1689.
Perakis F, Amann-Winkel K, Lehmkühler F, Sprung M, Mariedahl D, Sellberg JA, Pathak H, Späh A, Cavalca F, Schlesinger D, Ricci A, Jain A, Massani B, Aubree F, Benmire CJ, Loerting T, Grübel G, Pettersson LGM, Nilsson A (2017). Diffusive dynamics during the high-to-low density transition in amorphous ice. PNAS 114 (31): 8193–8198.
Preparata G (1995). QED Coherence in Matter. World Scientific, pp. 195-216.
Prigogine I, Nicolis G (1977). Self-organization in non-equilibrium systems, from dissipative structures to order through fluctuations. Wiley, New York, pp. 90-160.
Renati P, Kovacs Z, De Ninno A, Tsenkova R. Temperature dependence analysis of the NIR spectra of liquid water confirm the existence of two phases, one of which is in a coherent state. J Mol Liq 292, 111449, 2019.
Schauberger, V (2006). Das Wesen des Wassers. AT-Verlag, Baden.
Shi Rui, Tanaka H (2020). Direct evidence in the scattering function for coexistence of two types of local structures in liquid water. J Am Chem Soc 142: 2868-2875.
Shimokawa S, Yokono T, Mizuno T, Tamura H. Erata T, Araio T (2004). Effect of far-infrared light irradiation on water observed by X-ray diffraction measurements. Jpn J Appl Phys 43: L545-L547.
Soukoulis CM, Wegener M (2011). Past achievements and future challenges in the development of three-dimensional photonic metamaterials. Nature Photon 5: 523–530.
Szent-Gyorgyi A (1960). Introduction to Supramolecular Biology . Academic Press, New York.
Tiller WA (1997). Science and human transformation, Subtle energies, intentionality and consciousness. Pavior Publishing, Walnut Creek, CA, pp. 189-228.
Turning M (1952). The chemical basis of morphogenesis. Trans Royal Soc London, Series B, Biol Sci 237 (3): 7–72.
Vitiello G (2009). Coherent states, fractals and brain waves. New Mathematics and Natural Computing. 5 (1): 245-264.
Vitiello G (2012). Fractals as macroscopic manifestation of squeezed coherent states and brain dynamics. J Phys Conf Series 380: 012021.
Voeikov VL (2001). Reactive Oxygen Species, Water, Photons, and Life. Rivista di Biologia 94: 193-214.
Voeikov VL, Del Giudice E (2009). Water respiration – the basis of the living state. Water J 1: 52–75.
Wernet Ph, Nordlund D, Bergman U, Cavalleri M, odelius M, Ogasawara H, Näslund LÅ, Hirsch TK, Ojamäe L, Glatzel LG, Pettersson LGM, Nilsson A (2004). The structure of the first coordination shell in liquid water. Science 304: 995-998.
Wilkes J (2003). Flowforms: The rhythmic power of water. Floris Books, Edinburgh, pp. 67-122.
Wolf E (2007). Introduction to the theory of coherence and polarization of light. Cambridge University Press, Cambridge, pp. 174-194.
Wurtz, GA, Pollard R, Hendren W (2011). Designed ultrafast optical nonlinearity in plasmonic nanorod metamaterial enhanced by nonlocality. Nature Nanotechnol 6: 107–111.
Yokono T, Shimokawa S, Yokono M, Hattori H (2009). Infrared spectroscopic study of structural change of liquid water induced by sunlight irradiation. Water J 1: 29-34.
Zachmann HG, Wutz C (1993). Studies of the mechanism of crystallization by means of WAXs and SAXS employing synchrotron radiation . In Dosière M (Ed.) Crystallization of polymers. Kluwer Academic Publishers, The Netherlands, pp. 403–414.
Zhou EH, Trepat X, Park CY, Lenormand G, Oliver MN, Mijailovich SM, Hardin C, Weitz DA, Butler JP, Fredberg JJ (2009). Universal behavior of the osmotically compressed cell and its analogy to the colloidal glass transition. Proc Natl Acad Sci USA 106: 10632–10637.
Web References
1. Path curve basics: http://www.nct.goetheanum.org/path.htm [11-14-2021]
2. Foundation for Water (FFW): www.foundationforwater.org [11-14-2021]
3. Chaplin M. Platonic solids, water, and the golden ratio. Platonic solids, water and the golden ratio (lsbu.ac.uk) https://water.lsbu.ac.uk/water/platonic.html [10-12-2021]
4. Biomimicry institute: https://biomimicry.org [12-03-2021]
5. Kappraff: Anatomy of a Bud: http://www.mi.sanu.ac.rs/vismath/kappraff2/index. html [05-08-2022]
6. http://budworkshop.co.uk/ [04-14-2022]
7.Browning WD, Ryan CO, Clancy JO (2014). 14 Patterns of Biophilic Design. New York, Terrapin Bright Green llc. http://www.terrapinbrightgreen.com/report/14-patterns/ [11-18-2022]
8. Sigview spectrum analyser. Software for calculation of FFT based signal analysis. Sigview, 2023. https://siegview.com[10-06-2023]
9. PhysioNet (2009). Software for calculation of DFA; downloaded from www.physionet.org/physiotools/dfa
10. Benoit 1.3. Software downloaded from www.trusoft-international.com/benoit.html (2010) [10-09-2021]
11. https://www.autodesk.com/products/fusion-360 [01-18-2023]
12. Chaplin M. https://water.lsbu.ac.uk/wa ter/water_vibrational_spectrum.html
Discussion with Reviewers
Reviewer 1: Please, explain, how surface plasmons emerge where a regular pattern is present on a surface. How the random composite PET + fragments of silica let plasmon emerges?
Authors: Given the interface of the morphology of the regular structure of porous nanostructured embedded silica-PET agglomerate, and if either structure is nonlinear or the combination of the two constitutes a nonlinear shift, due to formation of surface plasmons, this may contribute to novel plasmonic wave-guiding properties.
Reviewer 1: Why should we be speaking of “non-linearity” and not of simple, but effective and determinant, mode-confinement? Stationary waves that are kept in the liquid by the geometry of the cavity made by the special shape of the carafe? Explain why we can affirm that there is a “fractal route” of photons through the PET-silica lattice?
Authors: The propagation of low intensity simulated light through the PET- silica lattice implicates a fractal nature of the lattice itself with a defined Fractal Dimension, generating stable and repeatable nonlinear oscillations in the visible and LNIR wavelength range, given in our 2019 reference.
Reviewer 1: Regarding TIRI measurements. Have you thought that keeping the water for so long time, previously kept in the PG-shaped container could imply some losses in the benefits/increases of the coherent fraction thanks to the favorable wave-context? Maybe could the thermalization be done by keeping the whole PG-carafe and the ordinary baker in the measurement room and picking up the 5.0 ml water samples time by time just before the measurements? Could this procedure allow to preserve better the electrodynamical super-organization “earned” in the PG carafe?
Authors: During the development of the TIRI method (given reference) the equilibration time of 60 min was found necessary to stabilize the TIRI temperature of the 5 ml volume of water. Certainly, we have done immediate measurements on water samples, which led to the observation that 60 minutes is required to obtain reliable results. Importantly, a control water sample must be considered simultaneously.
Reviewer 1: When we speak of modulation of signals in amplitude or frequency, the carrier is the high frequency signal (e.g. MHz) and the modulation occurs at much lower frequencies (e.g. kHz). Here it would be better to explain the meaning.
Authors: The word “carrier” has been replaced by “transfer” in the meaning of a wave part that contains information. A new reference has been introduced, which supports the clarification.
Reviewer 2: Why not dedicating an annex that will be placed after the references section that could explain projective geometry in more details.
Authors: Since a relevant annex would add approximately 15 pages to the article, which is long as it is, it is suggested to search explanations in the references.
Reviewer 2: Why choosing containers in glass? in ancient times terracotta was the material of choice; maybe add a few lines why this choice was made.
Authors: Quart’s glass constitutes a tetrahedral structure geometrically identical with the tetrahedral low-density water structure. A short note is included in the text. Another aspect is that glass can be blown in mathematically exact forms (essential in this project), whereas terracotta containers are difficult to produce with exact geometry.
Reviewer 2: UV/VIS spectroscopy – the generation of stable and repeatable nonlinear coherent oscillations in the visible and LNIR wavelength range of light spectrum, ties with the branching chain reaction of water, under the appropriate conditions a hydrogen atom may react with an oxygen molecule producing a hydroxyl radical and an oxygen atom. The former reacts with a hydrogen molecule producing a new hydroxyl radical, and the latter oxidizes a hydrogen molecule to water and regenerates a hydrogen atom, which starts a new tum of the cycle.
Authors: We are familiar with the luminol-amplified photon emission, the probe for the reactive oxygen species (ROS), and that the emission reveals, e.g. circadian rhythms. We have seen similar irregular oscillations in previous experiments. However, the luminol-signals are very different from the spontaneous vortical transmittance spectrum of the highly regular coherent oscillations of FOLCW and FOLC. It is also clarified that the frequencies of the carrier wave appear in the visible part of light spectrum and that the highly coherent oscillations of informational waves appear first above around 650 nm and that the two waves interact in an interlocked helical mode. These high-grade energy oscillations might depend on the excited state of the inherent electromagnetic field of CDs and the production of cold electron vortices.
Reviewer 2: Due to the formation of “cold” electron vortices of water CDs, since the electrons are in a coherent state,the excitation of vortical energy present in each CD of water cannot be released, neither thermally nor electromagnetically, which explains the extreme stability of excited expanded water CDs. Could the observed phenomenon not also be associated to solitons?
Authors: According to recent observations (Vitiello G, 2009) the dynamical formation of macroscopic fractals can be extended not only to vortices but solitons, induced by squeezed coherent states, whose fractal geometrical properties thus become manifested.
Reviewer 2: Since nonlocal low-entropy photons can be trapped in water, building a sizable local EMF and giving rise to co-resonance of molecules of the same species; this produces a unified oscillation phase of all the trapped molecules used to charge and displace the equilibrium toward the dominance of water CDs. What are the implications of this result?
Authors: In this process, atoms and photons lose their original identity, being raised to energized matter made up of quasi-particles entangled in the CDs able to carry and store external electromagnetic energy.