
![]()
Microcystis aeruginosa Blooms in an Unlikely Riverine Ecosystem: A Waste Treatment Lagoon Source?
Polera ME1, Erwin PM2, Mallin MA2, Saul BC3, Synan HD4, Cahoon LB1*
1 Department of Biology and Marine Biology, UNC Wilmington, Wilmington, NC 28403 USA; mpolera2@ncsu.edu;
2 Center for Marine Science, UNC Wilmington, Wilmington, NC 28409 USA ErwinP@uncw.edu; mallinm@uncw.edu
3 NoviSci, Inc, Durham, NC 27701USA; bradleysaul@gmail.com
4 Department of Earth and Ocean Sciences, UNC Wilmington, Wilmington, NC 28403 USA; synantist@outlook.com
*Corresponding author: Cahoon@uncw.edu
ORCID ID: https://orcid.org/0000-0002-1918-452X
Keywords: Microcystis aeruginosa, Cape Fear River, waste lagoon, microcystin
Submitted: June 14, 2023
Reviewed: October 23, 2023
Accepted: October 30, 2023
Published: March 10, 2024
Abstract
The Cape Fear River is the largest and most industrialized riverine system in the state of North Carolina, USA. Long-term monitoring programs had never detected visible cyanobacterial blooms in this often-turbid river until 2009, when massive surface blooms of toxin-producing Microcystis aeruginosa occurred each summer through 2012. This river is the drinking water source for thousands of southeastern North Carolina residents, with the blooms centered near the major water intakes. The unprecedented blooms led to drinking water contamination by microcystins, potent hepatotoxins, and forced costly improvements to water treatment plants. We used multiple approaches to test hypotheses about sources and drivers of these unusual M. aeruginosa blooms. Analyses of flow, turbidity, temperature, nutrient, and phytoplankton biomass data did not reveal a plausible reservoir or lake source upstream of the impacted reaches nor any significant temporal changes in the river’s propensity to support such blooms, nor were changes in the river’s characteristics identified to explain bloom cessation after 2012. We used satellite imagery, targeted sampling, and molecular analyses to identify a likely source of Microcystis inoculum as a large, highly eutrophic waste lagoon with a discharge just above the bloom-impacted reach of the river. Subsequent improvements in that waste treatment facility led to a 50% decrease in nutrients and significant increases in nitrogen (N) and phosphorus (P) ratios in the outfall, and subsequent cessation of the Microcystis blooms. The results suggest the possibility that similar situations may occur elsewhere, in which eutrophic waste treatment lagoons incubate and export harmful cyanobacterial blooms to seed adjacent river ecosystems.
Introduction
The Cape Fear River is the largest and most industrialized river in the state of North Carolina (NC), USA, and has been monitored monthly for decades by several coalition monitoring programs. Visible cyanobacterial blooms had not been recorded from this often-turbid, 6th-order river. However, during the summers of 2009 through 2012 the lower reaches of this river (Fig. 1) experienced unprecedented blooms of the toxicogenic cyanobacterium Microcystis aeruginosa, producing toxins that affected the region ecologically and economically (Isaacs et al., 2014). The lower Cape Fear River is the source of drinking water for hundreds of thousands of residents in southeastern North Carolina, with water intakes at Lock and Dam #1 (Fig. 1, site 1). Detection of microcystins in drinking water and taste and odor problems prompted installation of monitoring and treatment systems shortly after the 2009 bloom was detected. The North Carolina Division of Public Health reported 73 ppb (μg/L) of microcystin in a 2009 bloom sample from Lock and Dam #1 (Dr. Mina Shehee, NC Division of Public Health, memo September 25, 2011), resulting in a first-ever advisory to keep children and dogs from swimming in these waters. Additional algal bloom material from the Cape Fear River collected in September 2009 was analyzed by Dr. Paul Zimba at Texas A&M University Corpus Christi, who reported water microcystin RR (one form of the toxin molecule) concentration at 391 µg/L. The World Health Organization has a guideline of < 1.0 μg/L of microcystin-LR (another form of the toxin molecule) for drinking water and US EPA recommends a 10-day intake of <1.6 μg/L (https://www.epa.gov/cyanohabs/epa-drinking-water-health-advisories-cyanotoxins)
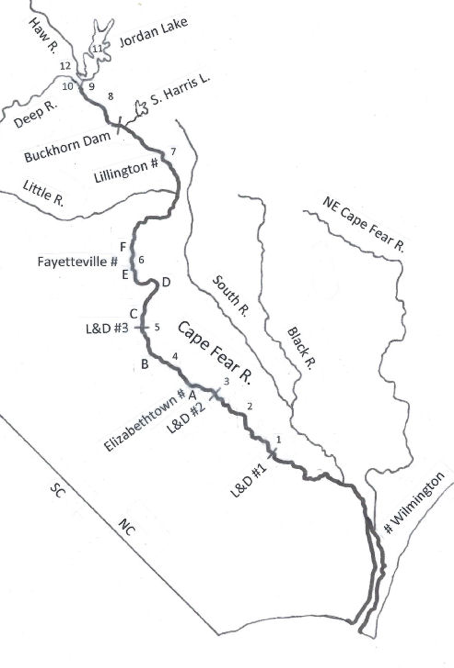
M. aeruginosa blooms in the Cape Fear River were anomalous given the historical primary producer assemblages. Riverine blooms of M. aeruginosa have been reported from numerous other regions but are always associated with a proximal lacustrine source and/or relatively slow-flowing conditions (Chaffin, 2009; Davis et al., 2009; O’Neil et al., 2012; Paerl and Paul, 2012; Pick, 2016; Svircev 2019). The Cape Fear River blooms were most noticeable as surface accumulations upstream and just downstream of the lower two of a set of three locks and dams (Lock and Dam #1 and #2, Fig. 1, sites 1 and 3), reflecting the tendency of M. aeruginosa populations to float under calm conditions, but were not clearly proximal to an incubator body of water. A eutrophic reservoir, B. Everett Jordan Lake, lies upstream of the Cape Fear River, which is formed by the juncture of the Haw and Deep Rivers immediately below the reservoir, and which yields approximately half the flow volume of the lower Cape Fear River. That reservoir is known to export occasional blooms of the cyanobacterium, Aphanizomenon sp., to the upper Cape Fear River (NC DWQ, 2011), but that organism did not bloom in the lower Cape Fear River, nor has M. aeruginosa been known to bloom in the water immediately below the reservoir (Touchette et al., 2007; Wiltsie et al., 2018). Cessation of the M. aeruginosa blooms after 2012 was also unexpected and anomalous, as waters supporting such blooms have typically done so continuously, absent effective mitigation measures. Consequently, the source(s) and driver(s) of the M. aeruginosa blooms in the lower Cape Fear River remained undetermined after they ceased.
M. aeruginosa blooms in other locations have raised similar questions about sources and drivers. For example, well-publicized M. aeruginosa blooms in the Maumee River and Lake Erie in 2014 that resulted in water supply disruptions have yielded differing opinions about causation. Some studies have claimed export of riverine blooms while others have indicated that riverine nutrient loadings drove in-lake blooms distinct from riverine blooms (Kutovaya et al. , 2012; Conroy et al., 2014; Matson et al., 2020). Genetics-based analyses have also demonstrated downstream transport of M. aeruginosa blooms from eutrophic Lake St. Clair through the Detroit River into Lake Erie (Davis et al., 2014). Thus, sources and drivers of toxicogenic M. aeruginosa blooms may not be easily determined.
The investigation we report here aimed to test ex post facto hypotheses about possible causative factors supporting the anomalous blooms of 2009-2012. The prevalent paradigm explaining M. aeruginosa blooms holds that blooms are favored by elevated temperatures, calm conditions that favor aggregation of floating colonies, excessive nutrient loading, low grazing pressure, and a seed population sufficient to initiate massive population formation (Chaffin, 2009; Davis et al., 2009; O’Neil et al., 2012; Paerl and Paul, 2012 [but see Reinl et al., 2023]). Unlike many other cyanobacteria, M. aeruginosa does not fix dinitrogen (N2), and so requires external nitrogen sources. M. aeruginosa requires high availabilities of inorganic nitrogen (N) and phosphorus (P) to support blooms, but also favors low N:P ratios (Smith, 1990; Paerl, 1988; 1990; Fujimoto et al., 1997; Kotak and Zurawell, 2007; Giblin and Gerrish, 2020; Cai and Tang, 2021). Planktonic blooms can be initiated after a benthic resting phase of cells that respond to triggering conditions, allowing repeated outbreaks in host waters (Brunberg and Blomquist, 2002). Assuming these conditions correspond at least partially to the sources and drivers of the M. aeruginosa blooms in the lower Cape Fear River, we considered the attributes of the Cape Fear River watershed, examined relevant data sets produced by various monitoring efforts during the bloom period, and conducted additional ex post facto sampling to rule out as many hypotheses as possible, with the aim of identifying most plausible explanations.
Methods
Study Area
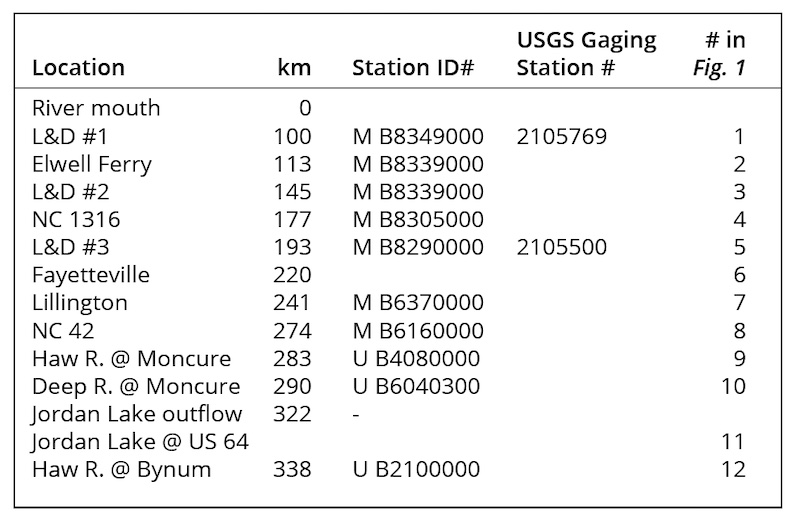
The Cape Fear River watershed encompasses 13,610 km2 and a human population of ~2.3 million (NC DEQ, 2009). The Cape Fear River proper is formed by the juncture of the Haw and Deep Rivers, each originating in the North Carolina Piedmont, just below B. Everett Jordan Lake, a 5,640 ha multi-use impoundment created in 1981 and lying 322 km upstream of the river’s mouth (Table 1a; Fig. 1). Another major impoundment, 1,680 ha Shearon Harris Lake, serves as a cooling water reservoir for a nuclear power station and drains into the Cape Fear River just below Buckhorn Dam, but its discharge is limited and discontinuous. Four major in-river dam structures lie between the head of the Cape Fear River and its mouth: Buckhorn Dam and the navigable Locks and Dams (L&D) #3, #2, and #1 (proceeding seaward; Table 1a; Fig. 1). Each dam creates a slowly moving, deeper pool behind it, providing the river with an alternating flowing/slowing character until it becomes tidally influenced below L&D #1.
Monitoring Data Sources
The U.S. Army Corps of Engineers (US ACOE) regulates and gages discharge from Jordan Lake (Web ref. 1), and the U.S. Geological Survey (USGS) maintains flow gages at several locations along the river, including L&D #3 and #1 in the relevant reach (Table 1a). Monthly and daily average flow data were obtained from respective web sites. Flow data were examined to identify periods of low or high flows that might support or inhibit, respectively, the formation of M. aeruginosa blooms in the “relevant reach” of the river, here defined as the confluence of the Haw and Deep Rivers downstream to Lock & Dam #1, where the drinking water intakes for Brunswick and New Hanover counties’ water utilities were located. Flow data were also used to calculate loads of relevant nutrients and to estimate travel times of water masses in the river.
Three coordinated coalition monitoring programs measure physical, chemical (nutrients), and biological (including chlorophyll a) water quality parameters monthly or bi-weekly in the Cape Fear River and report state-certified data. The Upper Cape Fear River Basin Association (UCFRBA; Web ref. 2) samples the waters upstream of the confluence of the Haw and Deep Rivers. The Middle Cape Fear River Basin Association (MCFRBA; Web ref. 3) samples the Cape Fear River upstream from L&D #1 to the confluence of the Haw and Deep Rivers. The Lower Cape Fear River Program (LCFRP; Web ref. 4) samples the river from L&D #1 to its mouth. These programs were complemented by sampling efforts conducted directly by the N.C. Division of Water Quality (now N.C. Division of Water Resources); results of all these monitoring efforts are available through EPA’s STORET system (Web ref. 5). Data obtained from these sources included (in µg L-1) dissolved inorganic nitrogen (DIN = NH4+ + NO3– -NO2–), total Kjeldahl nitrogen (TKN), total nitrogen (TN), total phosphorus (TP) and chlorophyll (chl) a, as well as temperature (ºC) and turbidity (NTU).
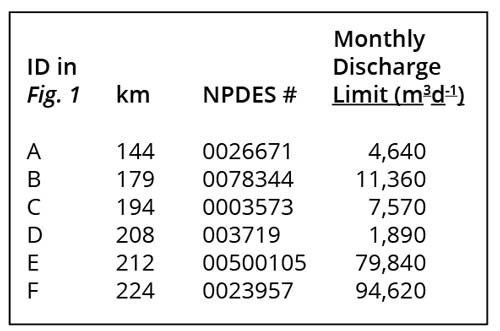
Several industrial (sites B, C, and D in Fig. 1) and municipal wastewater (sites A, E and F in Fig. 1) point sources discharged directly into the Cape Fear River above the reach where M. aeruginosa blooms were observed. Discharge Monitoring Reports (DMRs) for those facilities were obtained from the N.C. Dept. of Environmental Quality (NC DEQ, Fayetteville Regional Office). These reports were examined to determine permitted maxima and loading rates (volume x concentration) of nitrogen (N) and phosphorus (P) and to compare those inputs to concentrations and loads in the receiving waters of the Cape Fear River.
Field Sampling
Additional targeted sampling efforts were conducted to complement routine monitoring efforts, particularly after the cessation of M. aeruginosa blooms post-2012, when additional questions about the paradigm(s) explaining these blooms arose. Water samples were collected every two weeks from May-September of 2015 at 12 locations (numbered in Fig. 1) between Jordan Lake and L&D #1 to examine primary producer biomass (as chlorophyll a, “chl a”) and Microcystis presence and genotype distributions. Five trips to four sites were also completed in 2016 to support additional biomass and genotype investigations. Surface water was collected in sterilized carboys following standard procedures. Water was collected from boat ramps or docks when possible. When necessary, a bucket was lowered over a bridge railing. Temperature, conductivity, and salinity were measured using a YSI Professional Plus Multi-parameter meter. Water was transported and immediately filtered for chl a analysis and DNA extraction. Duplicate 100 mL samples for chl a and duplicate 250 mL samples for molecular analysis were filtered onto 47 mm glass fiber filters (nominal pore size: 1 µm, GF/F, Pall) and frozen (-20°C) until further processing. Duplicate chl a filters were placed in 10 mL acetone overnight for fluorometric analysis with a Turner Trilogy fluorometer using a chlorophyll non-acidification module following Welschmeyer (1994). A small number of water samples were procured with assistance from NC DEQ from the waste lagoon of a permitted discharger for analyses of primary producer biomass and Microcystis presence and genotype distributions.
Remote sensing imagery for several locations in the relevant reach of the lower Cape Fear River watershed was analyzed to complement in situ sampling and monitoring data for phytoplankton biomass and composition. Multispectral analysis of satellite imagery (Planet Team, 2017, Web ref. 6; 3 m2 resolution) for 11 dates between June 13, 2016 and Oct. 28, 2019 were employed in ArcGIS Pro to produce pigment-specific classifications for estimating chlorophyll a (OC3C, Web ref. 7; O’Reilly et al., 1998, 2000) and phycocyanin (PC8; Sun et al., 2015), a pigment marker specific for freshwater cyanobacteria, including M. aeruginosa.
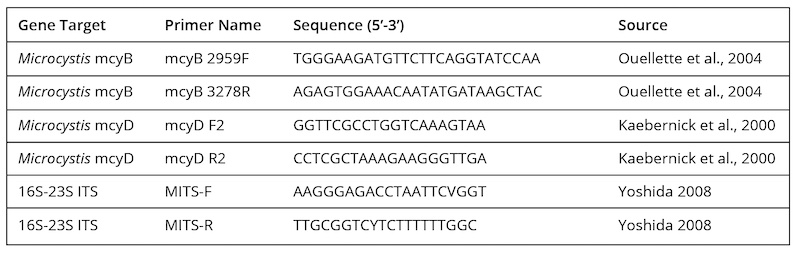
Microcystis DNA Extraction, Cloning and Sequencing
Samples taken from the 2012 bloom at L&D #1 and by subsequent sampling efforts in 2013-2016 at additional locations were processed by filtration and freezing. Whole genomic DNA extractions were prepared from environmental filtrates and pure cultures of microcystin-producing (MC+) M. aeruginosa strain LB 2385 (positive control obtained from the UNCW/MARBIONC Algal Resources Collection) using the Bioline MyTaq Extract PCR Kit following the manufacturer’s instructions. A sterilized hole punch was used to cut a standardized sample (area = 28.3 mm2) from each glass fiber filter. DNA extracts were used as templates for PCR amplifications. To determine the presence of M. aeruginosa, a primer set amplifying the 16S-23S rRNA internal transcribed spacer (ITS) region was used (Table 2). To establish cyanobacterial toxicity, primer sets designed to amplify microcystin (MC) synthetase genes, mcyB and mcyD, were used to detect MC+ Microcystis (Table 2, Nonneman and Zimba, 2002; Kaebernick et al., 2000; Ouellette et al., 2006; US EPA, 2006). Amplifications were carried out in 25 µL volumes in an Eppendorf Mastercycler. Reactions contained 1 µL of DNA extract, 1 µL of each primer (10 µM), 12.5 µL 2X MyTaq HS Red Mix, and 9.5 µL PCR water. The following cycling parameters were used: initial denaturation at 95°C for 3 minutes followed by 35 cycles of denaturation at 95°C for 15 seconds, annealing at 50°C for 15 seconds and extension at 72°C for 20 seconds. Aliquots of PCR reaction products were electrophoresed in 1% agarose gels and captured digitally on a Biospectrum AC Imaging System. ITS gene sequences were amplified from DNA extracts using the M. aeruginosa-specific MITS-F and MITS-R primers (Yoshida et al., 2008) to construct clone libraries. PCR amplifications and thermocycler conditions were the same as described above. PCR products were gel extracted and purified using the GeneJET Gel Extraction and DNA Cleanup Micro Kit (ThermoScientific). Purified PCR products were ligated into plasmids and transformed into One Shot® Chemically Competent E. coli cells using the TOPO® TA Cloning Kit for Sequencing (Invitrogen). Positive clones were prepared for DNA sequencing using Big Dye ® 172 Terminator v. 3.1 (Applied Biosystems) with forward (T3) and reverse (T7) vector primers. PCR products were purified by isopropanol precipitation and sequenced on an ABI 3130xl Genetic Analyzer (Applied Biosystems). Sequence reads were processed in Geneious (version 8.02) by aligning forward and reverse reads to create full-length ITS consensus sequences.
Next generation sequencing (NGS) was then used for an in-depth comparison of Microcystis assemblages in the river basin. Barcoded amplicon sequencing was completed on DNA extracts from samples taken during the 2012 bloom at L&D #1 and additional samples taken in 2015 and 2016. Microcystis ITS primers (MITS-F and MITS-R) with barcodes on the forward primer and the HotStarTaq Plus Master Mix Kit (Qiagen, USA) were used in a 28-cycle PCR with the following parameters: initial denaturation at 94°C for 3 minutes, followed by 28 cycles of 94°C for 30 seconds, annealing at 53°C for 40 seconds and extension 72°C for 1 minute with a final elongation step at 72°C for 5 minutes. Aliquots of PCR reaction products were electrophoresed in 2% agarose gel to determine successful amplification. Calibrated Ampure XP beads were used to purify multiple pooled samples based on molecular weight and DNA concentrations, then sequenced on the Illumina MiSeq platform. Library preparation, sequencing and data processing were performed at MR DNA (www.mrdnalab.com, Shallowater, TX, USA). High-quality sequences were binned into OTUs based on 97% sequence identity. Data are available through the NCBI Sequence Read Archive via BioProject PRJNA940829. OTU assemblages were analyzed in R version 3.3.0 using the edgeR package and visualized in a multidimensional scaling (MDS) plot (Robinson et al., 2010).
Statistical analysis
Data that were not normally distributed were log-transformed prior to analysis. One-way ANOVA and Tukey’s HSD post hoc tests were used to explore differences among data groups including point source discharge volumes among days of the week during M. aeruginosa bloom seasons, differences in turbidity between bloom and non-bloom conditions, and differences in chlorophyll a concentration among sampling locations and between bloom and non-bloom periods. Regression analyses were used to test relationships between river flow at various sites along the river as well as the outfall from Jordan Lake Dam, and linear regressions were employed to explore the impact of river flow on river nutrient concentrations and turbidity on chlorophyll a concentration. All statistical analyses, except for those employed for molecular analyses, were performed using JMP Pro v. 13 (SAS Institute).
Results and Discussion
M. aeruginosa bloom characteristics
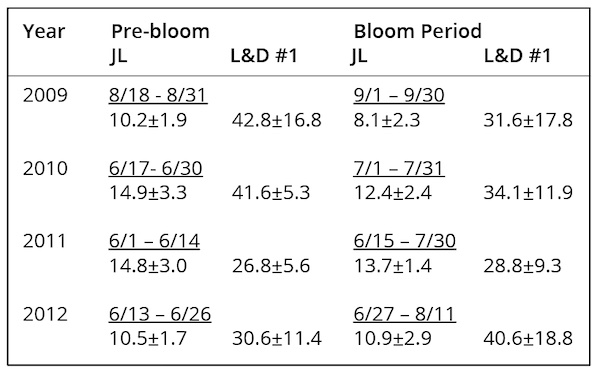
Information derived from all the observation sources allowed definition of “bloom” periods as follows: September 1-30, 2009; July 1-31, 2010; June 15-July 30, 2011; June 27-August 11, 2012. Actual water sampling for identification of M. aeruginosa blooms during these times was episodic, so that confirmation of presence understates their likely true duration. Monitoring for cyanobacterial blooms using a phycocyanin fluorescence monitor at the drinking water intakes at Lock & Dam #1 commenced in 2010, however, and was used to alert Brunswick County water managers to potential bloom occurrences. Consequently, cessation of M. aeruginosa blooms after 2012 was a confirmed observation. Primary producer blooms in the summer of 2010 were investigated by NC DWQ (2011) throughout the river. These and other observations showed that visible surface blooms of M. aeruginosa were confined to the river reach below L&D #3, with the most prominent blooms at L&D #1 and remnant M. aeruginosa populations detected as far downstream as Wilmington (Fig. 1). One report of M. aeruginosa in water samples from just above L&D #3 was not considered to represent an actual bloom event, as there was no visible surface presence of colonies.
Could M. aeruginosa blooms have been seeded from Jordan Lake?
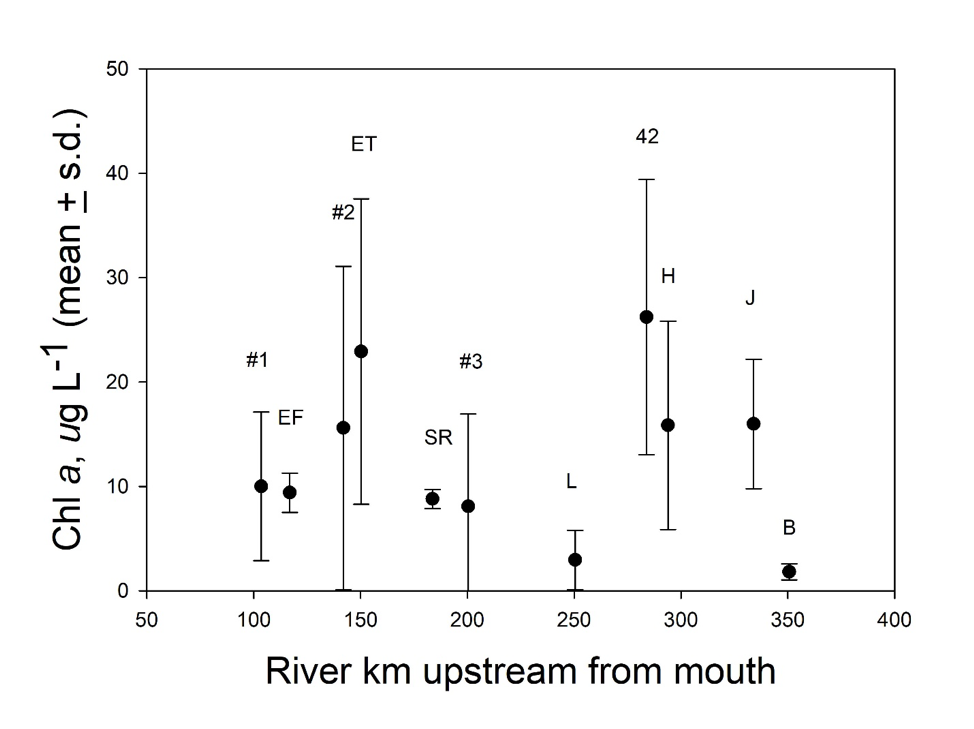
Additional directed sampling of the river system was conducted in 2015 as part of this study to analyze spatial patterns of phytoplankton biomass in the summer. The highest chl a values were measured in slow-flowing stretches of the river system, including Jordan Lake, the Haw River downstream of Jordan Lake, the Cape Fear River at NC 42, and just above the Locks and Dams (Fig. 2), reflecting the generally eutrophic conditions of Jordan Lake and the low flow, stratified conditions at those locations. Consistently low chl a values at Lillington (Fig. 2) likely arose from the negative effects of turbulent mixing in extensive rapids on phytoplankton growth and biomass. The disjuncture at Lillington indicated that higher primary producer biomass upstream and downstream of that fall-line area reflected distinct responses to limiting factors in those two reaches of the river. Thus, in combination with observations of M. aeruginosa blooms only in the lower reach of the river, a source of the observed blooms upstream of L&D #3 appeared very unlikely.
Jordan Lake is eutrophic and frequently supports blooms, some of which have been recorded downstream in the Cape Fear River, and M. aeruginosa is known to occur in Jordan Lake, although not as notable surface blooms (Touchette et al., 2007; Wiltsie et al., 2018). Several lines of evidence effectively ruled out this hypothesized source, however, as an explanation for M. aeruginosa blooms in the lower Cape Fear River. First, M. aeruginosa blooms have never been reported in the river upstream of Lock & Dam #3, even though blooms of the cyanobacterium, Aphanizomenon spp., have been reported as exported from Jordan Lake and diatom blooms have been reported at and below Fayetteville and its two large municipal wastewater treatment plant (WWTP) discharges (Fig. 1). Second, the low flow conditions favorable to blooms of M. aeruginosa occur upstream of Buckhorn Dam and Lock & Dam #3, and higher primary producer biomass levels do occur in those locations, but not reported M. aeruginosa blooms. Third, low flow conditions also correspond with longer travel times in the river, but visible blooms of M. aeruginosa only occurred relatively infrequently below Lock & Dam #3. Finally, cessation of M. aeruginosa blooms in the Cape Fear River after 2012 did not support an ongoing source from a eutrophic reservoir that yields a substantial portion of total flow in the river.
Does M. aeruginosa occur throughout the Cape Fear River basin?
PCR-based screening of water samples for the presence of Microcystis spp. was validated by sequencing representative ITS amplicons and supported accurate genetic identification of Microcystis spp. at Cape Fear River watershed locations. Complete consensus sequences were aligned for the 2012 bloom (n=2) and 2015 samples from L&D #1 (n=3), Jordan Lake (n=3), Deep River (n=1) and the CFR at NC 42 (n=1). BLAST queries returned high percentage similarity matches to Microcystis spp. for all recovered ITS sequences (Table 3). These methods were sensitive enough to detect Microcystis in non-bloom conditions. This sensitivity was additionally important because visible surface blooms of Microcystis have not been reported within Jordan Lake or elsewhere in the Cape Fear River above L&D #3.
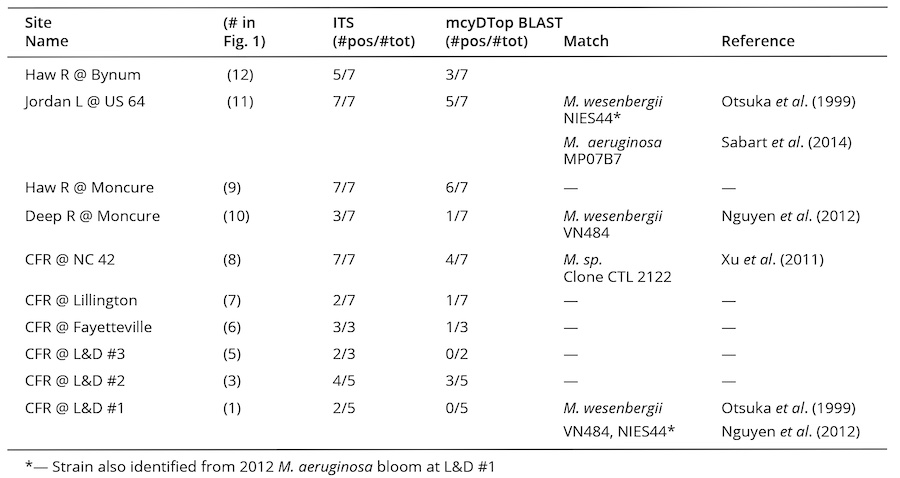
Microcystis spp. presence was detected throughout the CFR basin in the summers of 2015 and 2016 (Table 3). Jordan Lake, the Haw River at Moncure and the Cape Fear River at NC 42 had positive ITS results for 100% of visits indicating persistent presence of Microcystis spp. despite absence of visible blooms. The Haw River at Bynum, upstream of Jordan Lake, and the Deep River at Moncure also had positive ITS hits at 71% and 43% of site visits, respectively. Lillington had positive results only for the first two visits to the site (29%). L&D #3 and L&D #2 both had high incidence of Microcystis spp. (100% and 80%, respectively). Samples from the lower Cape Fear River at NC 1316 (site #4 in. Fig. 1) and Elwell Ferry (site #3 in Fig. 1) each had a frequency of 66% ITS positive samples. L&D #1 had an incidence of 29% in 2015 and 2016 samples (non-bloom years). Gene regions coding for microcystin synthetases (mcyB and mcyD), indicative of the presence of potentially toxic M. aeruginosa, were detected in all samples collected and analyzed in May, July, and August of 2012 (bloom year) at L&D #1 and Elwell Ferry and again in 2013 (non-bloom year) at L&D #2 and #3 and at NC 1316. Thus, M. aeruginosa occurred throughout the watershed, but was observed to bloom only below Lock & Dam #3, suggesting that particular conditions must have occurred to support these blooms.
Did low flow conditions support bloom formation?
Low flow permits stratification, particularly at times of higher temperatures, conditions that would support M. aeruginosa blooms. We used the stratification parameter, S=h/µ3 (h = height of the water column (m), µ = velocity (m s-1)), which identifies the boundary velocity at which a water column converts from laminar to turbulent flow (Simpson and Hunter, 1974) to predict conditions allowing stratification in the slow-flowing portions of the Cape Fear River just above the locks and dams. The depths of the pools above L&D #1 and #3 average 5 m. At this depth, velocities < ~2.0 m s-1 would predict a stratified water column (values of S>0.65, the boundary condition parameter value). Velocity as a function of discharge at L&D #1 and #3 was analyzed using flow and channel dimension data provided by the United States Geological Survey (USGS) from 1992-2013. The average velocity at both L&D #1 and #3 was 0.35 m s-1 ± 0.29 (s.d.); velocities at both locations routinely fell under 0.3 m s-1 during the summer months, when low flows are common. Evaluation of temperature profiles from MCFRBA monitoring data for the water column just upstream of L&D #1 demonstrated that surface (0.1 m) temperatures during bloom periods were always higher than near-bottom temperatures, by an average of 0.9°C (±0.6), confirming stratification. Targeted heat budget models further predicted “persistent” stratification behind LD #1 (Hall, 2021). Thus, during low flow summers, the river slows, warms, and stratifies in pools above dams and allows surface-blooming phytoplankton an advantage, especially in turbid waters. Similar findings were reported by Hall (2021).
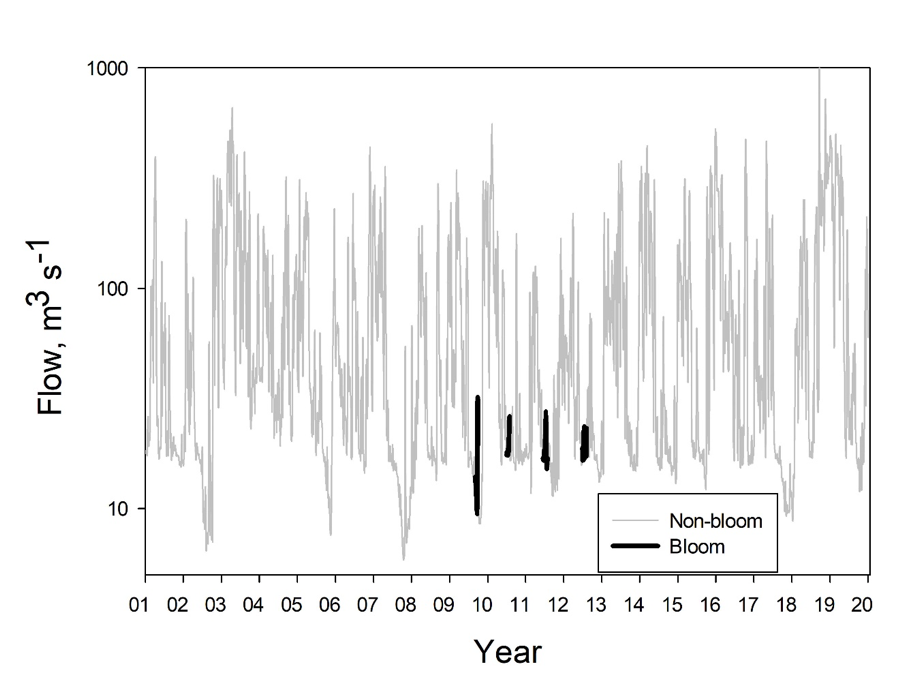
Visible blooms of M. aeruginosa coincided with periods of low flow in the Cape Fear River. Flows during the periods in which visible M. aeruginosa blooms occurred were typically low (<50 m3s-1; Fig. 3). There were times, however, during the warmer months of years 1998-2019 when flows were as low as or lower than bloom periods, but no blooms were observed, notably including severe drought periods in 2002 and 2007. Although the summer of 2013 was a mostly high-flow period and no blooms were observed, subsequent summers included periods of low flow similar to those in which blooms had been observed in 2009-2012, but no blooms were observed in the following years. Average flow volumes at L&D #1 during bloom periods varied from 21.2 to 29.9% of long-term (July 1998 – March 2019) average flow of the Cape Fear River, reinforcing the importance of low flow conditions for bloom formation. These average bloom period flow values, however, occurred frequently – as much as 25% or more of the days in the long-term data set (Fig. 3), implying that actual bloom-day frequencies were much lower than the frequencies of low flow days. Moreover, the occurrence of blooms at times of low flow does not support a hypothesis of incubation and export of M. aeruginosa from adjoining wetlands or other natural “small waters.” The hypothesis that unusually high river flows in 2013 might have flushed out a seed population of M. aeruginosa resident upstream, thereby preventing blooms in that and subsequent summers, is not supported by the observation that similarly high flows in 2010 failed to prevent blooms in 2010 and the following two years. Thus, low flow appeared necessary but insufficient by itself to support the observed M. aeruginosa blooms in the Cape Fear River.
Did high temperatures favor bloom formation?
M. aeruginosa blooms, as for many cyanobacterial blooms, are associated with elevated temperatures; in a warming climate such blooms are expected to become more frequent, but not all high temperature periods in the Cape Fear River yielded M. aeruginosa blooms. The temperature regime in the Cape Fear River during the period 1998-2017 was strongly seasonal, with summer temperatures averaging 27.2°C (s.d. = 2.4) at L&D #3 (MCFRBA; Web ref. 3). Temperatures during bloom periods generally coincided with peak summer temperatures, although the first bloom in September 2009, occurred when river temperatures were just below 25°C. Regarding climate change influence on water temperature, visual inspection of temperature data plotted vs. time revealed no significant trend of increasing temperatures in the Cape Fear River during the period 1998-2017 either on an annual basis or when summer period values were compared. Moreover, there was no inter-annual trend in summer temperatures that could account for bloom occurrences or cessation thereof. The lack of any observed blooms during the summers of 2013-2017, when peak summer temperatures were at least as high as in the bloom summers of 2009-2012, indicated that higher temperatures in summertime may have favored the observed M. aeruginosa blooms in the river, but did not support or instigate them before or after that 4-year period.
Would unusual nutrient loading patterns have driven bloom formation?
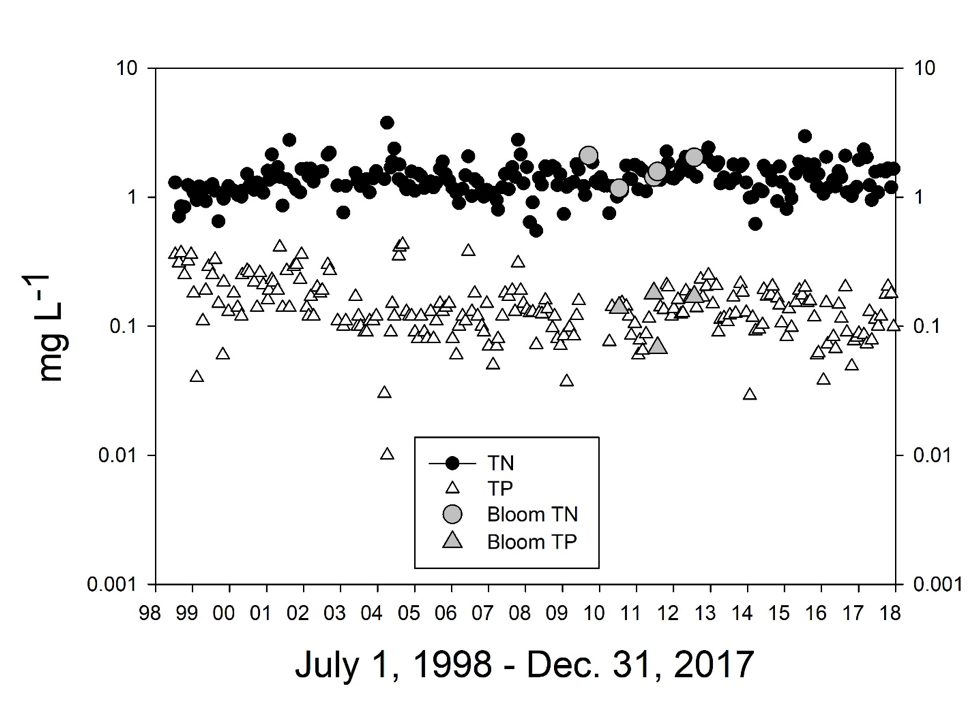
Elevated nutrient levels are often associated with M. aeruginosa blooms, but high nutrient levels in the Cape Fear River did not consistently support blooms. Nutrient concentrations from MCFRBA (Web ref. 3) monitoring in the Cape Fear River (Fig. 4) entering the relevant reach below L&D #3, i.e., where blooms occurred, measured as dissolved inorganic nitrogen (DIN = NH4+ + NO3– -NO2–), total Kjeldahl nitrogen (TKN), total nitrogen (TN) and total phosphorus (TP) during the period July 1998–December 2017 exhibited several patterns. Concentrations of the nitrogen forms all increased slightly in the late 1990s and leveled off after about 2000-2001. Average concentrations over the period were: 0.04 mg (=2.85 µM) NH4+-N L-1 (s.d. = 0.03), 0.75 mg (=53.5 µM) DIN-N L-1 (s.d. = 0.25), 0.68 mg (=48.6 µM) TKN-N L-1 (s.d. = 0.35), and 1.42 mg (=101 µM) TN L-1 (s.d. = 0.42). Concentrations of TP actually declined somewhat between 1998 and 2004, then remained essentially constant through 2017, averaging 0.15 mg (=4.84 µM) TP L-1 (s.d. = 0.08). The TN:TP ratios in the river averaged 9.46 (w/w), a molar ratio of 21:1, indicating P-limitation in river water vs. the Redfield ratio of 16:1, assuming equal lability of TN and TP. Nutrient concentrations in the river at L&D #3 on “bloom days” were not noticeably different from those on “non-bloom days” (Fig. 4), although these nutrient levels were sufficient to support significant primary producer growth if light were not limiting. There were no unique periods of elevated nutrient concentrations in the relevant reach of the river to which the observed M. aeruginosa blooms could be attributed.
Could variation in river turbidity have promoted bloom formation?
The main stem Cape Fear River is considered relatively turbid in comparison to other coastal NC rivers, and so phytoplankton production there was thought to be light-limited and not nutrient-limited (Mallin et al. 1999; Dubbs and Whalen, 2008), perhaps favoring floating blooms such as M. aeruginosa. Analysis of log-transformed turbidity data at L&D #1 (MCFRBA; Web ref. 3) yielded average turbidity of 10.9 NTU (s.d. = 1.9) during the period July 1998 – December 2017. Turbidity values at L&D #1 spiked to much higher values during high flow events, reflecting both storm water inputs and suspension of muddy sediments from the riverbed. Turbidity values during bloom events were not significantly different from turbidity values for non-bloom sample days in summer months (log-transformed data, 1-way ANOVA, F=0.81, df=1,231, p=0.37), indicating that the surface-concentrated M. aeruginosa blooms were not associated with clearer water conditions that might be expected during low flow conditions.
How did M. aeruginosa blooms compare to variations in phytoplankton biomass through time and space?
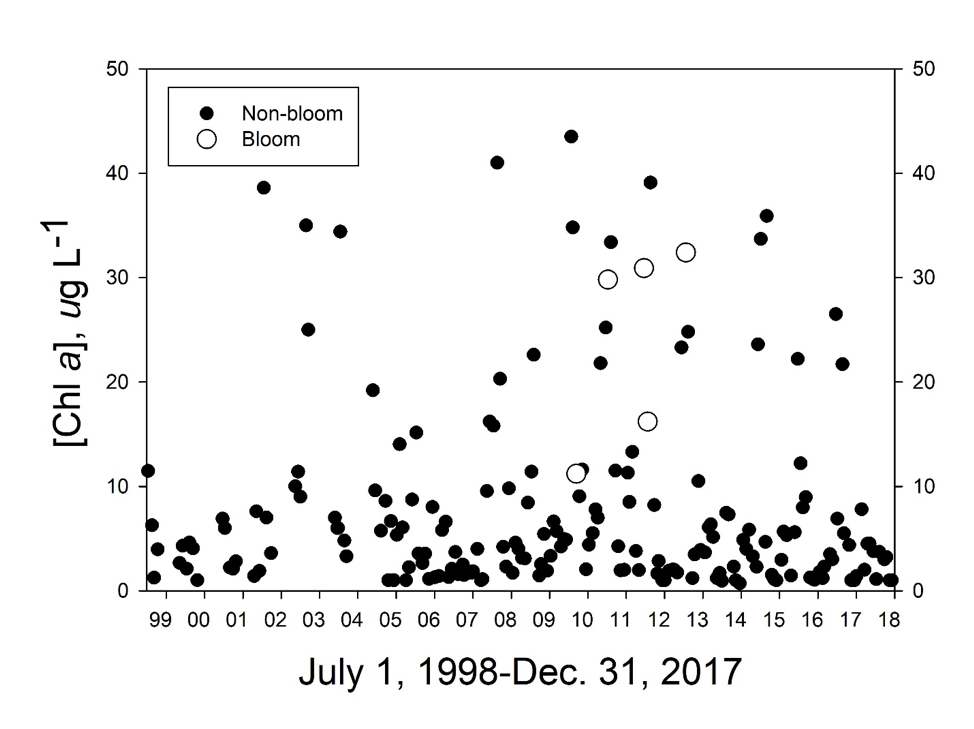
Comparisons of log-transformed [chl a] data from L&D #1 between summer samples with and without observed or inferred M. aeruginosa blooms confirmed that phytoplankton biomass was significantly higher during bloom events than non-bloom times (1-way ANOVA: F=5.02, df=1, 77, p=0.0279), although none of the samples taken during bloom event periods yielded [chl a] higher than 40 µg L-1 (Fig. 5). These monitoring program samples were collected at 0.1 m depth, so floating populations of M. aeruginosa may have been under-sampled by this protocol. Nevertheless, values of chl a above the highest bloom event value (32.4 µg L-1 in 2012) were observed at other times without any observed M. aeruginosa blooms. Therefore, conditions in the river at and above L&D #1 sometimes supported relatively high chl a without also supporting M. aeruginosa blooms.
Comparisons of summer (June – September 2003-2017) chl a values vs. turbidity values measured simultaneously at L&D #1 revealed no significant effect of turbidity on [chl a] (linear regression, F= 2.08, df = 1,77, p=0.15, n.s.), indicating that water clarity was not important in controlling biomass at that location, particularly in comparison to the effects of flow and temperature. Water clarity would have had little effect in restraining floating populations of M. aeruginosa, but high turbidity could limit suspended cells and favor cells and colonies with flotation capability (Chaffin, 2009).
Long-term (2007-2017; MCFRBA, Web ref. 3) primary producer biomass data (as chl a) at NC 42 (site #8 in Fig. 1), L&D #3, a station at NC 1316 (site # 4 in Fig. 1), L&D #2, and L&D #1 (Fig. 1) were analyzed to determine if river conditions normally supported higher biomass in the slow-flowing conditions upstream of Buckhorn Dam and the three locks and dams, and thus could reflect conditions suitable for M. aeruginosa blooms as well. Biomass on summer (June – September) sampling days at NC 42, L&D #3, and L&D #1 strongly responded to low-flow periods, with chl a values above 20 µg L-1 occurring only once at NC 42 during high-flow conditions (Fig.5). Although chl a values above 40 µg L-1 (the NC legal standard for ”algae” blooms) occurred at all 3 locations, no M. aeruginosa blooms were reported from either NC 42 or L&D #3, upstream of the relevant reach.
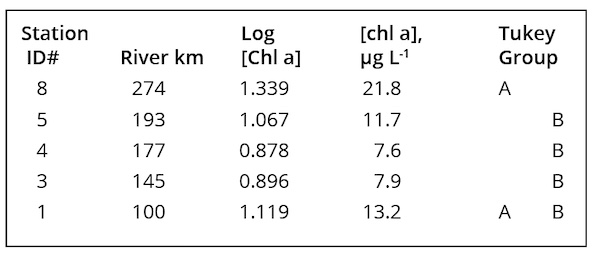
Primary producer biomass trended higher at temperatures above 20°C at all five sampled locations. Comparisons of log-transformed chl a data among the 5 stations for the summer months (June-September), 2007-2014, by 1-way ANOVA and Tukey’s post hoc test demonstrated that the highest mean values occurred at NC 42 and the lowest at SR 1316, the latter being far more rapidly flowing in character than the other locations (Table 4). A possible inference from these observations was that turbulent flow and depth in the turbid, generally light-limited Cape Fear River limits net primary producer growth except when the calmer conditions upstream of dams allowed stratification during the warmer months.
Could there have been an external anthropogenic source?
Lack of an apparent meteorological or hydrological cause for the 2009-2012 M. aeruginosa blooms in an otherwise reasonably typical 4-year period argued for a more unusual, perhaps anthropogenic driver for these episodic blooms. Commencement of M. aeruginosa blooms in waters not previously manifesting them is not unusual, but cessation of such blooms altogether once begun is highly unusual. What changed?
We considered several point source discharges as a potential source of elevated nutrient loading that might have driven blooms downstream and that conceivably might have been adjusted to disfavor further blooms. We examined Discharge Monitoring Reports (DMRs; available by request only, to avoid disclosing dischargers’ identities) for WWTPs at Fayetteville (2 facilities, sites E and F in Fig. 1) and Elizabethtown (1 facility, site A in Fig. 1) that were within reasonable proximity to the relevant reach of the Cape Fear River. These documents, provided by the Fayetteville Regional Office of the NC Division of Water Quality (now Division of Water Resources), revealed no significant changes over time that could account for episodic bloom events in the river, however. Thus, we ruled out municipal sewage discharges as drivers.
We also examined DMRs for other major industrial point source dischargers upstream of the relevant reach. Two of these discharged negligible amounts of nutrients and could not plausibly drive blooms in the river (sites C and D in Fig. 1). A third industrial discharger, termed here the “facility,” that produced highly organic wastes, however, discharged very large loads of nitrogen and phosphorus immediately upstream of the relevant reach (Site B in Fig. 1; 34.7428°N/78.8093°W) and attracted further attention in our investigation.
The facility in question included a very large animal and human waste lagoon (9.4 ha and 3.6 m deep; volume ~340,000 m3) as part of its waste treatment system that discharged directly into the river, was noticeably green in Google Earth© imagery, and is located just upstream of the reach of the river exhibiting M. aeruginosa blooms. These observations prompted a more focused examination of the potential for this waste lagoon to support and export M. aeruginosa blooms into the lower Cape Fear River. Our investigation encompassed additional sampling and data analyses to determine if this hypothesized waste lagoon source of M. aeruginosa blooms could be ruled out, as with other hypotheses considered above.
The green appearance of the large waste lagoon in satellite imagery suggested that it might support cyanobacteria, including M. aeruginosa, during the summer, as cyanobacteria often thrive in high temperatures (25-30°C). A comparison of same-day temperatures in the river and in the discharge from the facility for the months of June-September during the period, July 1998 – September 2017, demonstrated that discharges from this facility were almost always warmer than river temperatures by an average of 5.0°C (s.d. = 2.34). Several water samples were obtained from the waste lagoon and its discharge to the river, with assistance from the NC Division of Water Resources. Lagoon samples collected on September 16, 2015, averaged 36.0 µg chl a L-1 and on September 29, 2015, averaged 11.1 µg L-1. Discharge samples collected during 2015 averaged 30 µg chl a L-1 (s.d. = 12.5, n=8). Lagoon chl a and phycocyanin content derived from analyses of remote sensing imagery averaged 9.85 µg L-1 and 3.97 µg L-1, respectively (Table 5). Similar imagery analysis of the adjacent Cape Fear River yielded estimates of chl a and phycocyanin of 7.14 µg L-1 and 5.01 µg L-1, respectively (Table 5). Neither chl a nor phycocyanin values were significantly different between lagoon and river samples by t-test (p>0.05 for each comparison). Chl a values in the river estimated by analysis of remote sensing imagery were well within the ranges of values obtained from in situ sampling (Figs. 2, 5).
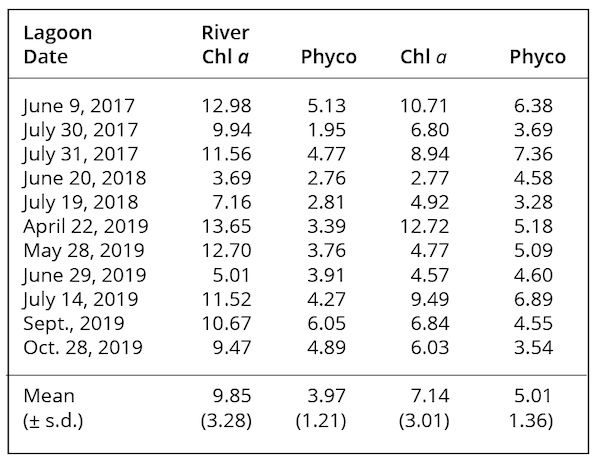
cyanobacteria biomass in both lagoon and receiving river. Chl a and Phyco were not significantly correlated in either body of water, indicating independence of their biomass levels over time.
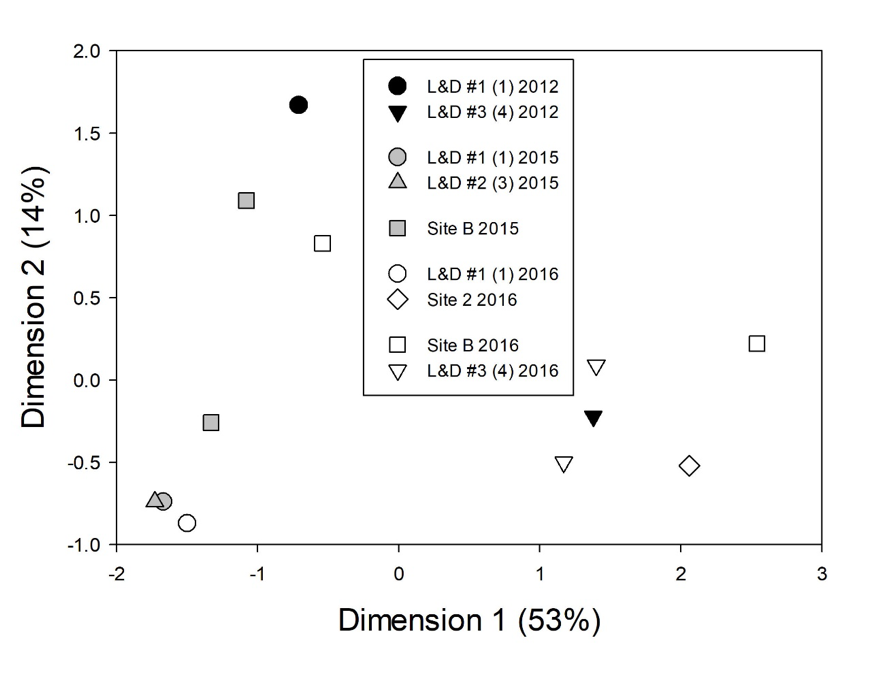
Molecular analyses also demonstrated the presence of Microcystis in the waste lagoon and discharge from the facility in 2015 (90%) and 2016 (80%). Next generation sequencing (NGS) produced 1,823,310 paired reads that binned into 137 operational taxonomic units (OTUs) at 97% sequence identity. All OTUs were taxonomically affiliated to the genus Microcystis. Similarities in site-specific OTU presence were first compared independently of year collected (Fig. 6). Fifty OTUs were present at five sites (2012 bloom at L&D #1, L&D #1 and Elwell Ferry, L&D #2, the waste lagoon, and L&D #3). Four OTUs were unique to the bloom of 2012 and were not found in subsequent years. Notably, eighteen of 137 OTUs identified were determined to be unique to the waste lagoon’s discharge and downstream sites but were not found upstream at L&D #3. Multidimensional scaling of ITS sequences illustrated similarities among overall assemblages from waste lagoon samples and samples taken downstream (Fig. 6). At times, the assemblage of Microcystis OTUs at L&D #1 more closely resembled the assemblage from the waste lagoon than the upstream assemblages.
The molecular findings did not allow us to rule out the waste lagoon as an incubator for M. aeruginosa blooms in the Cape Fear River, but the question remained: could the relatively low volume of this point source discharge from the waste lagoon and associated treatment facility support downstream blooms of M. aeruginosa in the much larger volume of the Cape Fear River? M. aeruginosa’s presence in the waste lagoon was not particularly unusual, given the wide distribution of that cyanobacterium in the watershed, so support of an in-river bloom would also require significant nutrient supply and time for a bloom to develop, as well as the other general conditions associated with M. aeruginosa blooms.
The nutrient concentrations and loadings to the river in the discharges from the waste lagoon and associated treatment facility were substantial in comparison to those in the river immediately upstream, providing the nutrients necessary to promote microalgal growth. Nutrient concentrations in the discharges during the period July 7, 1998 – March 31, 2019, exhibited several noteworthy patterns, particularly in comparison to the patterns observed in the river immediately upstream of the discharge. The facility’s DMRs reported TN, TP, ammonia N, and “organic N” at varying frequencies, initially weekly and then monthly for TN in the first 7 years of the period of record. TN data were not reported for the period January 2005 – September 2006 but resumed at regular frequency until July 2007, when much more frequent sampling began, tapering to weekly sampling as of about September 2008, that continued through the remaining period of record. During the period 2008-2013 TN concentrations in the facility’s discharge declined steadily, apparently reflecting a decrease in the facility’s permitted [TN] discharge from a monthly average of 200 mg TN L-1 (=14,300 µM N) to 100 mg (=7,150 µM N) TN in 2009, and the installation of an additional denitrification system in the facility’s WWTP in 2009. Average summer (June – September) TN concentrations in the discharge were 150 mg L-1 (=10,700 µM N) in 2008 and 119 mg L-1 (=8,500 µM N) in 2013. TN concentrations continued to decline through the remaining period of record, to 97.5 mg L-1 (=7,000 µM N) in summer, 2018. The TN concentrations in the facility’s discharge were thus approximately 2 orders of magnitude higher than TN concentrations in the Cape Fear River just upstream of that discharge at L&D #3 (Fig. 4).
TP concentrations in the facility’s discharge were measured at approximately monthly frequency throughout the period of record, exhibiting an increase until 2003-2004, remaining relatively constant through 2014 and then dropping considerably after that. Average TP concentrations during the “bloom summers” (June – September 2009-2012) were 46.6, 39.2, 34.6, and 38.0 mg P L-1, respectively by year, equivalent to 1500, 1260, 1120, and 1230 µM P, respectively. These values were also approximately 260 times higher than the average TP values in the Cape Fear River immediately upstream of the facility’s discharge at L&D #3. The overall TN:TP ratio in the facility’s discharge during the bloom years of 2009-2012 was 110.6/40.1 = 2.76 (w/w) or 6.11 (mol mol-1), indicating strong N-limitation vs. the Redfield ratio of 16:1 (mol mol-1) and corresponding to the N:P ratios commonly observed in municipal WWTP effluents. Changes in the facility’s TN and TP concentrations in discharges after the bloom period years, however, drove reductions in both parameters as well as changes in the overall TN:TP ratio in the effluent. Average [TN] and [TP] values in the years 2017-2018 were 85.8 and 20.7 mg L-1, respectively, yielding TN:TP ratios of 4.14 (w/w) and 9.17 (mol mol-1). These concentration and ratio changes reflected changes in the WWTP’s operation (more frequent removal of sludge from anaerobic digesters starting in 2014, in addition to the installation of denitrification capacity in 2009).
The magnitude of N and P concentrations in the facility’s discharge compared to concentrations of those nutrient elements in the Cape Fear River at L&D #3 just above the discharge suggested that, despite the very large disparity in flow volumes of the facility’s discharge and the river, the facility was a significant point source of N and P loadings at times of low river flows and high temperatures, i.e., summers. The nutrient discharge from the facility might then overwhelm instream conditions, decoupling downstream from upstream stretches. Regressions of TN and TP against flow volume data for the Cape Fear River at L&D #3 and the facility for all summers, June-September 2007-2014, were all statistically insignificant (p>0.05), so the relationship between flow and nutrient loads was then assumed to be a simple function of average TN and TP concentrations for each summer and daily flows for the river and the point source discharge. This approach allowed daily estimates of TN and TP loads from the facility and more direct comparisons with TN and TP loads in the Cape Fear River. Estimated TN loads in the Cape Fear River at L&D #3 were almost always higher than the estimated TN loads in the facility’s effluent, even at times of low flow in the river. The average contribution of the discharge to TN loads in the river during the summers of 2007–2014 was 25.8%. However, there were altogether 108 days of (976) in the summers when estimated TN loads from the facility exceeded 50% of the estimated TN loads in the river: 70 days in 2007, a summer of very low flow in the river but no blooms; 5 days in 2008, a non-bloom summer, 21 days in 2009 (14 during the bloom month of September), 11 in 2010 (but none in the bloom month of July), and one in 2013, a high flow, non-bloom summer. There were 8 days in all when estimated TN loads from the facility exceeded 100% of the estimated TN loads in the river, 6 of them in 2007, a non-bloom summer, and two in September 2009, a bloom month. Thus, there was no strong, consistent evidence that TN loading from the facility’s discharge was a significant factor in stimulating the 2009-2012 M. aeruginosa blooms, although N-limited primary producers downstream in general might have been stimulated.
The average contribution of the estimated facility TP discharges to estimated TP loads in the river during the summers of 2007-2014 was 82.3%. Estimated TP loads from the facility exceeded 50% of the estimated TP loads in the river on 725 of 976 days in these summers, exceeding 100% of the TP loads in the river on 315 days, i.e., more than doubling the TP load in the river at that location. Estimated TP loads from the facility exceeded 50% of the estimated TP loads in the river on 26 of 30 days in the bloom month of September 2009 (including the highest value, 351% on September 19, 2019, a bloom day), on the first 28 days of the bloom month of July 2010, on 41 of the 46 bloom days of June 15-July 30, 2011, and on 27 of 46 days in the bloom period of June 27 – Aug. 11, 2012. Thus, 122 of 157 bloom days in the summers of 2009-2012 were days when estimated TP loads from the facility were >50% of estimated TP loads in the river. Days with >50% loads from the facility totaled 275 in the summers of 2009-2012, however, so more than half the days with >50% loads occurred when no blooms were observed. These TP loading data suggest some correspondence between extra TP from the facility and M. aeruginosa blooms, but that high TP loadings alone were not sufficient to cause those blooms.
Data from monitoring efforts supported the assessment here that the facility’s discharge had a significant effect on in-river nutrient loads (Web ref. 8). The distributions of TN and TP concentration values for the period 2006-2010 showed a substantial increase in TN and TP values between monitoring stations upstream and downstream of the facility’s discharge point. The 50th percentiles of TN and TP values for that period demonstrated 30% and 50% increases, respectively, between upstream L&D #3 and downstream at NC 1316 (sites 5 and 4, respectively, in Fig. 1 and Table 1a).
Examination of TN and TP data from sampling at L&D #1 revealed that after about 2003 TN:TP ratios stabilized at average values of ~24 (mol/mol) for all sampling dates but with considerable variability (s.d. = 15.6). TN:TP ratios at L&D #1 during summer months (June-September) averaged ~21 (s.d. = 18.5), not significantly different but quite variable. These values generally indicated P limitation vs. the Redfield ratio of 16:1 N:P, suggesting that the facility’s TP contribution upstream could have been important, although the ratio data do not demonstrate an effect of that discharge that far downstream.
Could discharge of M. aeruginosa populations blooming in the facility’s waste lagoon create a significant visible surface bloom 80 km downstream at L&D #1? Assuming low flow conditions (< 50 m3 s-1), corresponding to a downstream velocity of ~0.3 m s-1, travel time from the facility discharge point to L&D #1 would be on the order of 3 days. Under optimal growth conditions (temperatures ~33°C, high light, and high concentrations of nutrients) Nicklisch and Kohl (1983) reported maximum specific growth rate, µmax, for M. aeruginosa at 3.4 d-1. A discharge of 30 µg L-1 chl a in an average discharge volume of 8,520 m3d-1 (=0.098 m3 s-1) mixing with the river flowing at 50 m3 s-1 (Fig. 3) would contribute [chl a] ~0.06 µg L-1 at the discharge, an increase over ambient levels impossible to detect at that point in time and space. Assuming a specific growth rate of half the reported µmax, or 1.7 d-1, for 3 days’ travel time, then ([chl a]day3 = [chl a]day0*e1.7*3), and neglecting “native” primary producers in the river, yields ~10 µg L-1 chl a dispersed through the entire water column, which at L&D #1 approaches 5 m deep but often stratifies. If half the initially discharged population was composed of M. aeruginosa, i.e., a population that had bloomed in the waste lagoon, and 80% of the resulting population floated within 0.1 m of the surface, M. aeruginosa-chl a concentration could exceed 190 µg L-1 in that surface layer – certainly a significant and quite visible bloom event. The assumptions used in this analysis are likely conservative, however; for example, flow volumes in the river during bloom events were often well below 50 m3 s-1 (Table 6), implying less dilution of the discharge, higher resulting M. aeruginosa and nutrient concentrations in the river, longer travel time, and stronger stratification at L&D #2 and #1, all supporting more robust bloom formation. Thus, the possibility that occasional M. aeruginosa blooms in the facility’s waste lagoon were discharged into the Cape Fear River with sufficient nutrients to support continued growth to create visible downstream blooms could not be ruled out.
Conclusions
Observations of M. aeruginosa blooms in other ecosystems indicate that lake-sourced blooms can be exported into outflowing rivers, e.g., Lake Okeechobee and downstream St. Johns and Caloosahatchie Rivers (Phlips et al., 2012; Rosen et al., 2017; Lapointe et al., 2017; Kramer et al., 2018). Similarly, upstream incubation of M. aeruginosa has exported blooms into Lake Erie (Davis et al., 2014). Eutrophic riverine conditions have also exported blooms and/or bloom-supporting nutrients from the Maumee River into Lake Erie (Conroy et al., 2014; Matson et al., 2020). M. aeruginosa blooms in the Cape Fear River, however, do not fit these natural source scenarios.
Cessation of M. aeruginosa blooms in the Cape Fear River after 2012 remains the most enigmatic feature of the phenomenon. M. aeruginosa remained present in the river system after that date, as evidenced by molecular detection. Low flow, high temperature, turbidity, and other conditions conducive to bloom formation remained so post-2012. Discharges from WWTPs upstream remained unchanged as sources of nutrients. Nutrient loads from the animal waste facility’s discharges, however, did change over the period of interest. TP concentrations in the facility’s discharge remained relatively constant between 2004 through 2014 and then dropped considerably. The overall TN:TP ratio in the facility’s discharge during the bloom years of 2009-2012 was 110.6/40.1 (mg L-1) = 2.76 (w/w) or 6.11 (mol mol-1), corresponding to the low N:P ratios commonly observed in municipal WWTP secondary treatment effluents and to the lower N:P ratios thought to favor M. aeruginosa (Smith, 1990; Paerl, 1988; 1990; Fujimoto et al., 1997; Kotak and Zurawell, 2007; Giblin and Gerrish, 2020; Cai and Tang, 2021). Changes in the facility’s TN and TP concentrations in its discharges after the bloom period years, however, drove reductions in both parameters as well as changes in the overall TN:TP ratio in the effluent. Additional denitrification capacity was brought on-line starting in 2009 and more frequent removal of TP-laden sludges from anaerobic digesters commenced in 2014, according to NC DEQ inspectors with knowledge of the facility’s operations. Average [TN] and [TP] values in the facility’s discharge in the years 2017-2018 were 85.8 and 20.7 mg L-1, respectively, yielding TN:TP ratios of 4.14 (w/w) and 9.17 (mol mol-1). Therefore, we could not rule out the possibility that changes in the facility’s waste treatment and discharges reduced the frequency and magnitude of M. aeruginosa blooms in the waste lagoon and reduced the nutrient loads available to support those blooms in the river.
Thus, we pose the question: might organic- and nutrient-enriched waste lagoons support formation and export of toxic cyanobacteria blooms? The waste lagoon we examined in this study served a large slaughterhouse producing animal and human (worker) waste. Several studies highlight the capacity for discharges from other kinds of nutrient-rich waste lagoons to support blooms of photosynthetic organisms (Mallin et al., 2015). Anaerobic swine waste lagoons are known to host blooms of purple photosynthetic bacteria (Do et al., 2003; Cahoon et al., 2012), although these lagoons are not permitted to discharge directly to surface waters. Facultative aerobic waste lagoons do support cyanobacterial blooms (Sund et al., 2001), including populations of M. aeruginosa (Kotut et al., 2010). Discharges from animal waste lagoons have been known to support cyanobacterial blooms in receiving waters (Burkholder et al., 2007). Similarly, human sewage waste can support blooms of cyanobacteria (Ibekwe et al., 2017). Wet detention ponds servicing golf courses, residential developments, retail, and industrial areas can also support noxious and toxic algal blooms (Lewitus et al. 2003); such stormwater systems also discharge into streams and rivers, although intermittently during rain events. We suggest that further consideration should be given to include such potential point sources as bloom origins for M. aeruginosa, in particular, and toxic cyanobacteria blooms in general to receiving water ecosystems.
One difficulty with testing these ideas lies in the frequent lack of easy access to such treatment facilities and their waste lagoons, with the possible exception of publicly owned waste treatment systems. Consequently, bloom attribution may have to rely on in-stream discharge sampling (upstream vs. downstream) and require routine, therefore expensive, monitoring. As we found, molecular methods may help with source tracking, but can also demonstrate the wide occurrence of cyanobacteria species in a watershed without necessarily excluding any source. Moreover, we note that in this study a number of operational taxonomic units (OTUs) were found that were common to the lagoon and downstream river waters but were not found in upriver areas, strongly indicating cyanobacterial discharge from the waste lagoon into the river. Remote sensing has potential value as well, but usually after the fact of a bloom and without the ability to distinguish a bloom of one species from another. Advances in remote sensing algorithms may help, but there are other limits on the use of these techniques, such as air navigation rights vs. trespass. Thus, the real extent of the phenomenon we describe here may be difficult to assess.
It is also important to consider that toxic cyanobacteria blooms arising from incubation in human and animal waste lagoons and export via point-source discharges may be much easier to manage and prevent than blooms arising from less discrete causes. We hypothesize in this case that changes in the animal waste facility’s nutrient management practices may have controlled the conditions favoring or preventing blooms of M. aeruginosa in the lower Cape Fear River. If so, managers and regulators have straightforward treatment options available to control these causes of toxic cyanobacteria blooms.
Acknowledgments
Thanks to: P. Zimba for analysis of Microcystis toxins; E. Wright for samples of Microcystis from the UNCW MARBIONC Algal Resources Collection; K. Burdette, P. Connell, E. Moran and D. Huffman for field sampling assistance; A. Frampton and R. Shilke for assistance with molecular analyses; K. White (NC DEQ) for information about the animal waste facility treatment system; and M. Vander Borgh (NC DEQ) for information about M. aeruginosa bloom timelines. We thank three reviewers for helpful comments on an earlier draft of the manuscript. This research was partially funded by the U.S. Fish and Wildlife Service; thanks to M. Wicker for support.
References
Brunberg AK, Blomquist P (2002). Benthic overwintering of Microcystis colonies under different environmental conditions. J Plankton Res 24: 1247-1252.
Burkholder J, Libra B, Weyer P, Heathcote S, Kolpin D, Thorne PS, Wichman M (2007). Impacts of waste from concentrated animal feeding operations on water quality. Environ Health Perspec 115: 308-316
Cahoon LB, Halkides, CJ, Song B, Williams CM, Dubay GR, Fries AS, Farmer J, Fridrich W, Brookshire C (2012). Swine waste as a source of natural products: a carotenoid antioxidant. Agri Sci 3: 806-815.
Cai Y, Tang C (2021). A kinetics model for predicting Microcystis growth based on the synergistic effect of nitrogen and phosphorus on the growth of Microcystis densa (Cyanobacteria). Pol J Environ Studies 30: 1067–1077.
Chaffin, JD (2009). Physiological ecology of Microcystis blooms in turbid waters of Western Lake Erie. Theses and Dissertations. Paper 1049. The University of Toledo, Toledo.
Christian RR, Bryant WL Jr, Stanley DW (1986). The relationship between river flow and Microcystis aeruginosa blooms in the Neuse River, North Carolina. UNC Water Resources Research Institute Report #86-223.
Conroy, JD, Kane DD, Briland RD, Culver, DA (2014). Systemic, early-season Microcystis blooms in western Lake Erie and its agricultural tributaries (Maumee and Sandusky rivers). J Great Lakes Res 40: 518-523.
Davis TW, Berry DL, Boyer GL, Gobler CJ (2009). The effects of temperature and nutrients on the growth and dynamics of toxic and non-toxic strains of Microcystis during cyanobacteria blooms. Harmful Algae 8: 715-725.
Davis TW, Watson SB, Rozmarynowycz MJ, Ciborowski JJ, McKay RM, Bullerjahn GS (2014). Phylogenies of microcystin-producing cyanobacteria in the lower Laurentian Great Lakes suggest extensive genetic connectivity. PloS One 9(9): e106093.
Do YS, Schmidt TM, Zahn JA, Boyd ES, de la Mora A, DiSpirito AA (2003). Role of Rhodobacter sp. Strain PS9, a purple non-sulfur photosynthetic bacterium isolated from an anaerobic swine waste lagoon, in odor remediation. Appl Env Microbiol 2003: 1710–1720.
Dubbs LL, Whalen SC (2008). Light-nutrient influences on biomass, photosynthetic potential and composition of suspended algal assemblages in the middle Cape Fear River, USA. Int Rev Hydrobiol 93: 711–730.
Fujimoto N, Sudo R, Suigiura N, Inamori Y (1997). Nutrient-limited growth of Microcystis aeruginosa and Phormidium tenue and competition under various N:P supply ratios and temperature. Limnol Oceanogr 42: 250-256.
Giblin SM, Gerrish GA (2020). Environmental factors controlling phytoplankton dynamics in a large floodplain river with emphasis on cyanobacteria. River Res Applic 36: 1137– 1150.
Hall N (2021). Understanding thermal stratification as a key driver of harmful cyanobacteria blooms on the Cape Fear River, NC. UNC Water Resources Research Report # 485. 23 pp.
Harden SL, Cuffney TF, Terziotti S, Kolb KR (2013). Relation of watershed setting and stream nutrient yields at selected sites in central and eastern North Carolina, 1997–2008: U.S. Geological Survey Scientific Investigations Report 2013–5007, 47 p
Hobbie JE (1971). Phytoplankton species and populations in the Pamlico River Estuary of North Carolina. Report No. 56. Water Resources Research Institute, University of North Carolina, Raleigh, North Carolina.
Ibekwe AM, Murinda, SE, Murry, MA, Schwartz G, Lundquist T (2017). Microbial community structures in high rate algae ponds for bioconversion of agricultural wastes from livestock industry for feed production. Sci Total Env 580: 1186-1196.
Isaacs JD, Strangman WK, Barbera AE, Mallin MA, McIver MA, Wright JLC (2014). Microcystins and two new micropeptin cyanopeptides produced by unprecedented Microcystis aeruginosa blooms in North Carolina’s Cape Fear River. Harmful Algae 31: 82-86.
Kaebernick M, Neilan BA, Börner T, Dittmann E (2000). Light and the transcriptional response of the microcystin biosynthesis gene cluster. Appl Environ Microbiol 66: 3387–3392.
Kotak BG, Zurawell RW (2007). Cyanobacterial toxins in Canadian freshwaters: a review. Lake Reser Manage 23: 109-122.
Kotut K, Ballot A, Wiegand C, Krienitz L (2020). Toxic cyanobacteria at Nakuru sewage oxidation ponds – A potential threat to wildlife. Limnologica 40: 47-53.
Kramer BJ, Davis TW, Meyer KA, Rosen BH, Goleski JA, Dick GJ, Genesok O, Gobler CJ (2018). Nitrogen limitation, toxin synthesis potential, and toxicity of cyanobacterial populations in Lake Okeechobee and the St. Lucie River Estuary, Florida, during the 2016 state of emergency event. PLoS ONE, 13: e0196278.
Kuenzler EJ, Stanley DW, Koenings JP (1979). Nutrient kinetics in the Pamlico River, North Carolina. Report No. 139. Water Resources Research Institute, University of North Carolina, Raleigh, North Carolina.
Kuenzler EJ, Stone KL, Albert DB (1982). Phytoplankton uptake and sediment release of nitrogen and phosphorus in the Chowan River, North Carolina. Report No. 186. Water Resources Research Institute, University of North Carolina, Raleigh, North Carolina.
Kutovaya OA, McKay RML, Beall B, Wilhelm SW, Kane DD, Chaffin JD, Bridgeman TB, Bullerjahn GS (2012). Evidence against fluvial seeding of recurrent toxic blooms of Microcystis spp. in Lake Erie’s western basin. Harmful Algae 15: 71-77.
Lapointe BE, Herren LW, Paule AL (2017). Septic system contributions to nutrient pollution and harmful algal blooms in the St. Lucie Estuary, southeast Florida, USA. Harmful Algae 70: 1-22.
Lewitus AJ, Schmidt LB, Mason LJ, Kempton JW, Wilde SB, Wolny JL, Williams BJ, Hayes KC, Hymel SN, Keppler CJ, Ringwood AH (2003). Harmful algal blooms in South Carolina residential and golf course ponds. Pop Environ 24: 387-413.
Mallin MA (1994). Phytoplankton ecology of North Carolina estuaries. Estuaries 17: 561-574.
Mallin MA, Cahoon LB, McIver MR, Parsons DC, Shank GC (1999). Alternation of factors limiting phytoplankton production in the Cape Fear Estuary. Estuaries 22: 985 – 996.
Mallin MA, McIver MR, Robuck AR Dickens AK (2015). Industrial swine and poultry production causes chronic nutrient and fecal microbial stream pollution. Water Air Soil Pollut 226: 407 (2015).
Matson PG, Boyer GL, Bridgeman TB, Bullerjahn GS, Kane DD, McKay RML, McKindles KM, Raymond HA, Snyder BK, Stumpf RP, Davis TW (2020). Biophysical drivers facilitating a toxigenic cyanobacterial bloom in a major Great Lakes tributary. Limnol Oceanogr 65: 2866-2882.
NC DEQ (2009). Cape Fear River Basin Restoration Priorities 2009. North Carolina Ecosystem Enhancement Program, Department of Environmental Quality, Raleigh, North Carolina. 79 pp.
NC DWQ (2011). Algal Assemblage Assessments in the Cape Fear River in 2010. North Carolina Division of Water Quality. Environmental Science Section, Raleigh, North Carolina.
Nguyen VL, Tanabe Y, Matsuura H, Kaya K, Watanabe MM (2012). Morphological, biochemical and phylogenetic assessments of water-bloom-forming tropical morphospecies of Microcystis (Chroococcales, Cyanobacteria). Phycol Res 60: 208-222.
Nicklisch A, Kohl J-G (1983). Growth kinetics of Microcystis aeruginosa (KÜTZ) KÜTZ as a basis for modelling its population dynamics. Int Rev Hydrobiol 68: 317-326.
O’Neil JM, Davis TW, Burford MA, Gobler CJ (2012). The rise of harmful cyanobacteria blooms: The potential roles of eutrophication and climate change. Harmful Algae 14: 313–334.
Nonneman D, Zimba PV (2002). A PCR-based to assess the potential for microcystin occurrence in channel catfish production ponds. J Phycol 38: 230-233.
O’Reilly JE, Maritorena S, Mitchell BG, Siegel DA, Carder KL, Garver SA, Kahru M, McClain CR (1998). Ocean color chlorophyll algorithms for SeaWiFS. J Geophys Res 103: 24937-24953.
O’Reilly JE, Maritorena S, Siegel DA, O’Brien MC, Toole D, Mitchell BG, Kahru M, Chavez FP, Strutton P, Cota GF, Hooker SB, McClain CR, Carder KL, Muller-Karger F, Harding L, Magnuson A, Phinney D, Moore GF, Aiken J, Arrigo KR, Letelier R, Culver M (2000). Ocean color chlorophyll a algorithms for SeaWiFS, OC2 and OC4: Version 4. Chapter 2, in Maritorena S, Harding L, Culver M, eds. “Ocean Color Chlorophyll a Algorithms for SeaWiFS, OC2, and OC4: Version 4.” SeaWiFS Postlaunch Calibration and Validation Analyses, Part 3, 2000.
Otsuka S, Suda S, Li RH, Watanabe M, Oyaizu H, Matsumoto S, Watanabe MM (1999). Phylogenetic relationships between toxic and non-toxic strains of the genus Microcystis based on 16S to 23S internal transcribed spacer sequence. FEMS Microbiol Lett 172: 15–21.
Ouellette AJ, Handy SM, Wilhelm SW (2006). Toxic Microcystis is widespread in Lake Erie: PCR detection of toxin genes and molecular characterization of associated cyanobacterial communities. Microb Ecol 51: 154–165.
Paerl HW (1988). Nuisance phytoplankton blooms in coastal, estuarine and inland waters, Limnol Oceanogr 33: 823-847.
Paerl HW (1990). Physiological ecology and regulation of N2 fixation in natural waters. Adv Microbiol Ecol 11: 305–344.
Paerl HW, Paul VJ (2012). Climate change: Links to global expansion of harmful cyanobacteria. Water Res 46: 1349–1363.
Phlips EJ, Badylak S, Hart J, Haunert D, Lockwood J, O’Donnell K, Sun D, Viveros P, Yilmaz M (2012). Climatic influences of autochthonous and allochthonous phytoplankton blooms in a subtropical estuary, St. Lucie Estuary, Florida, USA. Est Coasts 35: 335-352.
Pick FR (2016). Blooming algae: a Canadian perspective on the rise of toxic cyanobacteria. Can J Fish Aq Sci 73: 1149-1158.
Reinl KL, Harris TD, North RL, Almela P, Berger SA, Bizic M, Burnet SH,Grossart H-P, Ibelings BW, Jakobsson E, Knoll LB, Lafrancois BM, McElarney Y, Morales-Williams AM, Obertegger U, Ogashawara I, Paule-Mercado MC, Peierls BL, Rusak JA, Sarkar S, Sharma S, Trout-Haney JV, Urrutia-Cordero P, Venkiteswaran JJ, Wain DJ, Warner K, Weyhenmeyer K, Yokota K. (2023). Blooms also like it cold. Limnol Oceanog Letters 8: 546–564.
Robinson MD, McCarthy DJ, Smyth GK (2010). edgeR: a Bioconductor package for differential expression analysis of digital gene expression data. Bioinform 26: 139-140.
Rosen BH, Davis TW, Gobler CJ, Kramer BJ, Loftin KA (2017). Cyanobacteria of the 2016 Lake Okeechobee Waterway harmful algal bloom: U.S. Geological Survey Open-File Report 2017–1054, 34 p
Sabart M, Misson B, Jobard M, Gisèle Bronner G, Donnadieu-Bernard F, Duffaud E, Salençon M-J, Ablard C, Latour D (2015). Genetic diversity along the life cycle of the cyanobacterium Microcystis: highlight on the complexity of benthic and planktonic interactions. Environ Microbiol 17: 901-11.
Simpson J, Hunter J (1974). Fronts in the Irish sea. Nature 250: 404-406.
Smith VH (1990). Nitrogen, phosphorus, and nitrogen fixation in lacustrine and estuarine ecosystems. Limnol Oceanogr 35: 1852–1859.
Sun D, Hu C, Qiu Z, Shi K (2015). Estimating phycocyanin pigment concentration in productive inland waters using Landsat measurements: A case study in Lake Dianchi. Optics Express 23: 3055-3074.
Sund JL, Evenson CJ, Strevett KA Nairn RW, Athay D Trawinski E (2001). Nutrient conversions by photosynthetic bacteria in a concentrated animal feeding operation lagoon system J Environ Qual 30: 648–655.
Svirčev Z, Lalić D, Savić GB, Tokodi N, Backović DD, Chen L, Meriluoto J, Codd GA (2019). Global geographical and historical overview of cyanotoxin distribution and cyanobacterial poisonings. Arch Toxicol 93: 2429-2481.
Touchette BW, Burkholder JM, Allen EH, Alexander JL, Kinder CA, Brownie C, James J, Britton CH (2007). Eutrophication and cyanobacterial blooms in run-of-river impoundments in North Carolina, USA. Lake Reserv Manage 23: 179-192.
US EPA (2006). Toxicological reviews of Cyanobacterial Toxins: Microcystins LR, RR, YR and LA; NCEA-C-1765. National Center for Environmental Assessment, USEPA, Cincinnati, OH.
Welschmeyer NA (1994). Fluorometric analysis of chlorophyll a in the presence of chlorophyll b and phaeopigments. Limnol Oceanogr 39: 1985-1992.
Wiltsie D, Schnetzer A, Green J, Vander Borgh M, Fensin E. (2018). Algal blooms and cyanotoxins in Jordan Lake, North Carolina. Toxins (Basel) 10: 92-115.
Witherspoon AM, Balducci C, Boody OC, Overton J (1979). Response of phytoplankton to water quality in the Chowan River System. Water Resources Research Institute Rep. UNC-WRRI-79-129, North Carolina State University, Raleigh, NC. 204 p.
Xu Y, Yang F, Liu Y, Wang Z, Wang J, Wang G, Li R (2011). Genetic diversity of Microcystis populations in a bloom and its relationship to the environmental factors in Qinhuai River, China. Microbiol Res 167: 20-26.
Yoshida M, Yoshida T, Satomi M, Takashima Y, Hosoda N, Hiroishi S (2008). Intra-specific phenotypic and genotypic variation in toxic cyanobacterial Microcystis strains. J Appl Microbiol 105: 407-415.
Web References
1. http://epec.saw.usace.army.mil/jord.htm [accessed 02-02-2023]
2. https://www.ptrc.org/services/regional-planning/water-resources/upper-cape-fear-river-basin-association [accessed 02-03-2023]
3. https://deq.nc.gov/about/divisions/water-resources/water-resources-data/water-sciences-home-page/ecosystems-branch/monitoring-coalition-program#middle-cape-fear-basin-association-(mcfba) [accessed 02-03-2023]
4. https://uncw.edu/cms/aelab/lcfrp/index.html [accessed 02-03-2023]
5. http://www.epa.gov/storet/| STORET| US EPA [accessed 02-03-2023]
6. https://www.planet.com/ [accessed 02-03-2023]
7. https://oceancolor.gsfc.nasa.gov/atbd/chlor_a/ [accessed 02-03-2023]
8. https://www.deq.nc.gov/water-quality/coalition-program/station-summaries-2006-2011/middle-cape-fear-river-basin-association-station-summaries-2006/download [accessed 6-8-2023]