
![]()
Detecting Subtle Field Effect from Coral Calcium via Droplet Evaporation Method
Igor Jerman1
1 BION Institute, Physiological testing department, Stegne 21, 1000 Ljubljana,
Slovenia; EU; igor.jerman@bion.si
*Correspondence: igor.jerman@bion.si
Keywords: droplet evaporation method, coral calcium, subtle field, mesoscopic water, droplet remnant pattern, Marangoni flow
Published: January 24, 2021
Abstract
Besides chemical characteristics, material systems also possess physical characteristics, from generally known up to quantum fields. Such fields denoted as subtle fields may be important in coordinating living processes and may also be imprinted into materials built by organisms, like an exoskeleton. In the present research, we tackled the exploration of the possible remnants of the subtle field of biological origin in coral calcium (CC) using the method of droplet evaporation images analysis. To go deeper into the effects of CC, we decided to examine not only pure CC but also the basic mineral with some additions that should change the influencing subtle field. The results demonstrated that CC could indeed influence the droplet remnant pattern formation even at a distance, i.e., in a field-like manner. Different varieties of CC proved also to have different field impacts on droplet remnant formation; but in general, they all distinctly differ from calcium sand that functions as the control substance.
Introduction
Besides chemical characteristics, material systems also possess physical characteristics. Many of them are trivial, like mass, hardness, temperature, etc. Next, there are the ones that, in general, demand more sophisticated knowledge, like magnetic susceptibility, dielectric constant, electromagnetic absorption coefficient, etc. If we advance in still more obscure realms, we encounter some further characteristics that are acknowledged only by a part of the scientific community. They have no general theoretical explanation, although they may have explanatory models, mostly stemming from the quantum field theory. Certain scientists see these characteristics as nonexistent; consequently, they are prone to proclaim any related research and findings as pseudoscience. Of course, when there are many indications for such characteristics, together with at least some theoretical concepts, and when we know from the history of science that even the recognition of meteorites was condemned as pseudoscience until the beginning of the 19th century [1], there is no rational reason to stop earnest research in this direction. Even more, when we recognize that we know only 4% of matter/energy in the universe and that contemporary physics is deeply occupied by seizing the ever-elusive dark matter, there should be no hindrances to such research, until it respects general scientific methodology.
What are these mostly unrecognized physical characteristics? While there may be many of them, we shall concentrate on the ones that are allegedly related to a static or dynamic order within various materials. It seems that such an order may influence the surrounding of the given material. This influence may be similar to the Aharonov-Bohm effect, where the influence of the magnetic vector potential – not a field, only its potential, therefore no force – is exerted on the phase shift of nearby charged particles [2]. Consequently, in the absence of generally accepted terminology, we speak of subtle filed effects, even if the detected influences (provoked changes) may not belong to a field as defined and understood in contemporary physics.
Except for basic physics, subtle field phenomena are very important in the biological realm since they may offer a sort of signaling important for the health status of the organism. Such signaling is already known from the practice and research in bioelectromagnetics. A general finding here is that rhythmic, regular, pulsing of a stimulating magnetic field may help the influenced organism to regain its homeostatic power (see [3] for more detail). Stimulating influences in the direction of increasing order may be expected also from the subtle field of crystals, which should spread into surrounding area around the crystal. We may expect that organisms forming crystal structures should imprint their multiscale biological order into the crystal matrix. This could imply shells, parts of an inner skeleton, or a mineral exoskeleton like calcium carbonate with corals (Cnidaria, Anthozoa). Corals integrate oxygen and trace elements into their skeletal aragonite (polymorph of calcite) crystalline structures as they grow [4]. Therefore, any repeated pattern of biological processes, including their electric and electromagnetic fields, could be impressed into the structure of coral limestone. From the hypothesis of subtle field effects for such impressed structures, we can expect to alter the properties of surrounding area, and to have positive, biological order enhancing effects on organisms in the vicinity. Of course, before going into the biological realm, it is important to know whether the assumed subtle field stemming from coral calcium objectively changes the surrounding area so that this influence can be detected through appropriate methods.
As already indicated, any method of exploring subtle field effects should not look for rough effects, but the subtle ones, similar to the aforementioned Aharonov-Bohm effect. The latter was predicted in 1959 when physical research methods had already been well developed. Nevertheless, the phenomenon is so subtle that it needed to wait until 1986 to be persuasively validated [2]. It is worth mentioning that to date no one has persuasively validated its electrical version, despite some encouraging experiments [5]. We should, therefore, look for methods based on possible interference between a complex process, which may be easily swayed into different paths, and the assumed subtle field. One such possibility involves the use of water in its mesoscopic, i.e., dynamically ordered, state. According to many researchers and their findings, its oscillation patterns can be changed as a consequence of the subtle field influence that induces or transfers order from a system to water [6–8]. Even if this supramolecular order of water is not universally recognized, it comprises many valuable empirical pieces of research and theoretical considerations comprising so-called water clusters [9–11], coherent domains [12], exclusion zone water [13] and other similar formations.
One of the promising complex phenomena includes the influence of the mesoscopic state of water on the droplet remnants formation at water evaporation. In general, at evaporation, water drop drying should follow physical principles belonging to fluid mechanics that characterize water as a bulk (i.e. macroscopic) material like Marangoni flow, stemming from temperature and concentration gradient differences in the evaporating water drop [14, 15]. In this regard, we do not expect water to be influenced by the subtle field. On the other hand, and subordinated to the above principles, the mesoscopic phase of water should also have its say, which should be disclosed in certain aspects of the droplet remnant patterns. The general assumption proposes that the subtle field effects should interfere with the mesoscopic phase of water, change its oscillatory pattern, which can then be disclosed by dark-field microscopy of droplet remnant when they are subject to differential statistical analysis of various visual features of droplet remnant images.
The method is known as the droplet evaporation method (DEM) and, in general, involves water as the main solvent; it may also imply other liquids. As already indicated, it involves the evaluation of certain features of evaporated water drops monitored by dark-field microscopy. This method has several modalities and applications. For example, it can be used for monitoring diseases via blood drop evaporation [16, 17], for salt-induced protein self-assembly research [18], etc. The method can be highly sensitive to even the most minuscule concentration differences of substances in the applied water, as shown by the finding that one can even differentiate between various wheat cultivars [19] or kinds of vine [20].
In general physical descriptions, the formation of a droplet remnant pattern (DRP) has been described in terms of the so-called self-pinning of colloidal drops theory [21, 22]. In addition to water fluid mechanics this non-linear, complex and dynamic process provides an immensely rich variety of DRPs that are partially defined by the concentration of colloidal particles, their average size, the velocity and distribution of evaporation on the droplet’s surface, as well as the temperature gradients within the droplet that direct convectional and Marangoni flows [23, 25]. Consequently, certain properties of DRPs are strongly influenced by the material composition of the solution to be evaporated (like viscosity, composition, total dissolved solids – TDS) and by certain ambient parameters as for example temperature, moisture, pressure, etc. [24, 26]. Furthermore, even the ambient magnetic [27] and electric [28] fields may influence the DRP.
As already indicated, the properties of DRPs may also be influenced by subtle physical characteristics of a solution, its complex and dynamically ordered mesoscopic state. Thus, DEM has also been used to research the characteristics of ultra-high diluted aqueous solutions, where no trace of original substance is left [29]. It proved capable of demonstrating differences in subtle influences of an ultra-high dilution (around 10-47 M, practically chemically “pure” water) of As203 (hence denoted as UHD As) on common wheat seeds. DRPs originating from the UHD As with immersed wheat seeds demonstrated more complex and symmetrical formations than the control (DRPs from the water with immersed wheat seeds). This is a demonstration that mesoscopic water order, already introduced, researched and described by various authors [30–32] may influence the evaporation and remnants deposition pattern, which can then be revealed via the DEM method.
Taking all previous findings and assumptions into account, we propose that the subtle field structures of coral calcium may be transferred to mesoscopic water structures after the dropping of coral calcium sand into the (donor) water (see Figure 1). The adopted subtle field of mesoscopic donor water phase would impact its neighborhood and could, therefore, influence another portion of nearby water (detector water). The latter can then be monitored via DEM to see if its structures differ significantly from structures of the unexposed water.
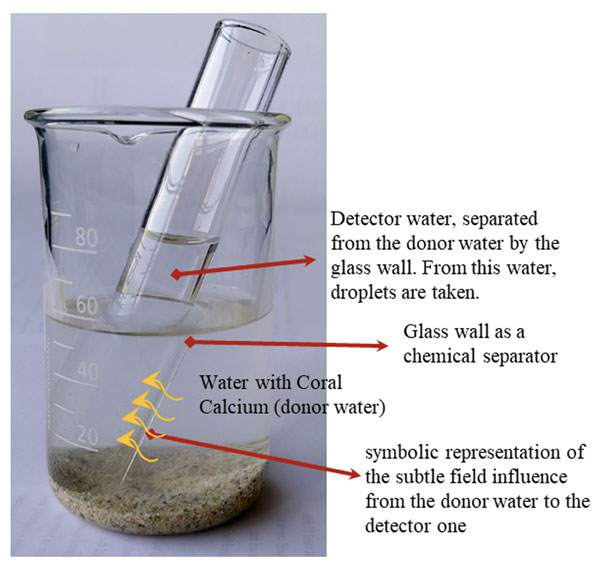
Figure 1. The scheme of donor water influencing the detector water that would later be subject to DEM procedure and analysis. Orange arrows indicate the influencing impact from the coral calcium subtle field adopted water on detector water.
Why not research the water directly exposed to coral calcium, i.e. water with coral calcium sand in it? It is because the DEM method is extremely sensitive to chemical composition. In the case of direct water exposure, there is a much higher probability that we would detect chemical changes than the subtle field ones. Nevertheless, such direct exposure could still function as a reference to see the difference between chemical and subtle field influences. In our research, therefore, we decided that besides subtle field exposure (no direct contact) we would use also the direct (chemical) one.
To go deeper into the effects of coral calcium, we decided to examine not only the pure coral calcium but also the basic mineral with some additions that should change the influencing subtle field. One simple factor that could change the properties of coral calcium subtle field would be its redox potential. We assumed that the electrons that would dominate in a negative redox solution would enhance the effects of the subtle field. Furthermore, we assumed that the addition of colloidal silver as metal would work in the direction of further augmentation. These considerations lead us to the use of two additional substances based on coral calcium, namely the coral calcium with a strong reducing supplement (vitamin C) and the one with additional colloidal silver.
The succession of our working hypotheses concerning this research are as follows:
1. There exists a subtle field that may be connected to the electromagnetic field; nevertheless, it should not be misidentified with the latter. It has some ordering influence on the space in the neighborhood.
2. The subtle field may be ordered by structures created by organisms, like coral calcium.
3. These ordered structures may be translated into mesoscopic water structures, whereby the new water solution adopts the coral calcium subtle field.
4. The influence of this field in the neighborhood of the solution could be detected by appropriate methods like DEM by performing a differential detection between the influenced water (exposed nearby the coral calcium solution) and the uninfluenced one.
5. The field produced by coral calcium or its influence would be further enhanced by the negative redox potential and by the presence of metal in a non-ionized form (colloidal silver).
Therefore, as a consequence of the working hypotheses and other assumptions, the research should entail two different liquids based on water: a) the one imbued with coral calcium (pure or with additives), acquiring the coral calcium subtle field (already named as donor water) and b) the detecting liquid that should be placed close to the first solution (detector water). The latter should not be distilled since then no remnants would remain after evaporation and the dark-field microscopy would reveal nothing. Therefore, the detecting liquid should contain some minerals, and we could use a chemically synthetized solution or some natural water. According to our many years of DEM research, we decided to use tap water and spring one, since both perform quite distinct formations [33].
To achieve as high a sensitivity to the subtle field influence as possible, for the detecting solution we decided to find a mixture between the two used liquids at which the droplet remnant structure of one (spring water) would break and the structure of the remnants of another (tap water) would preponderate. Namely, if we used only one or other liquid, its natural tendency to form distinctive patterns could prevail over the subtle field influence. When the influencing factors of both liquids are approximately in balance, the sensitivity of the combined liquid is much higher. In this research, this balanced point was determined in our previous research visually by comparing patterns of systematic consecutive changing of ratios between the two liquids.
6. Taking into account this DEM research strategy and based on our previous (unpublished) research, we expected that the subtle field of coral calcium would influence the detecting liquid in the way of the preponderance of the pattern of the water (spring in this case) in which coral calcium sand was poured; this represents our sixth working hypothesis.
To have more complete information about the working of the coral calcium subtle field, we had to tackle the time factor. The questions to be asked, then, are how long the subtle field influence endures in the solution and does it show similar variability as an ordinary liquid.
7. We assume that, owing to the subtle field influence resulting in a more stable mesoscopic water phase, it would show higher stability (the seventh hypothesis).
8. In the same line of consideration, we also assumed that there would be a higher correlation in time (synchronicity of successive variations) among coral calcium varieties than between these on one side and sand on the other (the eighth hypothesis).
9. As regards the results of solutions (direct contact) of various calcium carbonate compounds, we assumed that due to mixed effects of chemistry and the subtle field, they would be more blurred than the indirect ones, where only the subtle field would be the influencing factor (the ninth hypothesis).
Materials and Methods
For the evaluation of the influence of coral calcium on water, commercially available products Coral-Mine (CM; composition: powdered coral 995 mg, L-Ascorbic acid 5 mg), Coral-Mine Silver (CMS; composition: powdered coral 994 mg, L-Ascorbic acid 5 mg, Silver 1 mg) and Coral Powder (CP; composition: powdered coral 1000 mg) (Coral Club International, Canada) were used. The last one is the main ingredient of both CM and CMS products. Additionally, sand (Calcium carbonate) of similar particle size was used as a control.
As a detection system, two types of water were used, local tap water (Tap) and bottled spring water (SW). Depending on the test setting and after due calibrations, mixtures of various proportions were prepared. Composition of water: Spring water (Spring Living water from the Tunjice Natural Health Resort; Na – 1.7 mg/L, K – 0.46 mg/L, Mg – 1.6 mg/L, Ca – 40.2 mg/L, I – 0.05 mg/L, HCO3 – 119 mg/L, SiO2 – 9.2 mg/L, dry residue 180 °C – 137 mg/L, pH – 7.6; Analysis: The Institute of Public Health Kranj, 2005); Tap water (Ljubljana, Na – 4.3 mg/L, K – 0.9 mg/L, Mg – 16 mg/L, Ca – 67 mg/L, HCO3 – 258 mg/L; pH – 7.5, conductivity (20°C) – 395 µS/cm, water hardness – 13.1°N; Analysis: National Laboratory of Health, Environment and Food, 2019).
Methods
Experimental Procedure
Two sets of experiments were performed: (1) subtle field exposure (non-contact research) and (2) chemical exposure (contact research) for the reference.
1. In the non-contact experiment, 1 gram of material (CP, CM, CMS or Sand) was placed in beakers containing 50 ml of spring water. In each beaker, a test tube with “detector water,” a mixture of tap and spring water that was found as optimally equilibrated in the calibration testing (55% and 45%, respectively) was installed. Droplets were prepared from detector water immediately after test tubes installation (T0), after 1 hour (T1), 1.5 hours (T2), 2 hours (T3), 4 hours (T4), and 7 hours (T5).
2. In the contact experiment, 1 gram of each material was placed in 1.5L of tap water at room temperature for five minutes. Freshly prepared enriched tap water was then mixed with spring water so that the test samples were prepared by combining 40% of enriched tap water with 60% of spring water (V/V). Droplets from samples were dripped one by one on clean microscopic slides immediately after the mixture was prepared (T0), after 30 minutes (T1), 60 minutes (T2), 3 hours (T3), 6 hours (T4), 24 hours (T5) and 48 hours (T6).
Droplet Evaporation Method (DEM)
The droplet evaporation method consists of creating drops of different solutions on clean microscope slides and drying them under defined conditions. Dry residues are then observed under the dark-field microscope (see an example in Figure 2). Properly dried drops with no additional artifacts are photographed and analyzed by visual assessment and software [33]. The anomalously dried drops (evidently non-circular form, ripped up or interrupted edges) or drops with fibers or dust-like particles (occasionally stemming from the previous cleaning of slides) incorporated in dry residues are eliminated from further analysis.
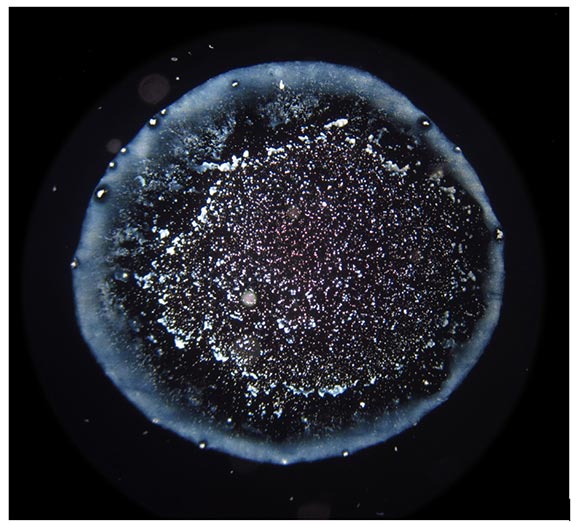
Figure 2. An example of a dark field microscopic image of droplet remnants.
From each sample, 10-14 water drops with volume 2.6 μL were placed on clean microscope slides with an automatic pipette and dried under laboratory conditions (temperature 24–26°C, moisture 44–48%). Individual droplet residues were observed using dark-field microscope (Euromex ME 2665, Euromex, Arnhem, The Netherlands) at 40× magnification, and properly dried droplets with no additional artifacts, such as fibers or dust-like particles, were photographed. Droplet remnant patterns (DRPs) were analyzed by two different programs for texture analysis, developed specifically for our DEM analyses: EntropyTest and WaterLook.
Pattern Evaluation
Frequency Distribution Analysis
The algorithm of the EntropyTest program divides the diameter of droplet remnants into 200 equal intervals and performs a frequency analysis of all distances between all illumined pixels (representing dry residues within the droplet remnant perimeter). The frequency distribution analysis roughly captures some structural features of a DRP. Many different features of the frequency analysis can be used to seek some characteristics or a hidden order behind the DRPs. In this study, we analyzed the statistical parameter called skewness of the graphs representing the frequency distribution of each DRP since this parameter proved as a good and sufficiently robust indicator in our previous investigations (see [33] where a very close parameter was used). Increasing skewness refers to influences where the deposition of droplet remnants tends to concentrate at the center (centripetal drive) of the droplet while decreasing works in just the opposite way (radial or centrifugal drive). Examples of positive and negative skewness are presented in Figures 3a and 3b.
Analysis of Consecutive Structure Reduction (Blur)
The Analysis of consecutive structure reduction (part of the WaterLook program) identifies the number of structures of DRPs after consecutive blurring of the image, which gives another insight into the complexity of the mineral remnants texture. In the beginning, the program identifies the number of structures (attached illuminated pixels), then it performs the first blurring, i.e., extending the illuminated points one level outwards. Afterward, it counts the number of structures again. This procedure of blurring and counting the structures is then repeated many times, in principal giving a descending slope: higher the blurring, fewer structures. The shape of the curve depends on the type of the water. Individual samples mainly differ from each other in the inclination of the curve. For the analysis of differences in this parameter, we chose a certain (characteristic) degree of blurring (see Figure 4) and compared the normalized1 number of structures of different compounds. Even if the relation between the number of structures and the blurring degree is complex, we may roughly assume that the higher the number of structures, the more heterogeneous the deposit after droplet water evaporation.
1 Normalized to the starting number of structures.
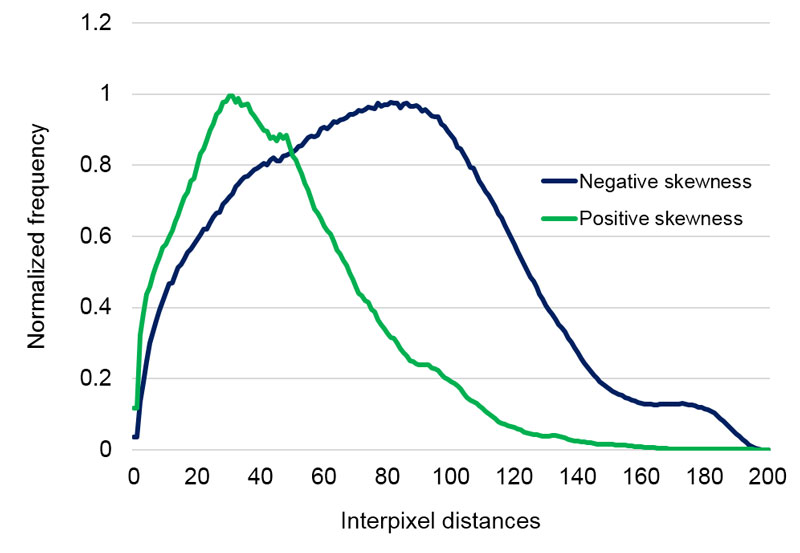
Figure 3a. Example of two curves with positive and negative skewness that represent a centripetal drive, and a radial drive towards the edge of DRP.
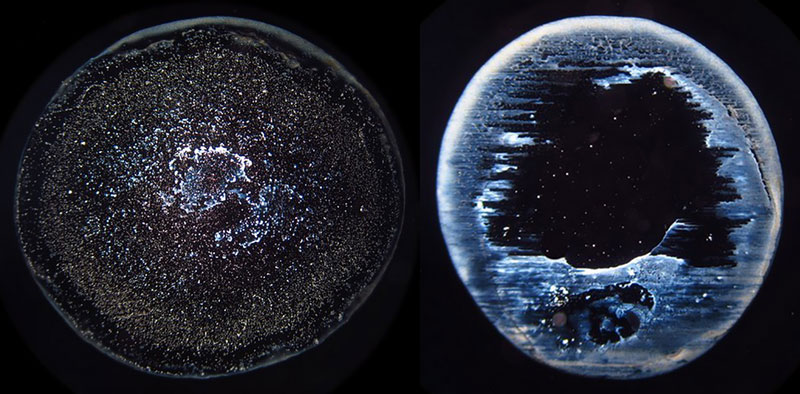
Figure 3b. Examples of droplet remnants’ images of positive (left) and negative skewness (right).
Statistical Analysis
The statistically significant differences between materials were analyzed using a two-way analysis of variance (ANOVA), followed by Tukey test for the post-hoc multiple mean comparison, Kruskal-Wallis non-parametric test and Dunnett rank test for non-equal variance. The outcome of the results was corrected by the Holm-Bonferroni correction for multiple comparisons. The correlation coefficients were obtained by Pearson’s correlation test. P values less than 0.05 were considered statistically significant. Data was analyzed using JASP open-source statistics software [34].
Results
Subtle Field Exposure (Non-contact Research)
Since in the non-contact research, effects of subtle field and not of compounds themselves, were evaluated, the samples are labeled as f(compound), meaning the field of the tested compound (e.g. f(CM) or f(CMS)). Tables 1 and 6 show the mean values of two parameters: skewness and blur for the contact and non-contact experiment.
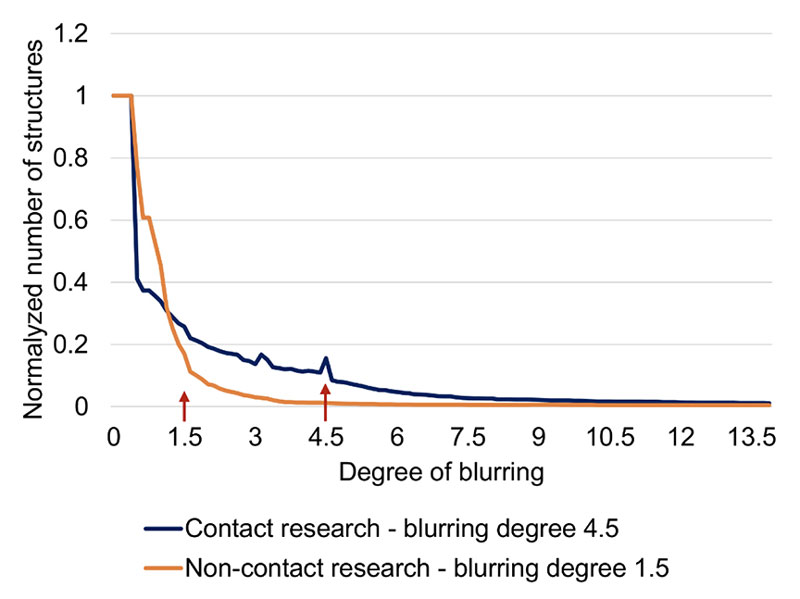
Figure 4. Typical curves of blurring analysis showing changes in number of identified structures of DRPs after blurring the image at various degrees of blurring. For example, between the points ~ 1 and 12 on the abscissa (the degree of blurring), the blue curve has a greater number of structures (is more heterogeneous) that the orange curve.
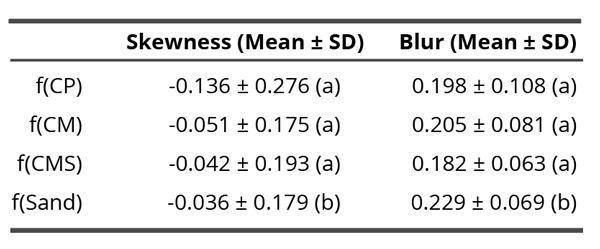
Table 1. Mean skewness and blur values in the non-contact experiment through all time points. Different letters in brackets indicate significant differences (p < 0.05) according to the Dunn’s post-hoc test. The characters a and b mean two statistically significantly different groups (therefore, the groups denoted with the same character do not differ statistically significantly but differ from any group denoted with a different character).
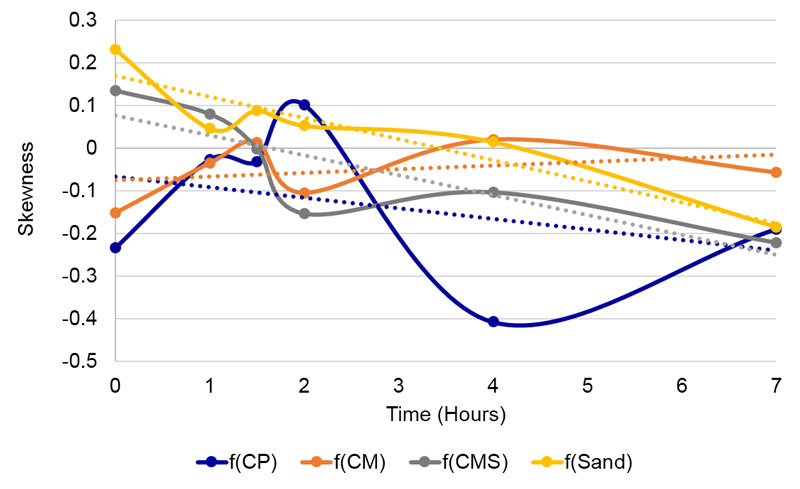
Figure 5. Changes of skewness of the tested compounds through time.
Frequency Distribution Analysis (Skewness, Centripetal Drive)
To validate whether the skewness was influenced by a compound, the Kruskal-Wallis test was conducted, which indicated significance among materials (H = 18.26, df = 3, p = 3.9 x 10⁻⁴). Dunn’s post hoc test revealed that skewness of f(Sand) was significantly smaller compared to coral calcium versions (p < 0.05). This means that the presumed subtle field of coral calcium influenced the flows in drying drops in the direction of deposing the residues more towards the edge of drops. The highest such influence may be seen with the unprocessed f(CP) compound.
Except with the field influence of the f(CM) compound, where the skewness raises through time, with all other compounds as well as with sand influence, the linear trends show shifts toward negative values. Thus, the subtle influence of the f(CM) compound influences the detector water in the direction of more central deposition of residues, while the others toward the edge.
Skewness of pure, 100% tap (Tap100) and spring water (SW100) was analyzed for comparison of similarity in variations through time. The third-degree polynomial trend line smoothing was used to fit the data (Figure 6) and then compared to the tested compounds (Figure 7, A-D). The trend line of pure tap water goes in the opposite direction as compared to spring water. The trend lines of f(CP) and f(CM) resemble the shape of spring water trend line (Figure 7A, B) and f(Sand) resembles the shape of tap water (Figure 7D), while f(CMS)’s trend line is almost a straight line (Figure 7C).
No correlations were found between different coral calcium materials, but there was a correlation between f(Sand) and f(CMS) (Pearson’s r = 0.827, p = 0.042) (Table 2, Figure 8).
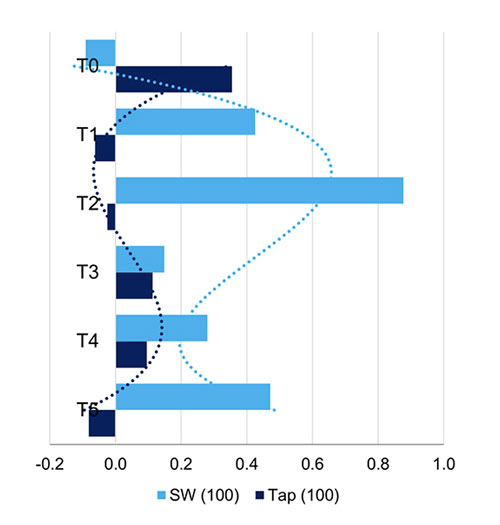
Figure 6. Third-degree polynomial trend lines of pure, 100% tap water and spring water.
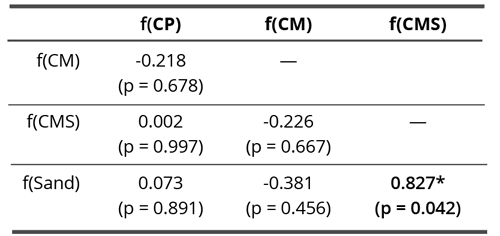
Table 2. Pearson correlation matrix of skewness/centrifugal drive in non-contact experiment. Bold values denote statistically significant correlation coefficients (p < 0.05).
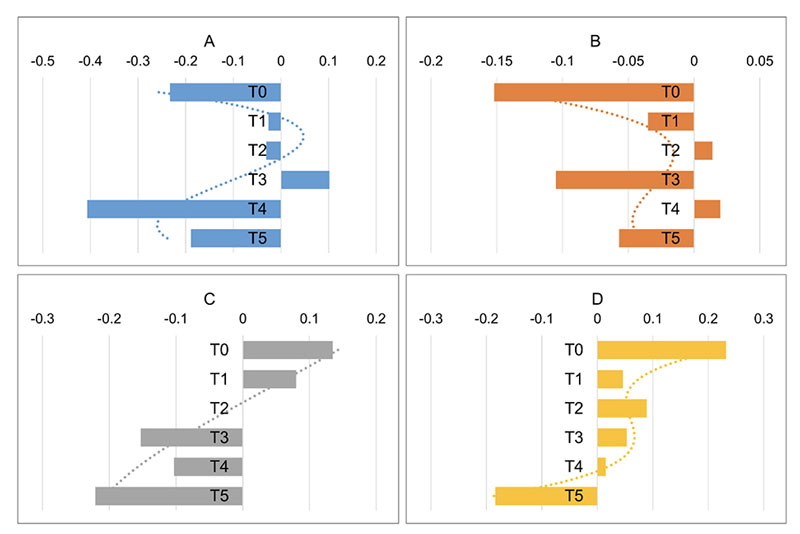
Figure 7. Third-degree polynomial trend lines of A (f(CP)), B (f(CM)), C (f(CMS)), and D (f(Sand)) through time.
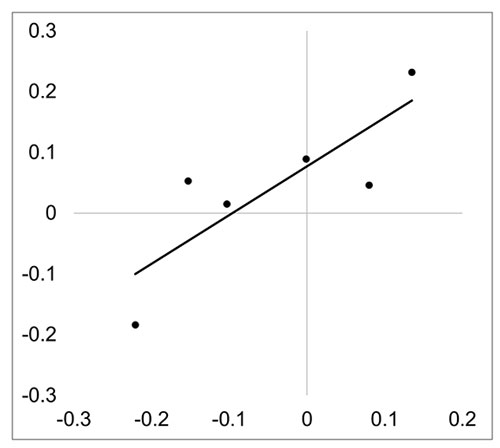
Figure 8. Correlation plot of skewness parameter between f(CMS) and f(Sand).
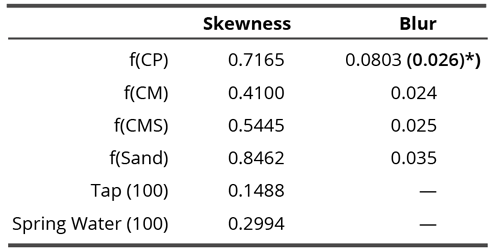
Table 3. Variability of skewness and blur through time expressed as the standard deviation of time series for each compound.
Analysis of Consecutive Structure Reduction via Blurring
The influence of Sand was significantly different (Kruskal-Wallis test, H = 18.10; df = 3, p = 4.203 x 10⁻⁴) from all three coral calcium compounds in blur parameter (Table 4). Giving the lower average score in the blur parameter and as explained in the Material and Methods section, the influence of the three calcium compounds presumably changed the deposition of residues in the sense of more homogenous precipitation. The ensuing structures were, therefore, more connected and after the working of the blurring algorithm at a chosen degree, there were a lower number of structures left. Two separate analyses were performed, one using data from all tested time points, and the second using only data from T0, T1, T2, T3 and T5. In CP, data from T4 were obviously outliers, therefore excluded from the second analysis (Table 4 and Figure 9).
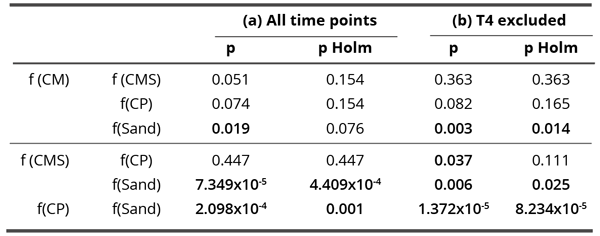
Table 4. Influence of all compounds on blur parameter: p-values of the Dunn’s post-hoc test and Holm-Bonferroni correction for multiple comparisons. Bold values denote statistically significant differences between the analyzed pair (p < 0.05). Separate analyses were performed for all data (a – through all time points) and for situation where time T4 was excluded (b).
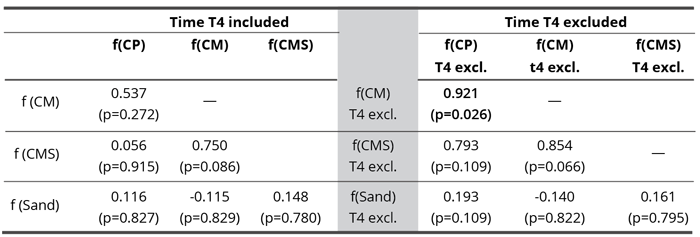
Table 5. Pearson correlation matrix of blur (a) when data from all time points were considered and (b) when T4 was excluded from the analysis. Bold value denotes statistically significant correlation coefficient (p < 0.05).
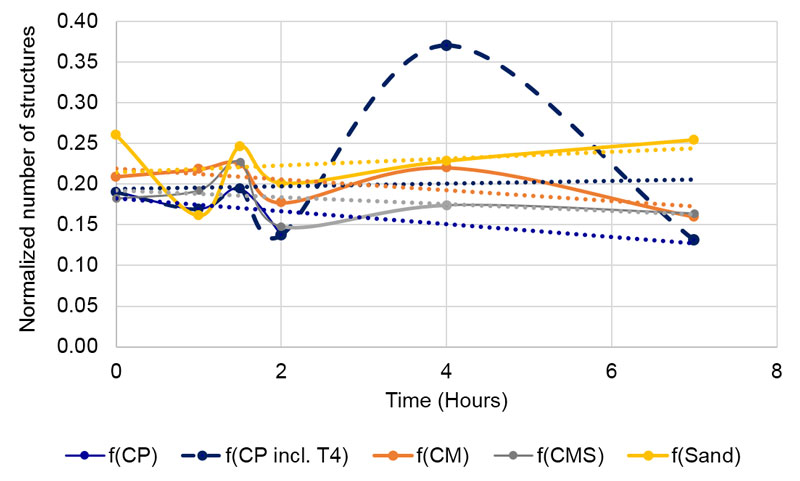
Figure 9. Changes of blur of the tested compounds through time in non-contact experiment. Blue dashed line represents f(CP) with values at 4 hours /T4), which were later excluded from the analysis.
Regarding the dynamics of blur parameter through time in all tested specimens (Figure 9), we see that the sand subtle field influenced detector water deposits gained in heterogeneousness, while the influence of coral calcium compounds yielded the opposite effect – increasing deposit homogeneousness. Thus, the dynamics corroborate the overall results, where we take the time element out of consideration.
If we hold the highly aberrant time 4 value for f(CP), then there are no significant correlations in dynamics. Only the correlation between f(CMS) and f(CP) comes close to the minimal statistically significant value and may be considered as a trend (Table 5 left,). The average values, where the time 4 (as it includes the aberrant CP value) is withheld (Table 5 right, Figure 10), demonstrate one clear statistically significant correlation (f(CM) : f(CP) and two trends (f(CMS) : f(CP) and f(CMS) : f(CM)). This indicates that in the blur parameter (speaking about the surface structuring of deposits in the sense of their homogeneity) the subtle field influence of the three coral calcium compounds is similar and different from the influence of sand.
Contact Research
Frequency Distribution Analysis: (Skewness/Centripetal Drive)
In contact research, when observed through all time points together, compounds demonstrated significant differences in skewness (Kruskal-Wallis test, H = 16.63, df = 4, p = 0.002; Table 6, Table 7 and Figure 11). CMS demonstrated significantly lower skewness compared to CM (Dunn’s test, p = 5.087 x 10⁻⁴) and Tap(40)(Dunn’s test, p = 0.032)(Table 7). Here, as already said, the influences of the subtle field and the chemical ones are inextricably mixed. Since the chemicals in all compounds have a very complex and unpredictable effect, the results demonstrate a much more blurred image than the non-contact field experiments. Thus, a highly significant difference between CMS and Tap(40) was observed, which is expected and logical; there is also no difference between tap water and water with sand, again according to expectations, but at the same time, there is no difference between CM and tap water and only a trend-like difference between CM and water with sand, which is contrary to expectations. On the other hand, there is a highly significant difference between CM and CMS. This result gives even greater weight to skewness results of subtle field experiments.
Similar to non-contact research, no correlations were found between different coral calcium materials. A significant correlation was determined between Sand and CP (Pearson’s r = 0.850, p = 0.015) (Table 8).
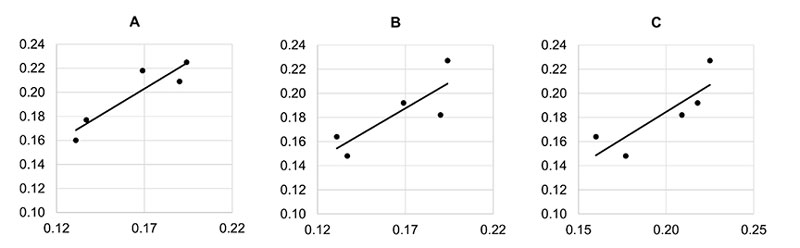
Figure 10. Correlation plots of blur parameter between (A) f(CP) – f(CM), (B) f(CP) – f(CMS), and (C) f(CM) – f(CMS) for blur parameter point 4 excluded.
Analysis of Consecutive Structure Reduction via Blurring (Structural Homogeneity)
Statistically significant (p < 0.01) differences in blur were observed among various compounds by Kruskal- Wallis test (H = 91.16, df = 4, p = 7.456 x 10⁻¹⁹, Table 6) treated through all time points together. Additional Dunn’s post hoc test (p < 0.05) showed that there were no differences among CP, CMS and Tap(40), while CM and Sand significantly differ from all other samples and each other (see letters that indicate significant differences in Table 6). Changes in blur and trends through time are presented in Figure 12.
On the verge of statistical significance, we found only the correlation between ordinary calcium sand imbued water and the one with unprocessed coral calcium (Table 9). Since here, the chemical substances dissolved in water have the strongest impact on the formation of droplet remnants, this may be interpreted as if there was a high chemical similarity between sand and coral calcium, thus justifying our choice of taking sand as the control substance for coral calcium subtle field influences.
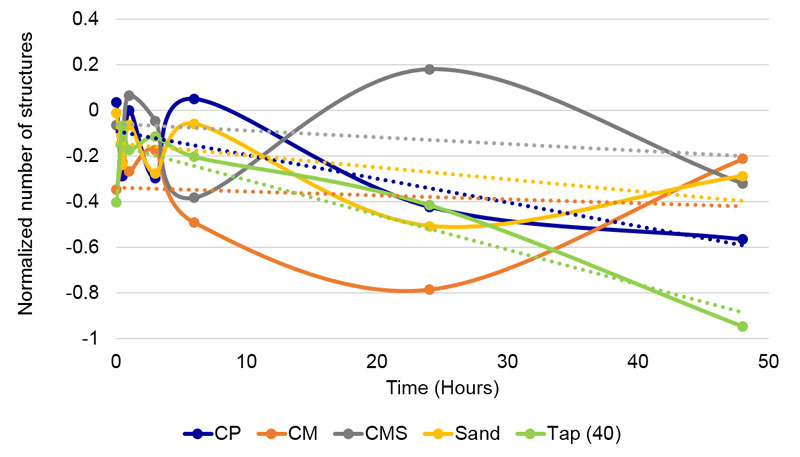
Figure 11. Changes of skewness parameter of all compounds through time in contact experiment. Linear trend lines are presented for each compound.
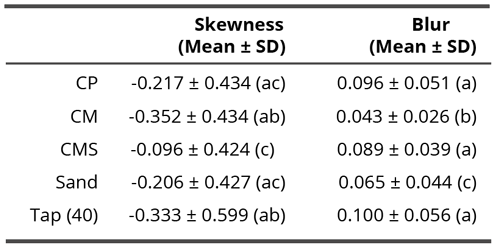
Table 6. Skewness and blur parameters in the contact experiment. Means and standard deviations are presented. Different letters indicate significant differences (p < 0.05) according to the Dunn’s post-hoc test. The characters a, b and c mean statistically significantly different groups (therefore, the groups denoted with the same character do not differ statistically significantly but differ from any group denoted with a different character).
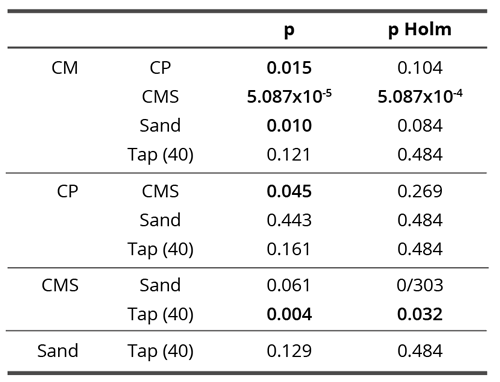
Table 7. Influence of all compounds on skewness parameter in contact experiment: p-values of the Dunn’s post-hoc test and Holm-Bonferroni correction for multiple comparisons. Bold values denote statistically significant differences between the analyzed pair (p < 0.05).
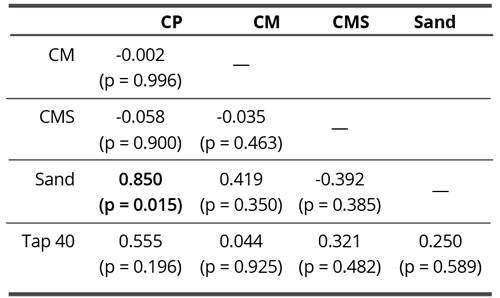
Table 8. Pearson correlation matrix of skewness (centripetal drive) in contact experiment. Bold value denotes statistically significant correlation coefficient (p < 0.05).
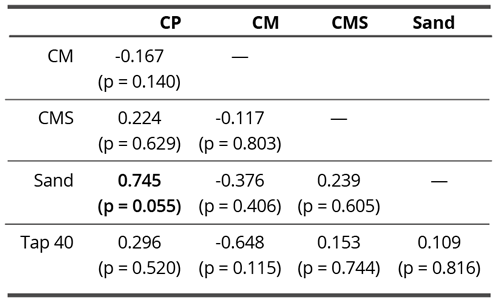
Table 9. Pearson correlation matrix of blur parameter (structural homogeneity) in contact experiment. The bold value denotes the statistically significant correlation coefficient
(p < 0.05).
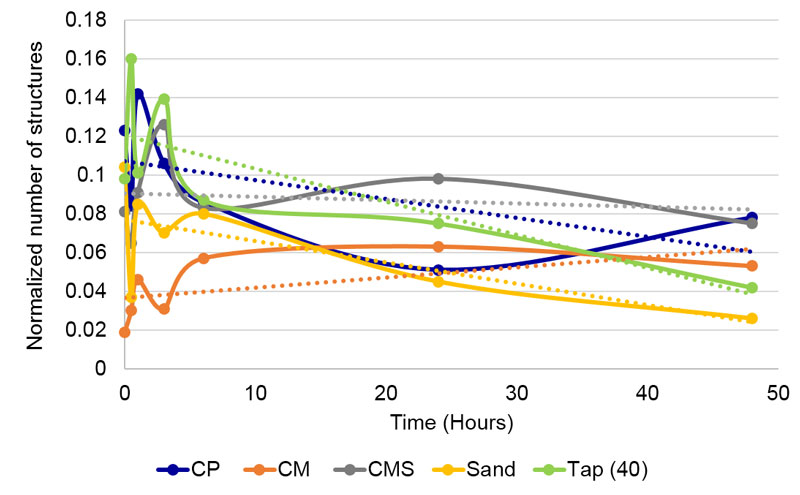
Figure 12. Changes of blur parameter of all compounds through time in contact experiment. Linear trend lines are presented for each compound.
Discussion
Despite non-negligible variations through time, the subtle field exposure of coral calcium demonstrates distinctive and statistically significant differences between coral calcium on one side and ordinary sand on the other (Tables 1 and 3). No such differences can be observed between three coral calcium varieties. We observe this in both types of analysis (blur and skewness) that represent very different structural parameters, thereby strongly validating the influence of coral calcium subtle field on mesoscopic water. As there was no chemical contact, we may conclude that the first four hypotheses (1 – about subtle field existence, 2 – about its orderliness, 3 – about the possibility of its translation into water ordered structures and 4 – about possibility of detecting such into water impressed field) are thus confirmed. In this case, where all time points are taken together, the fifth hypothesis (about the difference between different forms of coral calcium) is not confirmed. Nevertheless, looking into linear trends through time, we may see also differences between the CM (vitamin C added) trend and all the other compounds (Figure 5).
If we look at time variation (Figures 5 and 6), we may observe a relatively high similarity between the third-degree polynomial curves of CM, CP and spring water, which supports the assumption that the subtle field transference will induce more similarity with spring water, which was imbued with coral calcium, than with the tap water present only in the detector solution (confirmation of the sixth hypothesis that the subtle field of coral calcium would influence the detecting liquid in the way of preponderance of the pattern of the water in which coral calcium sand was poured). On the other hand, it is surprising that there was even a statistically significant time correlation between CMS (silver colloid addition) and sand (Table 2). They both also differ from the previously mentioned three. As the sand curve is similar to the tap water, it seems that silver in the CMS compound somewhat erased the connection to spring water and that the silver colloid addition helped to articulate the subtle field of the basic constituent, namely calcium carbonate.
Our assumption that due to the subtle field influence, coral calcium compounds will be more stable and therefore, expressing lesser time variation (hypothesis seven), was only partially confirmed. Namely, in blurring analyses, the unprocessed coral calcium influenced water showed the highest variability (Table 3, right column, Figure 9, dotted curve) if we take all time points into consideration. If we take the point 4 for the f(CP) water as an outlier, the situation fits the assumption, namely, the three values for coral calcium compounds are considerably lower than the one for the sand. We may interpret this finding also as an indication that the coral calcium is much more homogenous in its origin than the carbonate sand. The subtle field of the latter should thus have a more complex structure due to its more complex source.
The skewness parameter shows a different picture (Table 3, left column). Here, both waters used in research exhibit the lowest variability in time, as if the influence by the subtle field of a calcium carbonate-based compound significantly augmented the temporal dynamics. Among these compounds, CM influenced water again demonstrates the lowest variability and sand influenced water (f(Sand)) the highest (in agreement with the hypothesis).
The supposition (hypothesis eight) of higher correlation (higher synchronicity) in successive (time) variations between waters influenced by calcium compounds than between the ones influenced by sand (Table 2 and 5) was not confirmed in the case of skewness. Namely, as seen from Table 2 and Figure 8, the only significant correlation was evidenced between sand and CMS influences, which has already been discussed. With blur (Table 6, the right column), however, the situation supports the hypothesis since when the time point 4 is excluded, f(CM)-f(CP) correlation becomes statistically significant and the other two comparisons, f(CM)-f(CMS), (CMS)-f(CP), are on the verge of significance and may be interpreted as trends (see also Figure 10). Their correlation coefficients are also quite high, for the significant one more than 0.9. On the other hand, the coefficients of all three compounds’ influence for correlation with the f(Sand) are very low, with p values exceeding 0.5.
Hypothesis nine, stating that the solutions (direct contact) of various calcium carbonate compounds would yield more blurred results than the indirect ones, was also confirmed. For instance, as seen from Table 6, the skewness of CM was almost equal to Tap(40) water, while CP is somewhere between CM and CMS, and Sand is almost equal to CP. In subtle field experiments, f(Sand) significantly differed from all three coral calcium compounds. Regarding the blur parameter, CM has the lowest value (maximal homogeneity of structures), but the next higher is Sand, followed by CMS and CP. Even here, therefore, there is no neat delineation between Sand and coral calcium compounds.
Furthermore, as seen from Figure 11, linear trends in the skewness of solutions of coral calcium compounds are between Sand and Tap(40) water, virtually between two controls, while in the subtle field influence case (Figure 5), they have all a less steep slope. It is interesting that in the blur parameter (Figure 12), the CM slope has a positive value (increasing of structural heterogeneity through time), while all other compounds and Tap(40) water have a negative slope. And again, there is no logical order, since the one with the least negative slope – therefore next to CM – is Sand and not one or both of the coral calcium compounds.
Conclusions
In conclusion, we may say that
• DEM method proved well suited to detect a subtle field effect from coral calcium compounds. It succeeded to demarcate coral calcium compounds from the control calcium carbonate sand (Table 1).
• The method also demonstrates that the solutions of these compounds, i.e., their direct impact on water that combines the chemical as well as the subtle field influence, blurs the outcome – we cannot put any clear demarcation as in the subtle field (indirect influence) case.
• Even while we used two different analytical methods for evaluating DEM images of droplet remnants (blur and skewness), they demonstrate the same basic difference between coral calcium compounds and the control sand.
• The DEM method also demonstrated differences among coral calcium compounds. In Figure 5 it is seen that CM through time gains in the centripetal drive, while the other compounds lose it.
• The results also demonstrate that the addition of silver colloid to some measure distorts the coral calcium subtle field (Figures 6 and 7, Table 2). This may be seen also on Table 4, right column for comparison between f(CMS and f(CP), which gives a statistically significant result (although only without the Holm-Bonferroni correction) and also from Table 5 (right column), where f(CP) and f(CM) are most close to each other.
Funding
In a significant part, this research was supported by Coral Club International, Canada.
Acknowledgments
I would like to thank the BION research team and the business secretary to make possible this research and the writing of the manuscript.
Conflicts of Interest
The author declares no conflict of interest. The funders had no role in the design of the study; in the collection, analyses, or interpretation of data; in the writing of the manuscript, or in the decision to publish the results.
Discussion with Reviewers
Reviewer: Can solution conditions such as pH, ionic compositions and concentrations impact this field effect?
Author: The answer to these questions would demand special experiments. Nevertheless, we tested the effect of a lower redox potential (the addition of vitamin C) as well as the addition of colloidal silver. The differences are discussed in the manuscript.
Reviewer: This is a natural product derived mostly from shells and bioerosion of the limestone skeletal material of marine organisms. It is expected, therefore, that it has its own subtle field considering its biological origin. Rather than using this sand as a reference, it may be better to use chemically prepared reagent grade pure CaCO3 as a reference. Is there any specific reason to use the sand as a reference?
Author: We also sought something similar regarding granulation, not only chemical composition, and found that a sift carbonate sand served this purpose quite well.
Reviewer: It is discussed that f(CM) shows an effect of increasing the centripetal drive with time. This may imply that the surface tension is increasing with the exposure to the subtle field of CM. Also, it is described that f(CM) is increasing the homogeneousness of the detector water. Would it be possible to say that the increase of surface tension has a correlation with the increase in homogeneousness of water? If this is right, it would be possible to say that the increased surface tension, i.e., increased bonding force, is due to a change in water structure to the more homogeneous one.
Author: During evaporation, the particles inside the droplet experience several forces, which include surface tension (or capillary) force, drag force, friction force, and adhesion forces due to the van der Waals force and electrostatic interaction forces between particles and substrate, as well as among the particles themselves inside the fluid. The particle deposition near the border droplet line is the result of the competition between these forces acting on each of the particles near the line. During evaporation, as the inward surface tension force overcomes all other forces, I would feel safe in claiming the above assumption only after a specific examination and surface tension measurements.
Reviewer: The author uses tap water and spring water for DEM and describes how a strong field of spring water could affect DEM. Then, the author uses a mixture of tap water and spring water for detecting DRP. However, it is possible that the mineral concentration of each water is a more important factor than the field of spring water. If DEM is used as a general method in the future, using ambiguous tap water and spring water is not a good idea. I think using distilled water and an accurate amount of minerals could be better for DEM.
Author: I understand this logical expectation. However, we tried to do experiments with distilled water and a defined amount of minerals and this did not yield as characteristic a “signature” as our testing spring water. Nevertheless, in the future, we will tackle this challenge to find reliable and sufficiently expressive synthetic water again.
Reviewer: I can guess that the field of CM and CMS should be much different than that of CP. The field differences of three of them are almost to the level of different substances. DEM could also be used for detecting subtle field differences like homeopathic water or water memory. For detecting subtle field differences of water memory, they all use the same water.The impact of measuring the subtle field is important for DEM.
Author: In our past, we tackled such experiments, and we plan to do much more systematic research in homeopathic preparations above the Avogadro limit in the future.
References
1. Pietschmann, H. Das Ende des naturwiessenschaftlichen Zeitalters; Zsolnay Verlag: Wien, Hamburg. Austria, Germany, 1980; see also https://www.smithsonianmag.com/smart-news/1803-rain-rocks-helped-establish-existence-meteorites-180963017/
2. Kregar A. Aharonov-Bohm effect, 2011. Available online: http://mafija.fmf.uni-lj.si/seminar/files/2010_2011/seminar_aharonov.pdf (accessed on 30th March 2020).
3. Jerman, I.; Dovč, P.; Ratajc, P. Influencing Relaxation by a Low Intensity Transcranial Pulsed Magnetic Stimulation Applying the Entrainment Model. OALib 2019, 6, 5741.
4. Constantz, B.R. Coral skeleton construction: a physiochemically dominated process. Palaios 1986, 1(2), 152-157.
5. Wang, R.F. Absence of the electric Aharonov-Bohm effect due to induced charges. Sci. Rep. 2015, 5, 14279.
6. Kernbach, S. Distant Monitoring of Entangled Macro-Objects. NeuroQuantology 2019, 17(3), 19-42. 10.14704/nq.2019.17.03.1977
7. Ferrara, I.; Egan, C. G.; Foletti, A. Pilot Study on the Effect of Biophysical Therapy on Salivary Alpha-Amylase as a Surrogate Measure of Anxiety/Stress: In Search of a Novel Noninvasive Molecular Approach for the Management of Stress. Int. J. Mol 2020, 21(2), 415.
8. Montagnier, L.; Del Giudice, E.; Aïssa, J.; Lavallee, C.; Motschwiller, S.; Capolupo, A.; … & Vitiello, G. Transduction of DNA information through water and electromagnetic waves. Electromagn Biol Med. 2015, 34(2), 106-112.
9. Ball, P. Water: water—an enduring mystery. Nature 2008, 452(7185), 291.
10. Ho, M.W. Large supramolecular water clusters caught on camera-A review. Water 2014, 6, 1-12.
11. Chaplin, M.F. The memory of water: an overview. Homeopathy 2007, 96(03), 143-150.
12. Giudice, E.D.; Spinetti, P.R.; Tedeschi, A. Water dynamics at the root of metamorphosis in living organisms. Water 2010, 2(3), 566-586.
13. Zheng, J.M.; Chin, W.C.; Khijniak, E.; Khijniak Jr, E.; Pollack, G. H. Surfaces and interfacial water: evidence that hydrophilic surfaces have long-range impact. Adv Colloid Interfac. 2006, 127(1), 19-27.
14. Tarafdar, S.; Tarasevich, Y.Y.; Dutta Choudhury, M.; Dutta, T.; Zang, D. Droplet drying patterns on solid substrates: from hydrophilic to superhydrophobic contact to levitating drops. Adv Cond Matter Phys 2018, 2018, 1-24.
15. Malinowski, R.; Volpe, G.; Parkin, I.P.; Volpe, G. Dynamic control of particle deposition in evaporating droplets by an external point source of vapor. J. Phys. Chem 2018, 9(3), 659-664.
16. Yakhno, T.A.; Sedova, O.A.; Sanin, A.G.; Pelyushenko, A.S. On the existence of regular structures in liquid human blood serum (plasma) and phase transitions in the course of its drying. Tech Phys+ 2003, 48(4), 399-403.
17. Brutin, D.; Sobac, B.; Loquet, B.; Sampol, J. Pattern formation in drying drops of blood. J Fluid Mech. 2011, 667, 85-95.
18. Chen, G.; Mohamed, G.J. Complex protein patterns formation via salt-induced self-assembly and droplet evaporation. Eur Phys J E 2010, 33(1), 19-26.
19. Kokornaczyk, M.O.; Dinelli, G.; Marotti, I.; Benedettelli, S.; Nani, D.; Betti, L. Self-organized crystallization patterns from evaporating droplets of common wheat grain leakages as a potential tool for quality analysis. Sci. World J. 2011, 11, 1712-1725.
20. Yakhno, T.; Sanin, A.; Yakhno, V.; Guguchkina, T.; Markovsky, M. Wine recognition system based on drying drop technology. European j. biotechnol. biosci. 2016, 4(19), 25-33.
21. Deegan, R.D. Pattern formation in drying drops. Phys. Rev. E 2000, 61(1), 475.
22. Weon, B. M.; Je, J. H. Self-pinning by colloids confined at a contact line. Phys. Rev. Lett. 2013, 110(2), 028303.
23. Deegan, R. D.; Bakajin, O.; Dupont, T. F.; Huber, G.; Nagel, S. R.; Witten, T. A. Capillary flow as the cause of ring stains from dried liquid drops. Nature 1997, 389(6653), 827.
24. Deegan, R. D.; Bakajin, O.; Dupont, T. F.; Huber, G.; Nagel, S. R.; Witten, T. A. Contact line deposits in an evaporating drop. Phys. Rev. E 2000, 62(1), 756.
25. Zang, D.; Tarafdar, S.; Tarasevich, Y. Y.; Choudhury, M. D.; Dutta, T. Evaporation of a Droplet: From physics to applications. Phys. Rep. 2019, 804, 1-56.
26. Yakhno, T.; Yakhno, V.; Sanin, A.; Sanina, O.; Pelyushenko, A. Dynamics of phase transitions in drying drops as an information parameter of liquid structure. Nonlinear Dyn. 2005, 39(4), 369-374.
27. Higashitani, K.; Oshitani, J. Measurements of magnetic effects on electrolyte solutions by atomic force microscope. Process Saf Environ 1997, 75(2), 115-119.
28. Han, Y.; Grier, D.G. Colloidal electroconvection in a thin horizontal cell. I. Microscopic cooperative patterns at low voltage. J Chem Phys 2005, 122(16), 164701.
29. Kokornaczyk, M.O.; Trebbi, G.; Dinelli, G.; Marotti, I.; Bregola, V.; Nani, D., … & Betti, L. Droplet evaporation method as a new potential approach for highlighting the effectiveness of ultra high dilutions. Complement. Ther. Med. 2014, 22(2), 333-340.
30. Del Guidice, E.; Vitiello, G. Role of the electromagnetic field in the formation of domains in the process of symmetry-breaking phase transitions. Phys. Rev. A 2006, 74(2), 022105.
31. Rey, L. Thermoluminescence of ultra-high dilutions of lithium chloride and sodium chloride. Physica A: Physica A 2003, 323, 67-74.
32. Rey, L. Can low-temperature thermoluminescence cast light on the nature of ultra-high dilutions?. Homeopathy 2007, 96(03), 170-174.
33. Jerman, I.; Ratajc, P. A further indication of the self-ordering capacity of water via the droplet evaporation method. Entropy 2014, 16(10), 5211-5222.
34 JASP Team (2019). JASP (Version 0.11.1)[Computer software].