
![]()
Strong Gradients in Weak Magnetic Fields Affect the Long-Term Biological Activity of Tap Water
Astrid H. Paulitsch-Fuchs1,2,3, Natalia Stanulewicz1, Bernhard Pollner4, Nigel Dyer1,5 and Elmar C. Fuchs1*
1 Wetsus, European Centre of Excellence for Sustainable Water Technology, Oostergoweg 9, 8911 MA Leeuwarden, The Netherlands
2 Institute of Hygiene, Microbiology and Environmental Medicine, Medical University of Graz, Graz, Austria
3 School of Health Sciences & Social Work, Biomedical Sciences, Carinthia University of Applied Sciences, Klagenfurt, Austria
4 Division of Hygiene and Medical Microbiology, Medical University of Innsbruck, Innsbruck, Austria
5 Coherent Water Systems, UK
*Corresponding author: elmar.fuchs@wetsus.nl; Tel.: +31 – 58 284 3162
Keywords: magnetic water treatment, DOLLOPs, CFUs, NGS
Published: February 9, 2021
Abstract
It has been shown that magnetic treatment of tap water using very weak magnets with strong magnetic inhomogeneities (∇B ~ 0.8 kG m-1) accelerates the growth of nm-sized prenucleation clusters (dynamically ordered liquid like oxyanion polymers or “DOLLOPs”) in tap water. In this work we demonstrate that the same treatment can affect the long-term biological activity as seen by a change in the number of colony forming units (CFUs) after six days of incubation. Changes in colony formation can be explained by a combination of change in aggregation of the mainly negatively charged bacterial cells due to the reduction of free Ca2+ in the solution and a growth boost that can be explained by accelerated ATP production and/or faster Ca2+ transport within the bacteria, both directly induced by the magnetic field.
Introduction
Magnetic Water Treatment
The interaction of water with magnetic fields has been studied for almost a century. Starting in the 1930s (as, for example, described in the overview given by Duffy [1]) much research was done on effects of magnetic and/or electromagnetic effects on water, and over a hundred articles and reports are available in the open literature (e.g. [1-20]). Most of these publications focus on calcium carbonate precipitation, and only a few describe biological effects (e.g. [12]). It has been shown [4,13,15,16] that magnetic treatment can influence size and morphology of calcium carbonate crystals and can shift the preferred habitus from calcite to aragonite. Nevertheless, claims that the influence of a magnetic field on water could cause changes in its physical, chemical or biological properties have been met with scepticism by the scientific community due to the absence of any plausible mechanism that could explain a lasting impact of a magnetic field that would still be measurable even after the exposure itself had ceased. A hypothesis for physico-chemical changes was offered by Coey [21] based on the work by Gebauer et al. [22] and Pouget et al. [23]. Their discoveries entail a non-classical nucleation mechanism through the existence of stable prenucleation clusters in subsaturated calcium carbonate solutions, so-called “DOLLOPs” (dynamically ordered liquid like oxyanion polymers) as discussed by Raiteri and Gale [24] and Gebauer and Cölfen [25], and experimentally verified many times [23,24,25,26]. They can account for up to 50% of the calcium present in solution [23]. Molecular dynamics simulations describe them as disordered, hydrated flexible ionic polymers [27], and their size ranges from a few molecules to hundreds of nanometres. They form a liquid emulsion [26], a kind of a colloid, which is in a chemical equilibrium with the dissolved ions,
![]() (1)
(1)
In his theory, Coey [21] describes how a magnetic field gradient can accelerate the growth of these DOLLOPs. According to this theory, bicarbonate ions, which are the predominant carbonate species in solution at neutral pH, are positioned adjacent to each other on one side of a nucleation cluster and form a negatively charged surface. For the DOLLOP (whose core consists of CaCO3) to grow the protons in the HCO3– ions must be replaced by Ca2+ ions. It is upon these protons that the magnetic field gradient acts by dephasing the proton spin precession of the dimers present in the HCO3– layer. Protons with dephased spins are less stable and thus more easily replaced by Ca2+ ions, which explains why magnetic gradients can accelerate the growth of DOLLOPs. Coey [21] derived a condition for an appreciable spin dephasing effect,
![]() (2)
(2)
where C is the Coey criterion, L the length of the magnetic device, v the velocity of the DOLLOPs, fP the Larmor frequency of a proton, α the spin separation (0.25 nm) and ∇B the magnetic field gradient. If C ≥ 1, then the magnetic device can effectively accelerate the DOLLOP growth. This hypothesis was tested using water core magnets (WCMs), commercially available water treatment devices with a very low overall field strength but strong magnetic gradients [28]. Using impedance spectroscopy and laser scattering it was shown that exposure of tap water to WCMs can induce DOLLOP formation due to a sufficiently high Coey criterion, C ≥ 1 . [28]
Many manufacturers of magnetic devices claim that their treatment is also beneficial for the microbiological water quality [29], an effect often referred to as (re-)vitalization, although this term is, strictly scientifically speaking, not defined. Therefore, it should be pointed out here that it is in principle impossible to prove or disprove (re-)vitalization effects, doing so is also not the purpose of this investigation. But since magnetic treatment devices are widely applied and little is known about their effects on the natural microbiome of tap water and since we were recently able to demonstrate physico-chemical changes induced by weak fields with strong gradients [28], we chose to investigate possible biological effects of this treatment as well.
Electrical Impedance Spectroscopy (EIS)
EIS allows the simulation of a liquid by a simple electric circuit where the liquid behaves like a resistor and a capacitor in parallel: At frequencies below 105-106 Hz, ions can move along with the field (resistive behavior), and at frequencies above that, the dielectric properties of the solution begin to show (capacitive behavior). At low frequencies (< 104 Hz) ions are fast enough to form layers at the electrodes, causing the electrode or Maxwell-Wagner polarization. Mesoscale objects like DOLLOPs are much heavier than ions. They cannot follow the field as quickly and do not show the same polarization behavior. The formation of DOLLOPs is thus detectable by EIS as an increase in electric resistance due to the lower number of ions available accompanied by a decrease of electrode polarization for the same reason. In addition, if tap water contains microscale lime sediments they can dissolve due to the shift in the solubility product caused by the DOLLOP formation, and the opposite changes are observed: decrease of electric resistance, and increase of electrode polarization [28]. In the present work EIS measurements were carried out in parallel to the biological experiments as control experiments in order verify the physico-chemical action (the accelerated DOLLOP formation) of the WCMs.
Biological and Biochemical Aspects
Indirect Effects via DOLLOP Growth Acceleration
When the growth of DOLLOPs is accelerated the (bio-)availability of free Ca2+ ions can be either reduced or increased, depending on the presence of (micro-)precipitate in the water [28]. This change can then affect the aquatic microbiome. For instance, it is known that Ca2+ can promote the formation of large colonies of the cyanobacterium Microcystis by enhancing cell-adhesion [30], or that the Ca2+ concentration also regulates the proliferation and morphology of human tracheobronchial epithelial cell cultures [31]. While highly concentrated CaCl2 solutions are used for the so-called “calcium chloride transformation” to increase the ability of a prokaryotic cell to incorporate plasmid DNA allowing them to be genetically transformed [32], the role of Ca in these examples is mostly a purely electrostatic one, compensating the negative charges on the cell surfaces and thus facilitating their aggregation. In physical chemistry this counterion-mediated attraction is known as the “like-likes-like” mechanism [33]. Feynman [34] describes it in his famous lectures on physics with the following words:
“Suppose we have two unlikes that attract each other, a plus and a minus, and that they stick very close together. Suppose we have another charge in some distance away. Would it feel any attraction? It would feel practically none, because if the first two are equal in size, the attraction for the one and the repulsion for the other balance out. Therefore there is very little force at any appreciable distance. On the other hand, if we get very close with the extra charge, attraction arises, because the repulsion of likes and attraction of unlikes will tend to bring unlikes closer together and push likes farther apart.”
Whereas Feynman talked about atomic particles, it has been shown that the principle is applicable for larger micro-scale objects (e.g. charged colloidal particles) as well [33]. It is therefore reasonable to assume that a change in Ca2+ concentration will affect the colony forming capabilities of the aquatic microbiome.
Apart from this effect, since (bi-)-carbonate ions are also bound in DOLLOPs a change of pH should be expected. A preliminary study on the effects of WCMs on pH [36], however, showed no measurable differences. That result can be explained by the fact this change is probably too small to be measured: First, the change of impedance, which is only partly due to a pH change, is small [28]. Secondly, during the treatment the water samples were in constant contact with the surrounding air so carbonate built into the DOLLOPs could easily be replenished by dissolving CO2 at the air/water interface, compensating for any pH change caused by the accelerated DOLLOP formation. For the reasons mentioned above, though, pH was not monitored for the current study.
Direct Effects of Magnetism on Organisms and Biochemical Reactions
A considerable number of publications deal with possible direct effects of magnetic treatment devices on biological systems. This includes growth changes [37-40], changes in enzymatic reactions [41] and effects on cell membranes. These aspects have been investigated under different field strengths, static [42] and alternating magnetic fields as well as electromagnetic fields. Applications of magnetic treatment in biological processes span from biodegradation [37,43-46] to bone healing [47] to production of biological active substances and chemicals. For the present work we consider the following mechanism to be relevant: the results by Buchachenko et al. [48-51], which show that magnetic fields can accelerate ATP production by changing the spin-state of the components involved, similar to Coey’s considerations concerning the effect of magnetic gradients on proton spin states on the surface of DOLLOPs [21], and the hypothesis by Liboff [52], according to which ion-cyclotron resonance in living cells can facilitate the transport of Ca2+ through cell membranes.
Motivation for the Research Presented
WCMs are a type of commercially available water treatment device among many others [53,54] applied mostly to potable tap water or water in cooling loops [29]. The ones used in this study consist of two parallel stainless-steel cylinders welded together, weakly magnetized and filled with water. Normally the WCM is placed into the water to be treated or a flow-through version of the device is used. However due to experimental evidence of iron leakage from the casing of such devices [55] we chose to expose our water samples to the WCM without contact with the device itself thus assuring that any effects measured, would stem only from exposure to the magnetic field [28]. It is noteworthy that the WCMs used in the experiment are, like most magnets, made of metal and therefore are able to change the distribution of electromagnetic field in their immediate vicinity. Whereas the study of single organism behavior in artificial solutions in a shielded environment is certainly of academic interest, the impact of a WCM on the aquatic microbiome of tap water compared to its complete absence rather than to a metallic non-magnetic blank seemed more relevant because of the already widespread application of magnetic treatment on potable water. Building on previous results [28] it is logical to use WCMs and tap water for the current work, thereby repeating and confirming the induced DOLLOP formation extending the research into microbiology by measuring CFUs and a next generation sequencing (NGS) analysis. While it cannot be excluded that there might be additional electromagnetic effects taking place in addition to the magnetic ones discussed in this work, it has been shown successfully [28] that magnetic field effects are sufficient to explain the observed changes in physical water properties.
Materials and Methods
Experimental setup
The setup consisted of two different work places (treatment workplace and blank workplace) with the same conditions in the same room separated by a distance of 6 meters to ensure that the magnetic field from the treatment workplace would not influence the blank workplace. The ECIS system (Electric Cell-Substrate Impedance Sensing, Ibidi, Germany) for impedance measurements was placed in the middle between the two workplaces. Shielded wires connected the system to two ECIS 8 well stations (one at each workplace). Sample beakers, 8 well stations and the magnet (at the treatment workplace) were covered with a plastic hood with air exchange gaps at the bottom to ensure the possibility of heat exchange with the surroundings. The magnetic background field was measured before the measurements took place and found to be within the range of the terrestrial magnetic field (~0.5 G) at both workplaces. Since the WCMs used in the experimental setups are metal and can therefore change the distribution of electromagnetic field in their immediate vicinity, both workplaces were placed such that they were not in close proximity to any electrical power lines or devices. Treatment and blank workplace were randomly interchanged during the experimentation process.
Experiments
Water samples were drawn from the tap water connection in the microbiology laboratory. Before drawing the samples, the pipe was flushed for two minutes to ensure a fresh water supply. Samples of 1L were collected in glass bottles. Two beakers were filled with 200g of water from one bottle and one each was placed at the treatment workplace and the blank workplace respectively. Both beakers (with spouts for air exchange) were covered with watch glasses to avoid contamination by dust or other small airborne particles. At the magnetic workstation, one of two water core magnets (WCM serial numbers 62083545 or 62081992, type DZKL, IPF GmbH, Austria) was placed next to the beakers. All glassware was autoclaved before use and sterile work conditions and work practices were executed throughout the experiments. Two identical rectangular plastic boxes (~50·40·30 cm³) were placed top-down onto each workplace to prevent contamination from the surrounding air and create a comparable air circulation.
Sampling
After 48h, samples for microbiological analyses were drawn from the beakers after stirring the content to ensure sample uniformity. Then 4mL samples (per beaker) were pipetted into 50mL Greiner tubes and diluted (1:10) with phosphate buffered saline (PBS) (Phosphate buffered saline powder, Sigma-Aldrich, Germany). The diluted sample was vortexed and filtration of 1mL aliquots (six repetitions per sample) was performed using a microfiltration system with three parallel filtration possibilities (Microfil®, Merck Millipore, Germany) and connected to a pump (EZ-StreamTM Pump, Merck Millipore, Germany). White, gridded, mixed cellulose ester filters with a pore size of 0.45µm and ready to use 100 mL filtration funnels (both Merck Millipore, Germany) were used. Filter supports were changed after each filtration and the system was sterilized after each sample using 70% ethanol. Filters were placed on yeast extract agar plates (Yeast extract agar according to ISO 6222 GranuCultTM, Merck Millipore) and incubated at room temperature for six days. All materials used were either autoclaved or sterilized and sterile work practices were used throughout the process. Plates of treated and blank samples were placed in the same room with a distance of at least five meters; magnetic background fields at these locations were in the range of the terrestrial field. Sample preparation order and incubation places were randomly interchanged.
Pictures of the agar plates were taken after two and six days. A standardized positioning system with optimized lighting has been built to ensure good quality photographs and a Canon EOS digital camera with a standard lens was used to take the pictures.
Impedance Measurements
At 48h after the start of the experiment, the eight wells of an ECIS Cultureware 8W10E PET slide were filled with 600µL of the sample each (one slide per sample) and the slide was connected to the eight well station. Measurements were conducted in parallel for the treated and the blank samples and were started using the software of the ECIS system and either 16 (ranging from 10 Hz to 100000 Hz) or 25 frequencies (ranging from 32 Hz to 100000 Hz) were measured for each well. The data was processed using Microsoft Excel software.
Colony Count
The pictures taken after six days were processed digitally using a custom program that measured the size of the colonies and identified their color.
Statistical Analyses
Statistical analyses were performed using GenStat 17th Edition (VSN international Ltd., Hemel Hempstead, UK). For each impedance analysis, every frequency (n > 5) has been compared to blank values (n > 5) using a two-sample two-sided t-test with a 95% confidence interval. For each CFU experiment, treated plate counts (n > 5) have been compared to blank plate counts (n > 5) using a two-sample two-sided t-test with a 95% confidence interval. In addition, a Bonferroni correction using the method of Hochberg [56,57] for the p-values was applied to counteract the problem of multiple comparisons.
Paired End Sequencing – Experimental Setup and Sampling Procedure
Tap water samples were taken using the following procedure: After 20 minutes of continuous strong flow, 15 liters of tap water were collected in an adequately sized receptacle. From this initial body of water, three glass beakers were each filled with 4.2 liters (see Fig. 1). Two beakers were placed next to a WCM and one was placed at the control site at a distance of five meters from the experiment site. At both sites the background magnetic field was within the range of the natural terrestrial field. Two liters were used immediately for DNA-isolation. Before being filled, all three beakers were washed, autoclaved and thoroughly rinsed with sterile demineralized water. The container for collecting the tap water was washed, rinsed with 70% ethanol, and subsequently rinsed with sterile demineralized water. All three glass beakers were covered with aluminum foil to avoid airborne contamination and left at their designated locations at room temperature. After two and six days, two liters of water were taken from each beaker under sterile conditions and immediately used for DNA-isolation following the protocol [58]. After inactivation of DNAses and RNAses on subsequent washing of the filter-units, 0.22 µm filters (Isopore track-etched polycarbonate, 47 mm diameter, sterile, Merck Millipore) were used to filter the samples with a Microfil Filtration System (3-place manifold, 47mm, stainless steel) and Microfil funnels connected to EZ-Stream vacuum pump for liquid transfer (Merck Millipore). After filtration they were placed in DNAse/RNAse free tubes and stored at -80ºC. Finally, seven samples (one initial, three samples after two days and three samples after six days, see Fig. 1) were sent to a commercial service provider (GATC-Biotech, Konstanz, Germany) who conducted the microbiome profiling via paired-end sequencing followed by taxonomic classification of the amplified hypervariable regions of the 16S rRNA gene. The complete report of this analysis is available as supplementary material to this work. Taxonomic classification data based on ≥97% identity (best hit) with reference 16S rRNA sequences and ≥ 95% alignment coverage were used for evaluation; at the BLAST step of the analysis the E-value cutoff was ≤ 1·10-6, and only those taxa with a relative abundance of > 0.5 % were included.
Scanning Electron Microscopy
From one of the experiments, samples of both treated and untreated water were filtrated through a reverse osmosis membrane (Merck-Millipore Cooperation, Merck KGaA, Darmstadt, Germany and/or its affiliates) using an Amicon test cell. The membranes were dried and scanned with a JEOL JSM 6480 LV scanning electron microscope (SEM) (JEOL Technics Ltd., Tokyo, Japan) in high vacuum mode (emission electrons detection, acceleration voltage 10 kV, operating distance 10 mm).
Magnetic Field Characterization
The magnetic fields of the WCMs were characterized with a magnetometer (VGM, AlphaLab, Inc., Salt Lake City, UT, USA) mounted on a xyz-stage (two Thorlabs LTS 300/M translation units for x and y, and one LTS 150/M for the z direction; Thorlabs, GmbH, Dachau/Munich, Germany). The whole set-up was mounted on a TMC anti-vibration plate (75SSC-103-12 TMC Vibration control, TMC, 15 Centennial Drive, Peabody, MA, USA). The WCM to be scanned was put on a Plexiglas plate atop a wooden table. An area of 20 · 20 cm2 was sampled with steps of 1 mm, 5 mm above the magnet. Before each measurement, the sensor was zeroed inside a zero Gauss chamber (ZGC, AlphaLab Inc.) that reduces the environmental magnetic (terrestrial) field to near zero (<0.002 G). Each point was repeatedly measured until all components (x, y and z component of the magnetic field vector) did not differ by more than 5% from each other in two subsequent measurements.
Results
Tap Water Analysis
During the time period of the experiments, four random tap water samples were taken and analyzed. The concentration of their constituents is given in Figs. 2a (cations), 2b (anions) and 2c (carbon). The data were split across three graphs to increase their readability. In all graphs the same scale on the ordinate was chosen for reasons of comparison. Next to the ions shown, NO2–, PO43- and Fe2+,3+ were also investigated; their concentrations were below the Limit of Quantification (LOQ) (<0.05 mg/L).
Magnetic Field Characterization
The maximum absolute field strength of both WCMs used in this study was 6 G. Gradients in the x direction were calculated from the measured field map resulting in 740, 210 and 620 G m–1 for WCM 62083545 and 770, 170 and 560 G m–1 for WCM 62081992 for the x, y and z components of the vector field, respectively. These gradients correspond to Coey criteria between C = 1.8 (for 170 G·m–1) and C = 8.1 (for 770 G·m–1), so the Coey inequality (eq. 2) was fulfilled, C ≥ 1 for both WCMs. A detailed calculation of the Coey criterion, images of the fields and the gradients of these WCMs have been published earlier [28].
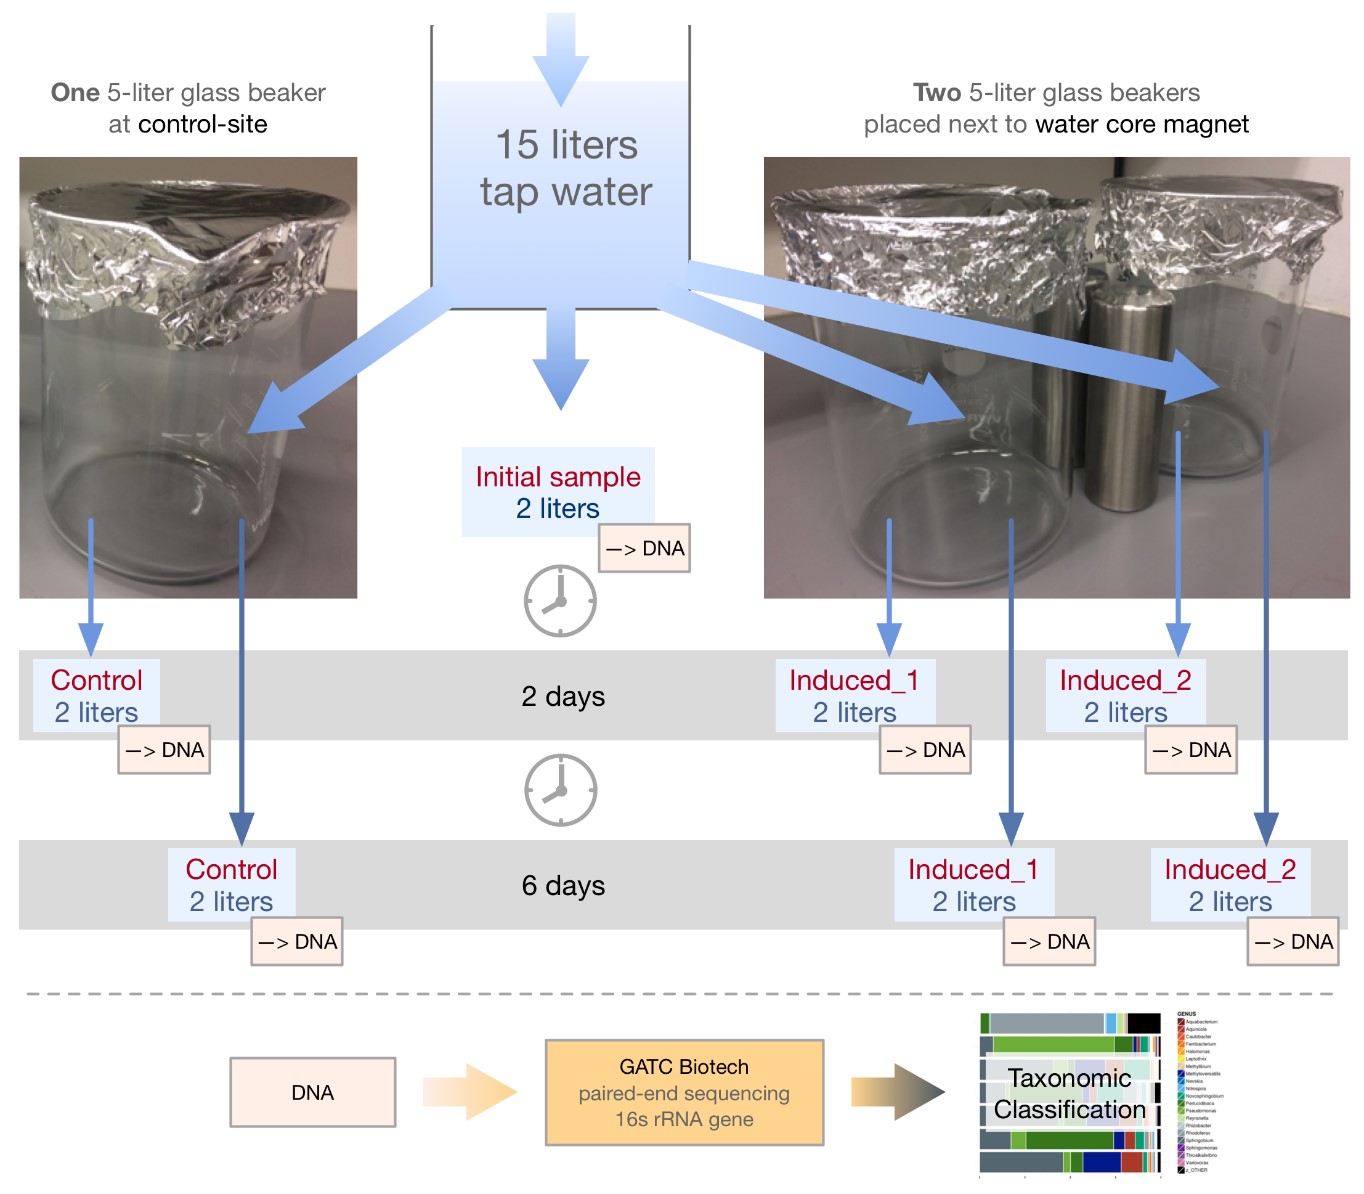
Figure 1. Experimental setup for the microbiome analysis. Tap water was collected and, after DNA extraction for evaluating the initial microbiome status, split into three glass beakers: two were placed next to a WCM, one at a control site at a distance of five meters. After two and six days at room temperature, two liters of water were taken from each beaker and used for DNA extraction, which was, finally, sent to a commercial NGS service provider to conduct the microbiome profiling.
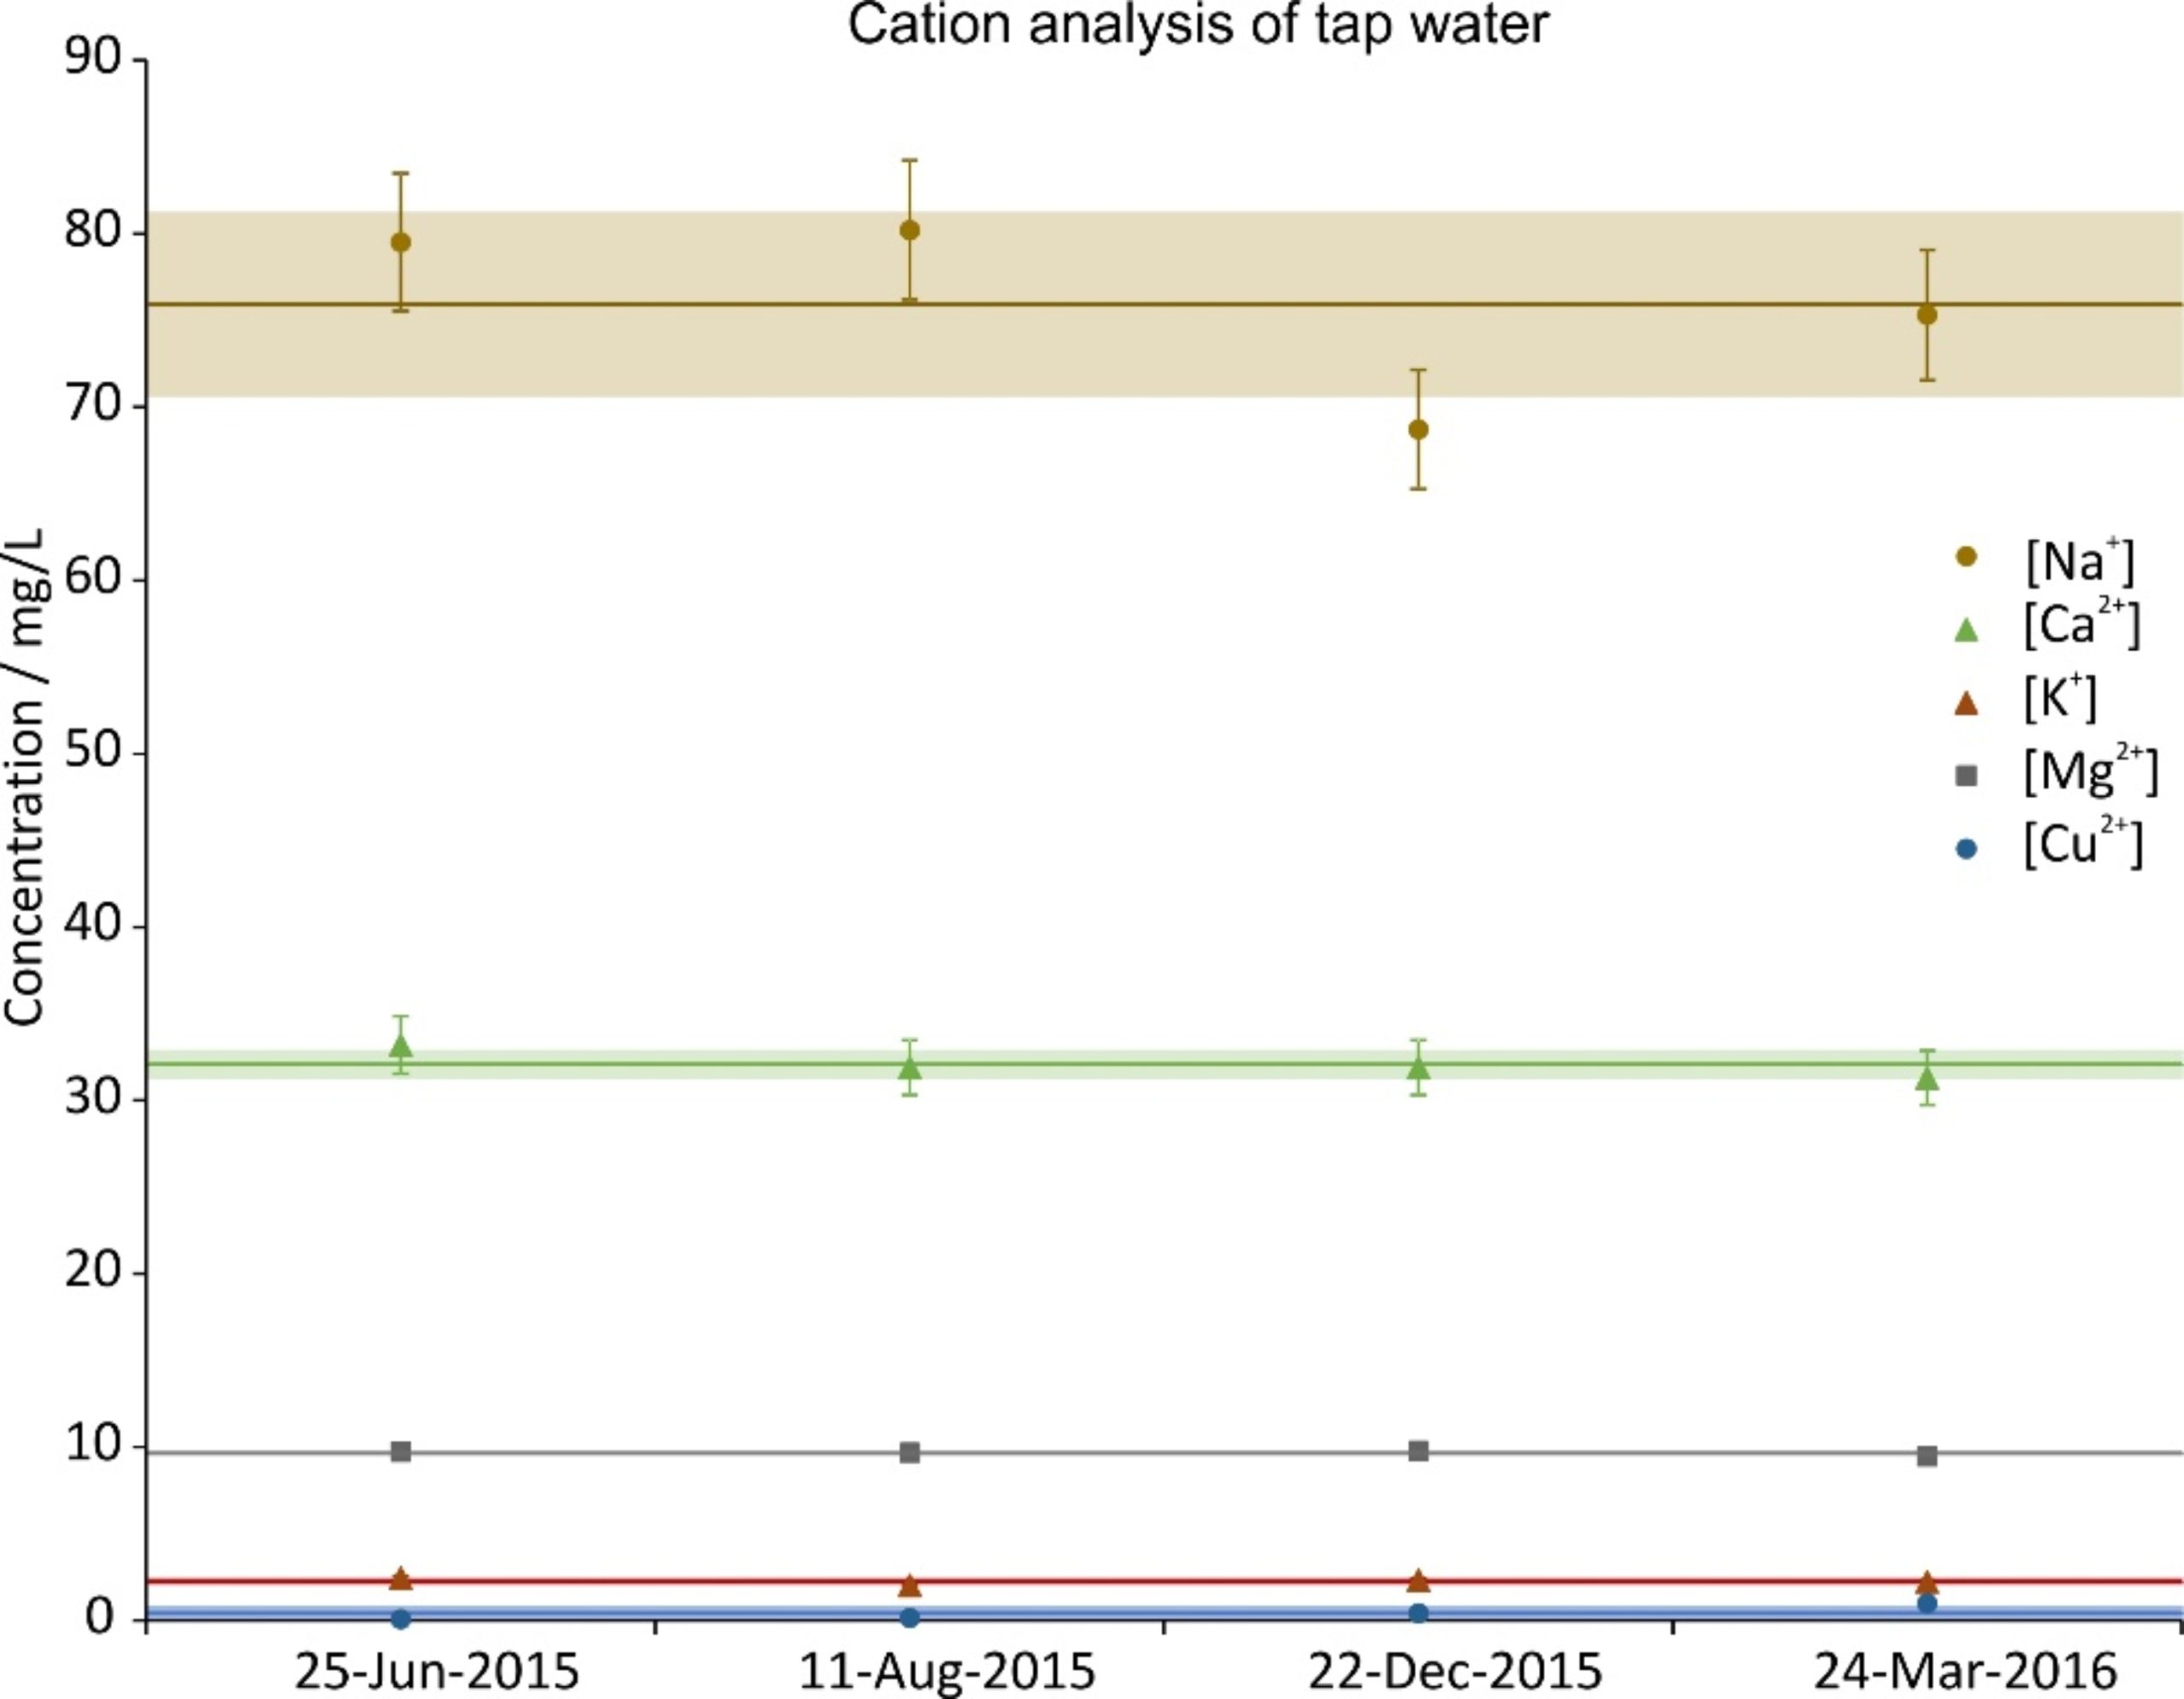
Figure 2a. Cation concentration of four random tap water samples during the investigation period. The error bars show the precision of the measurement (5%); the lines are the averages and the shaded regions depict the standard deviations over the four samples.
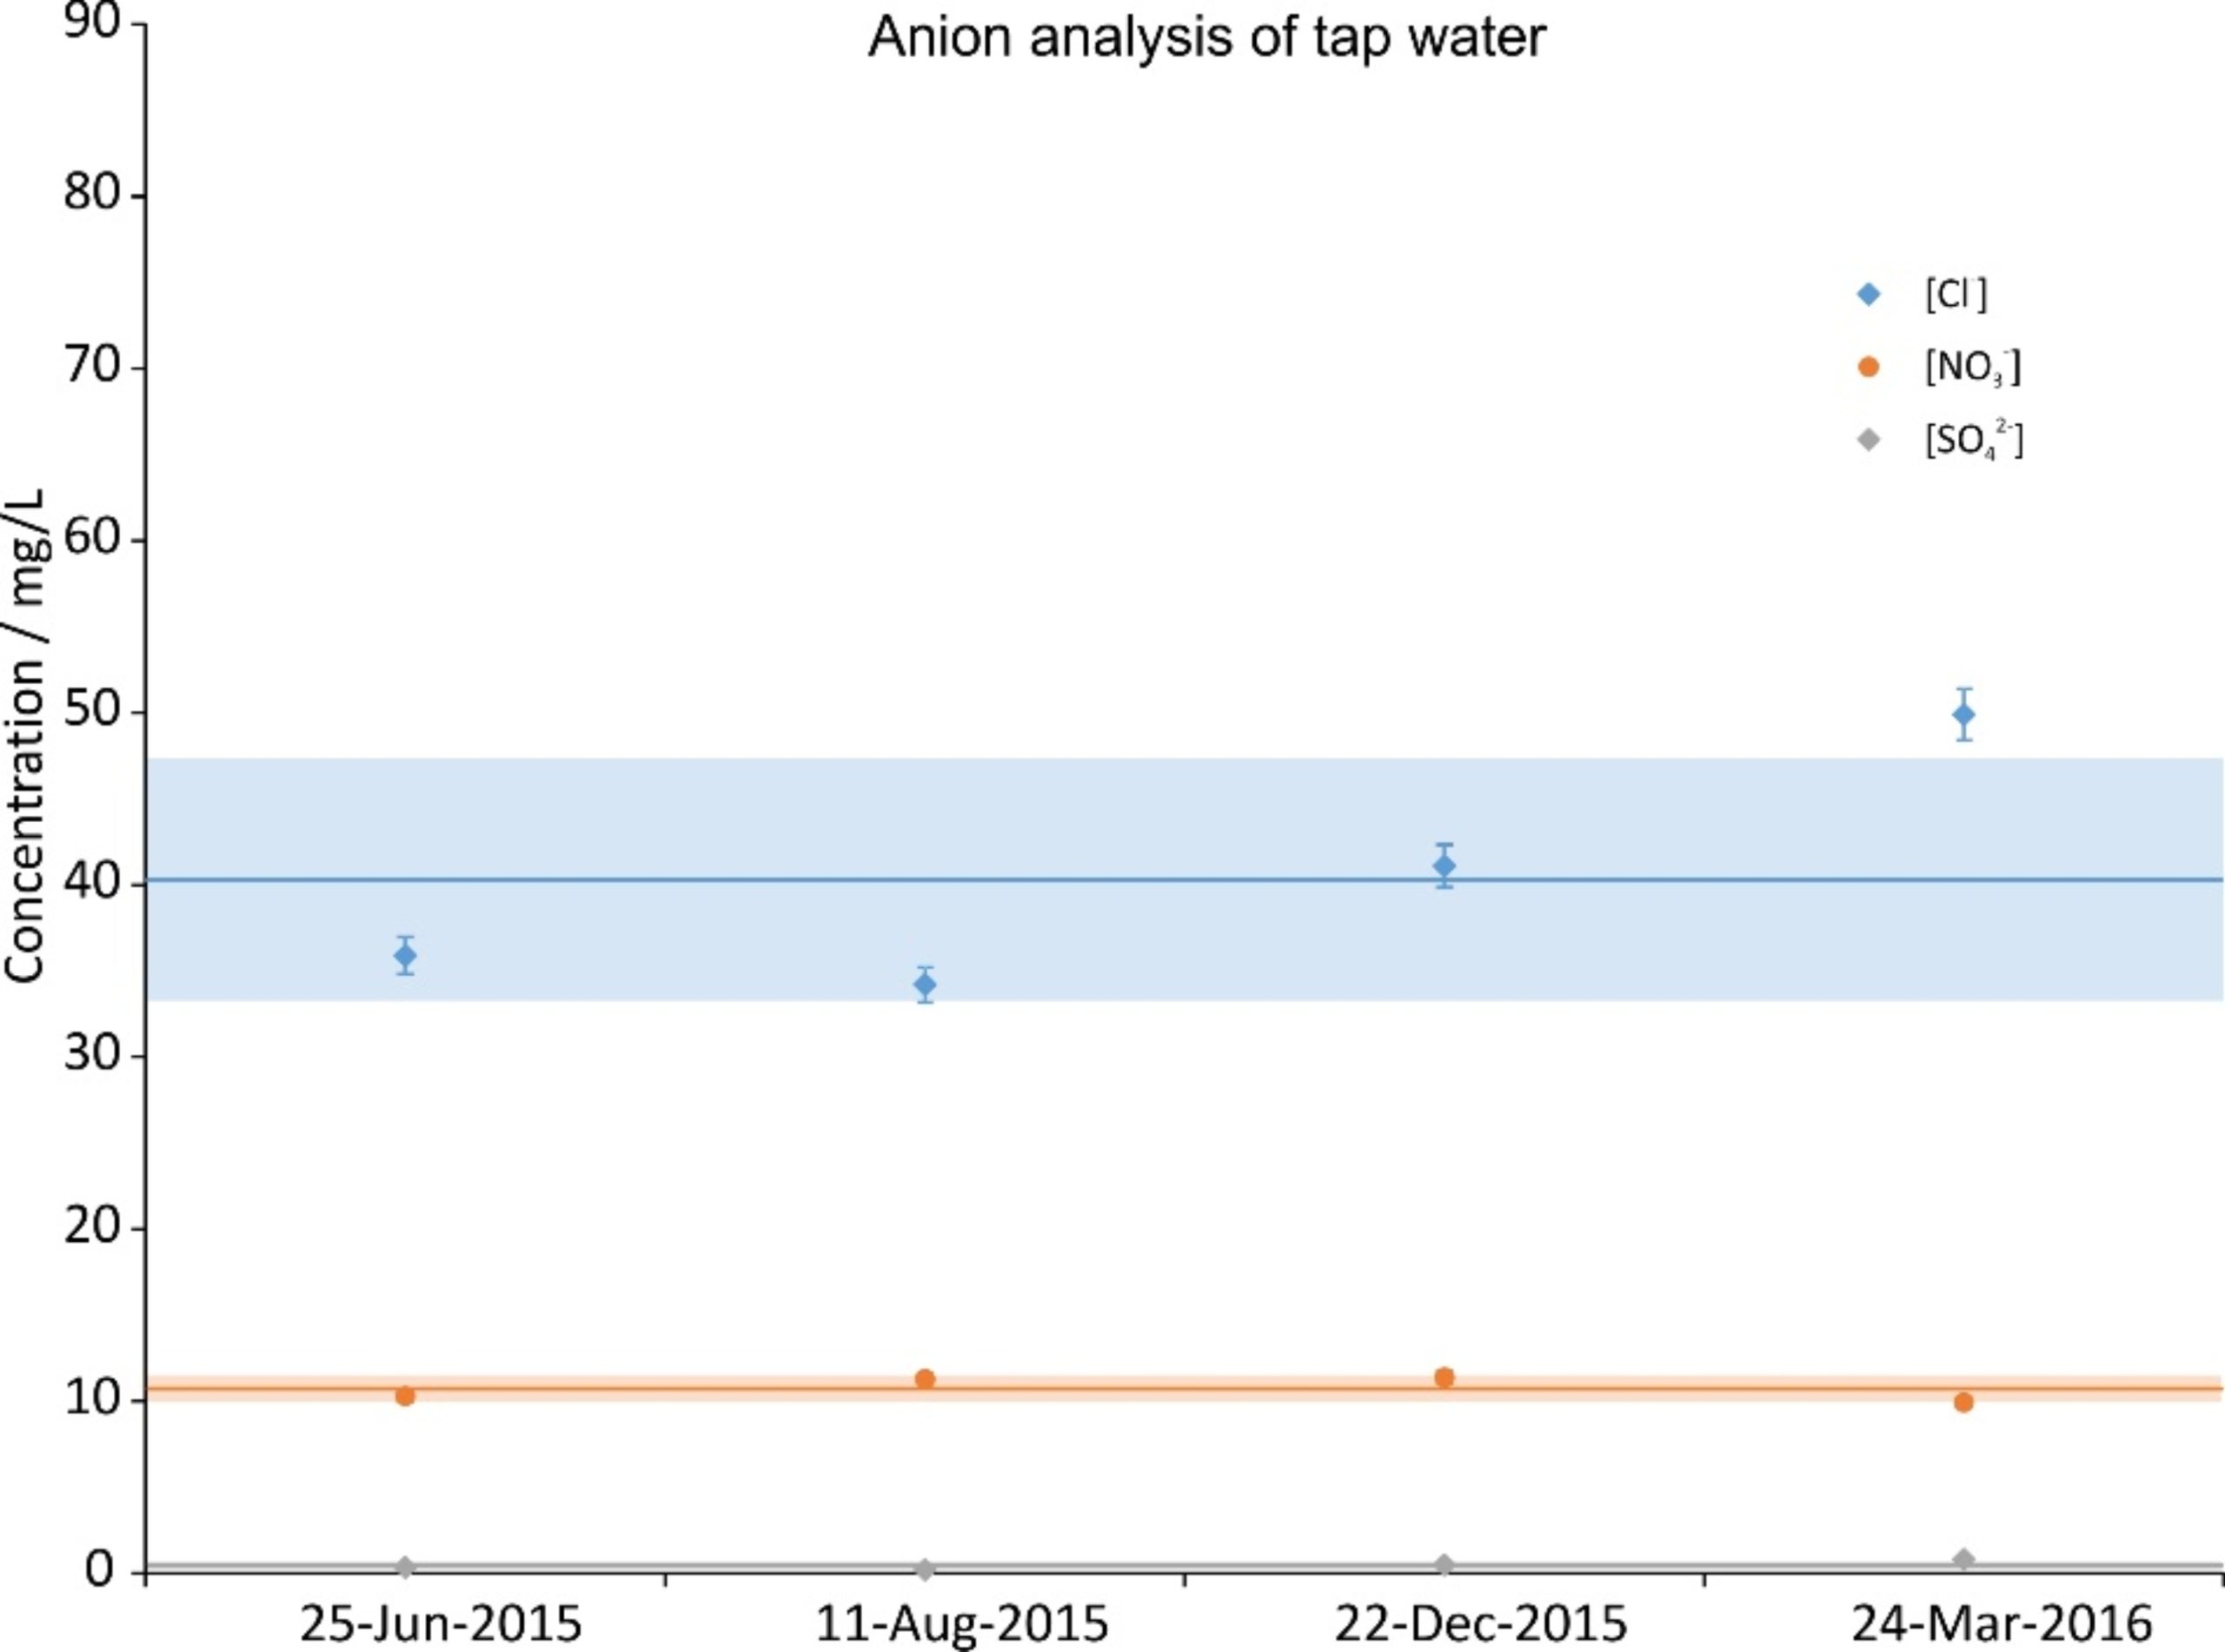
Figure 2b. Anion concentration of four random tap water samples during the investigation period. The error bars show the precision of the measurement (3%); the lines are the averages and the shaded regions depict the standard deviations over the four samples.
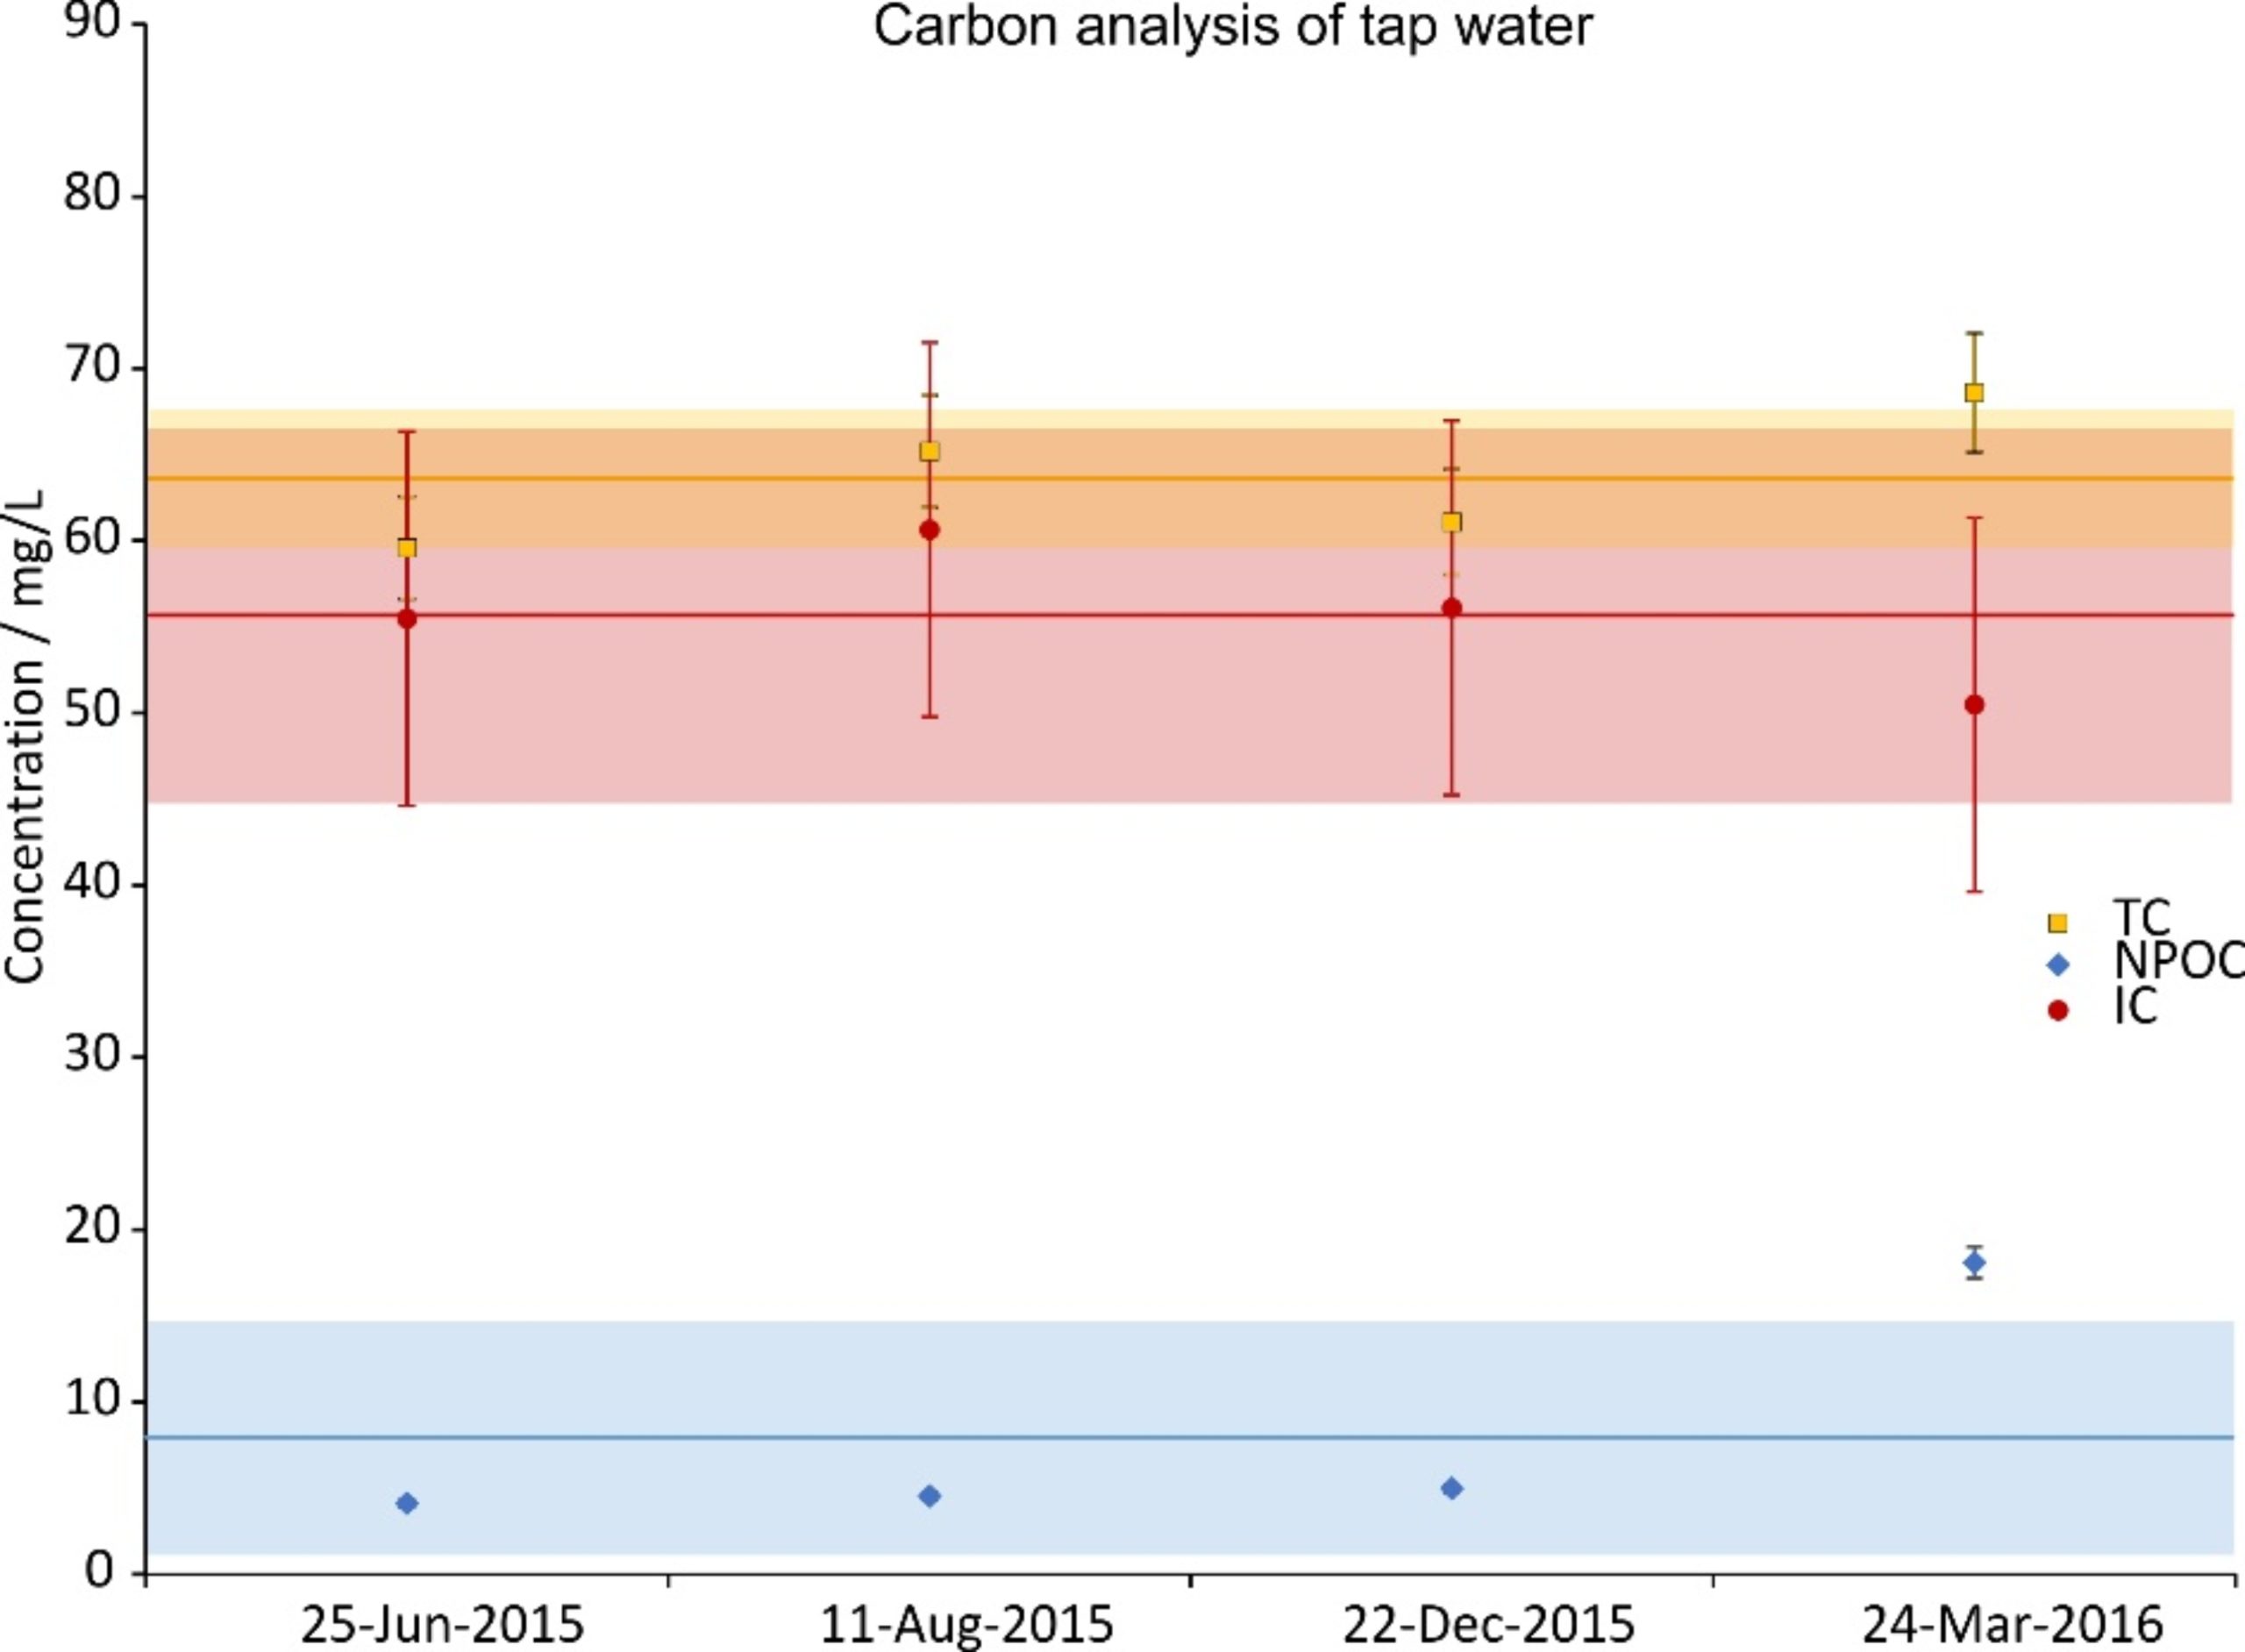
Figure 2c. Total carbon (TC), inorganic carbon (IC) and non-purgeable organic carbon (NPOC) concentrations of four random tap water samples during the investigation period. IC was calculated from a difference of TC and NPOC. The error bars show the precision of the measurement (5%); the lines are the averages and the shaded regions depict the standard deviations over the four samples.
Impedance Measurements
Impedance analysis of the ten experiments (eight samples and eight blank measurements per experiment, 16 or 25 frequencies per sample, two measurement parameters) showed statistically significant differences (confidence interval of 95%) in seven of the ten experiments. In six of the 10 experiments, highly significant differences were obtained. Significances occurred either in Z or φ or both parameters. Table 1 lists the number of frequencies showing either a 95 or 99% difference for Z and or φ per experiment.
Colony Count
Colonies were classified as small (r ≤ 0.2 mm) and big (r > 0.2mm) and counted. Colonies of treated and untreated samples after two and six days of incubation were compared. After two days in all cases the colony count was too low to be evaluated (CFU < 30), and in most cases there were no visible colonies at all (see Fig. 3a and b). The colony counts after six days were high enough to be evaluated (CFU ≥ 30). Fig. 3 shows a representative example of colonies after two days and six days, for treated (b, d) and untreated (a,c) samples, respectively.
Statistically significant differences (confidence interval 95%) were detected in nine of the ten experiments, four of which were statistically significantly different in both parameters. Colonies smaller than 0.2mm in diameter showed a significant difference in five experiments, and colonies bigger than 0.2mm in diameter in seven experiments. After applying the Bonferroni correction according to Hochberg [56,57] eight of the ten experiments show statistically significant differences (95% confidence interval). These results are summarized in Fig. 4. The original and the corrected p-values are given in Table 2. The p-values smaller than 0.001 were assumed equal to 0.001 for the calculation (conservative rounding).
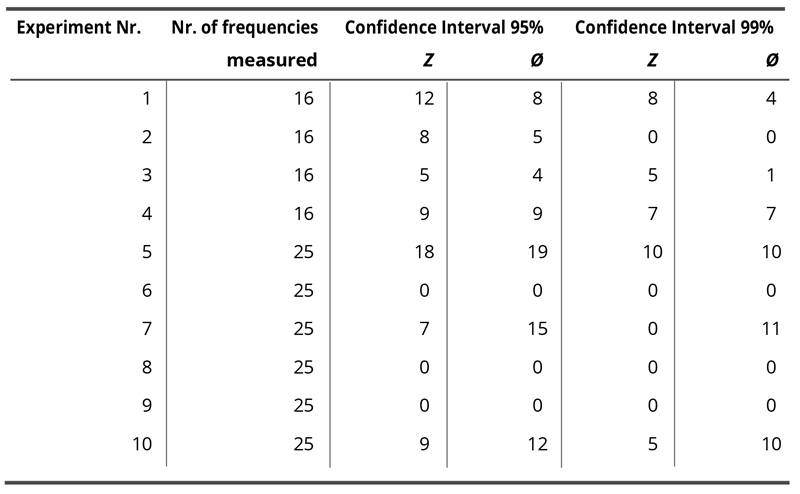
Table 1. Number of frequencies showing either a 95 or 99% difference for Z and or φ per experiment.
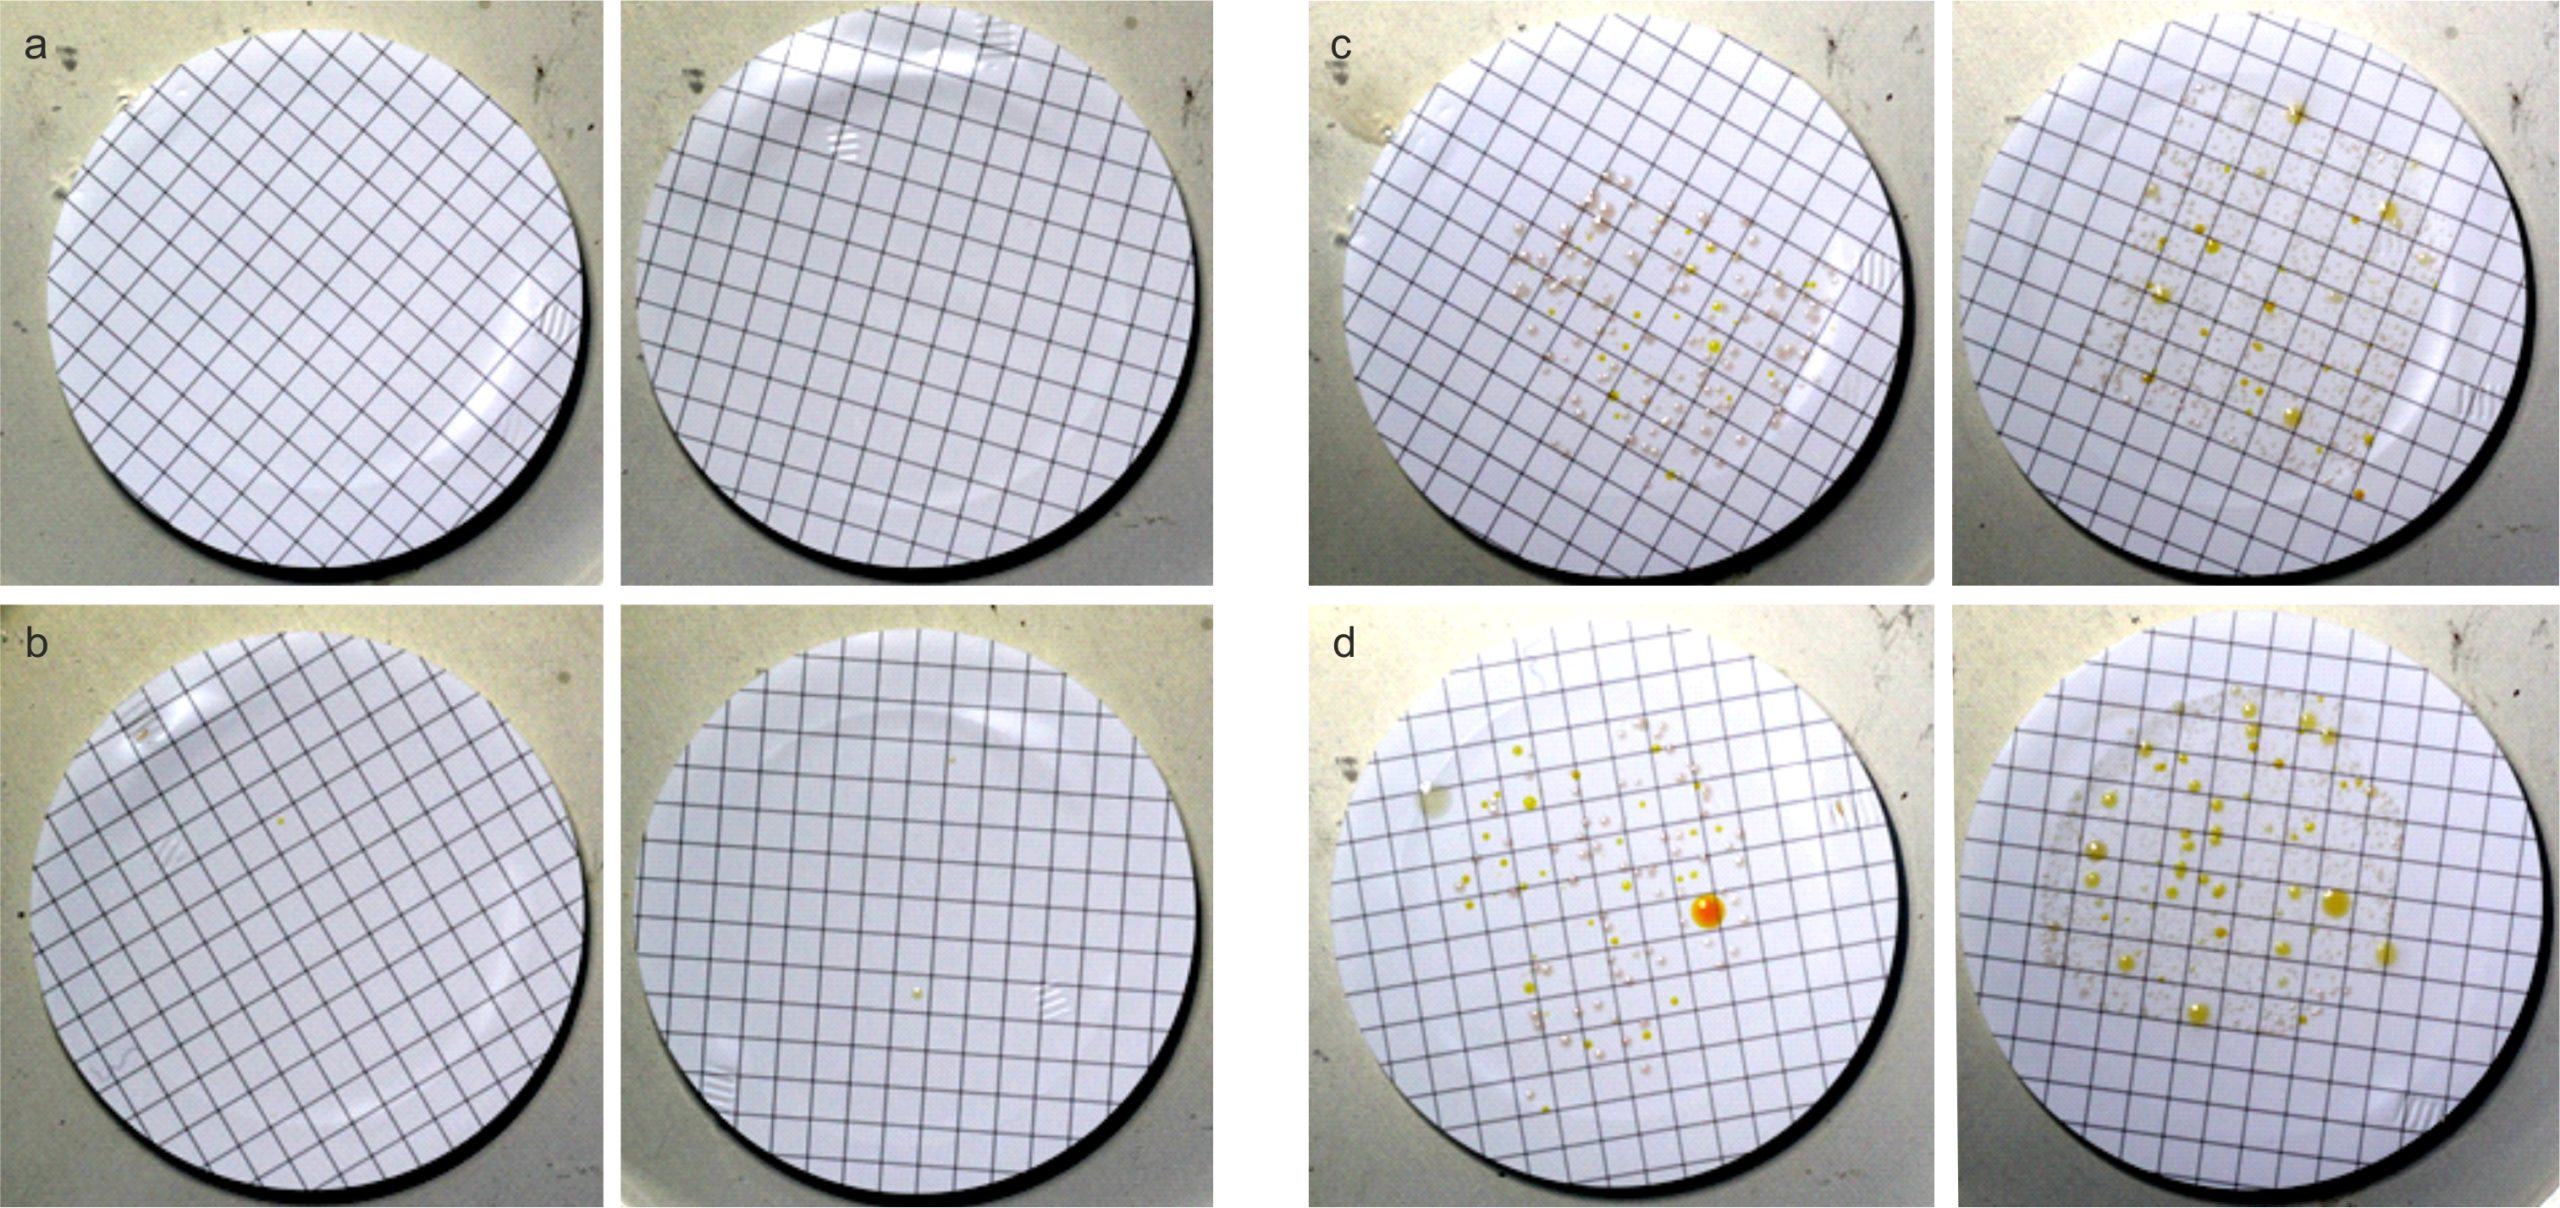
Figure 3. Exemplary bacterial colonies of untreated (a,c) and treated (b,d) samples after two (left – a,b) and six (right – c,d) days. After two days there are no colonies present in the untreated case (a), and too few to evaluate on the treated samples (b). After six days both treated and untreated samples have a high enough colony count for evaluation.
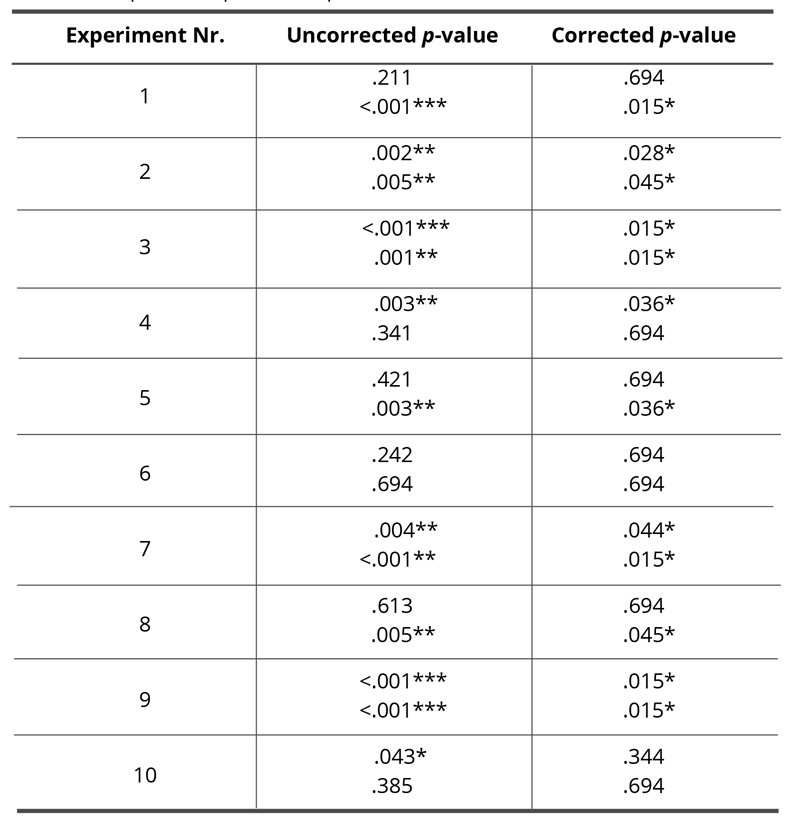
Table 2. Original and corrected p-values (Bonferroni, Hochberg [56,57]) for each group in each experiment for colonies <0.2mm (first value) and colonies >0.2mm (second value), respectively. The asterisks mark the significant differences, * p < .05, ** p < .01, *** p < .001
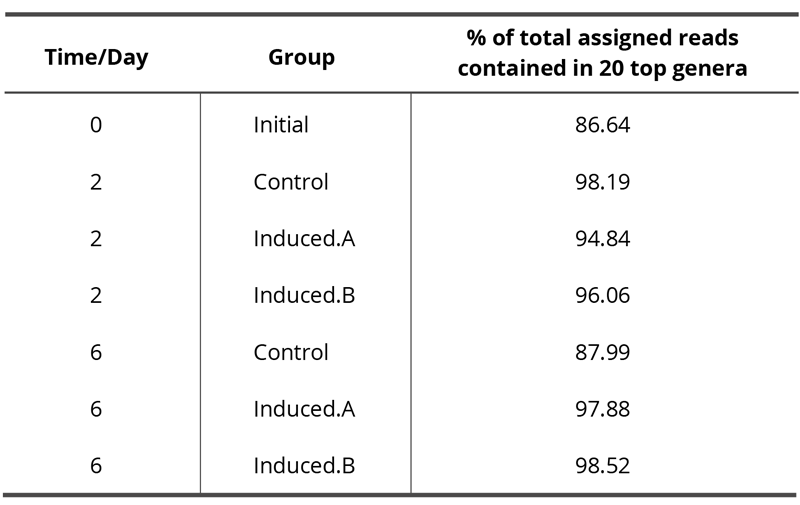
Table 3. Percentage of total assigned reads, i.e. the percentage of total reads assigned to a taxonomic unit that is contained in the displayed top 20 genera. More details can be found in the GATC report that is available as supplemental material.
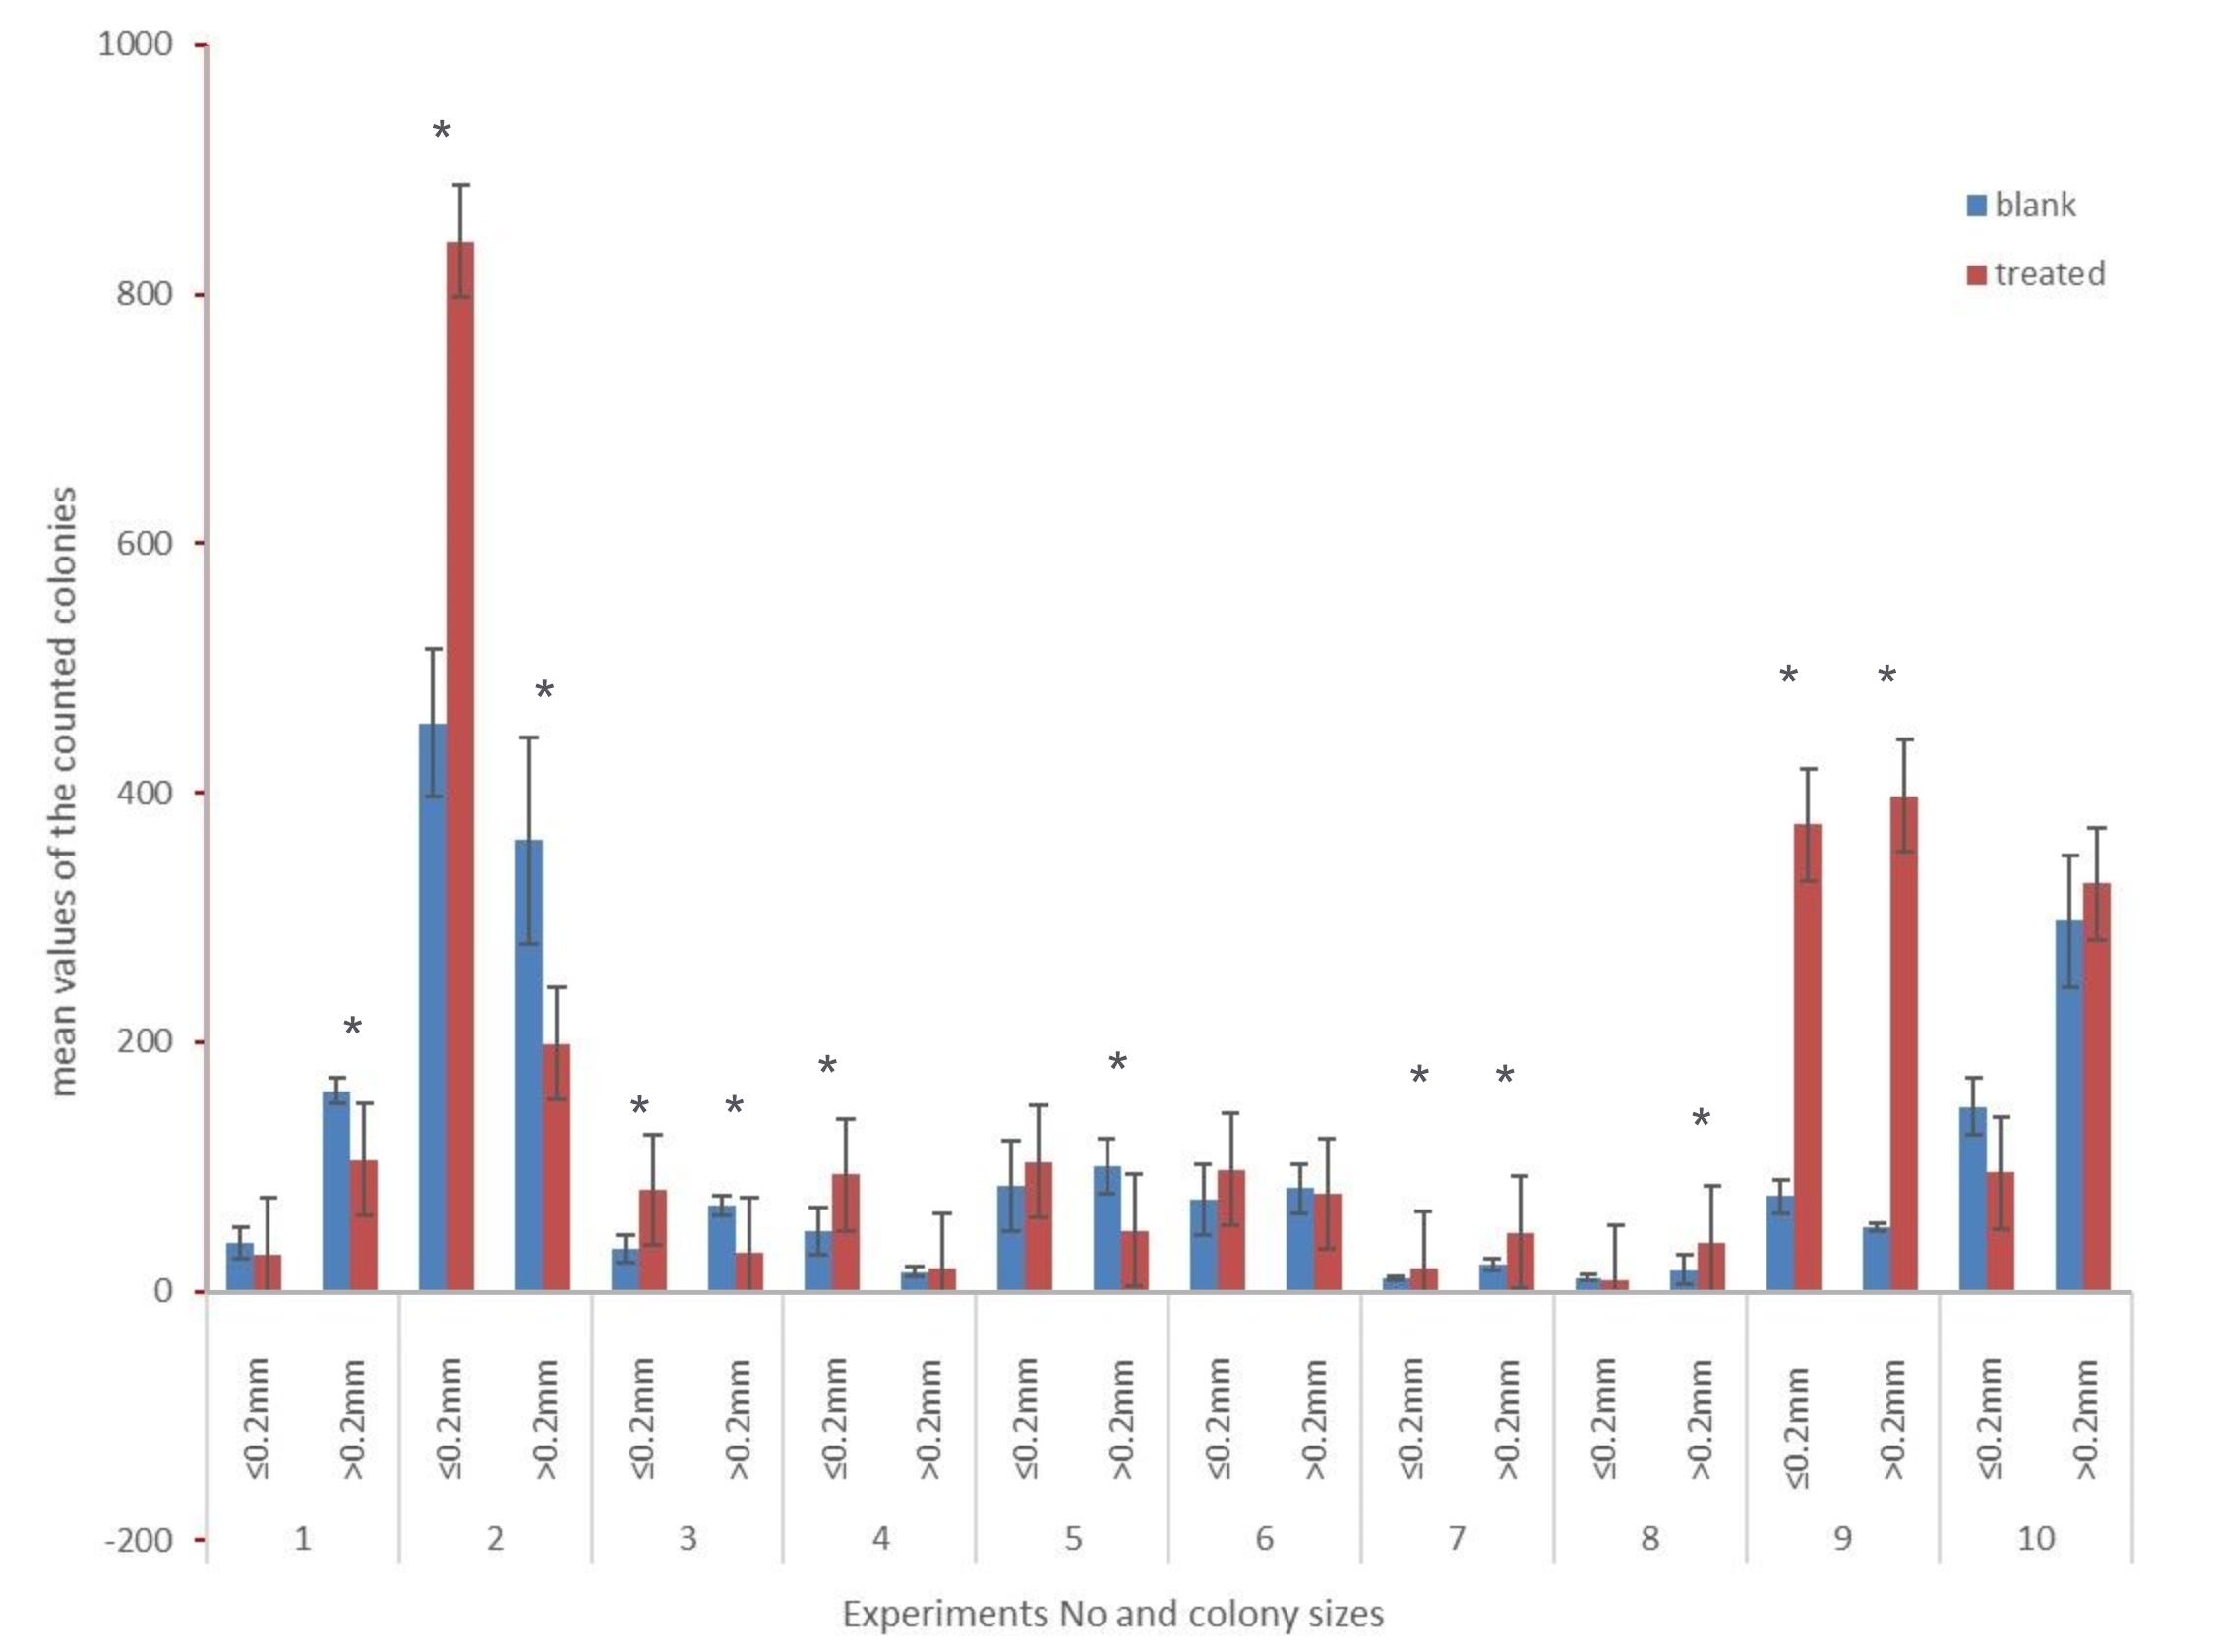
Figure 4. Mean values of the counted colonies after six days of incubation (six plates each for blank and treated samples per experiment; dilution factor 40). * marks the statistically different parameters after the Bonferroni correction (confidence interval 95%).
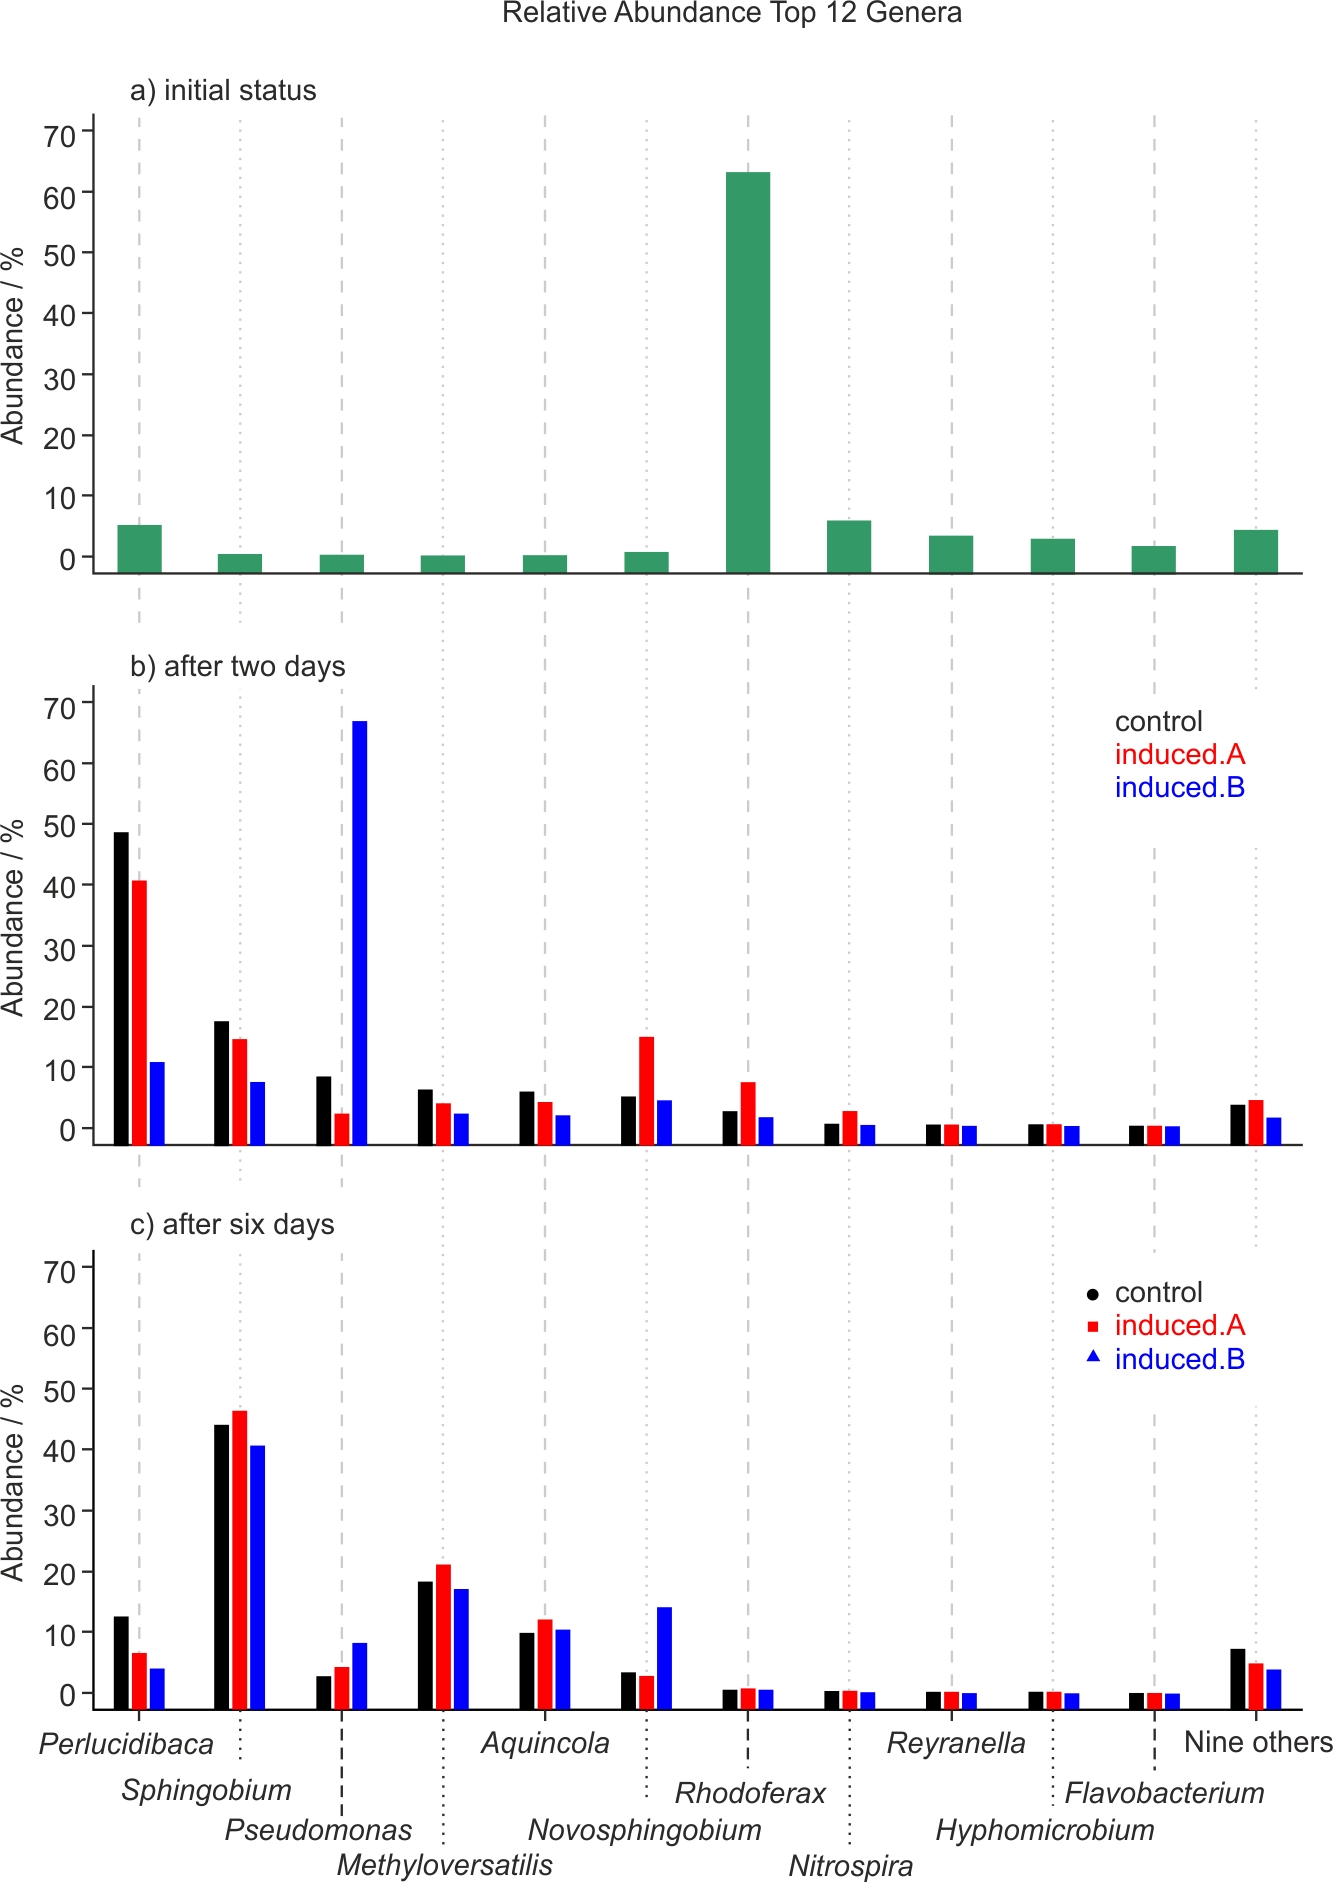
Figure 5. Relative abundance of the top twelve genera discovered in the water samples. Subfigures a, b and c show the development of the microbiome over time. Initial status of microbiome (subfigure a, top), and after two (subfigure b, middle) and six days (subfigure c, bottom).
Paired End Sequencing of the Tab Water Microbiome
NGS was performed for one experiment only because it was not feasible to do NGS analyses of all samples of all experiments. Since NGS analyses result in large amounts of data, only the best hit taxonomic classification data or rather the relative abundance of microbes at the genus level are reported in this work. The complete analysis is available as supplementary data. Here only the 20 most abundant genera are displayed whereby nine genera (with the lowest abundance) are summarized into one data point named “nine others,” resulting in a final number of twelve data points as shown in Fig. 5. Tab. 3 presents the percentage of total reads assigned to a taxonomic unit that is contained in these 20 top genera.
While genera such as mainly Rhodoferax, but also Nitrospira and Reyranella, are initially present in the tap water (see Fig. 5a), these bacteria are not dominant at subsequent time points: After two days, Perlucidibaca and, to a lesser degree, Sphingobium and Pseudomonas seem to dominate (Fig. 5b), while after six days clearly – and uniformly across experiment and control – Sphingobium, followed by Methyloversatilis and Aquincola, contribute to the aquatic microbiome (Fig. 5c). After two days of incubation at room temperature, there is a different relative abundance of Pseudomonas in one of the treated samples (Fig. 5b, Induced.B). This difference from control does not occur in the other treated sample (Induced.A), and after six days all three samples, i.e. the control and the two induced samples display an almost identical microbiome profile (Fig. 5c).
Scanning Electron Microscopy
Fig. 6 shows representative SEM micrographs of the reverse osmosis filter surface after the vacuum filtration of untreated (a) and treated (b) water after two days of incubation. On both images, bacteria (long, oval shaped grey features) are easily recognized. Although neither XRD or EDX analysis could be performed due to the low concentration of specimen of interest, a comparison with the literature allows the likely identification of calcite ([18]; cube in subfigure a) and dried DOLLOPs (ACC) ([23], small balls in the left lower corner of subfigure b). The small grains are most likely previously dissolved salts which precipitated during the drying process of the filter.
Discussion
Effects of the WCM Treatment on the Microbiome
This study was triggered by the question of whether WCM treatment (or magnetic water treatment in general) has an effect on the microbiology of tap water. This question implies that, before starting the investigation, the authors agreed with the very broad definition of the substance “tap water.” the composition of which is, by definition, not precisely defined, but can vary broadly both chemically and microbiologically, since it is mostly defined by what must not be in it rather than what it should contain [59]. It is thus not surprising that in the present study both the chemical (see Fig. 2a and b) and the microbiological (can be deduced from TOC, see Fig. 2c) composition of tap water did vary to some degree over time. Thus, it is to be expected that effects of the treatment will also vary, depending on the initial conditions. Before possible effects are discussed in detail, an overall summary is that the effects of a WCM on the microbiology in tap water are rather small. As should be the case for potable water, there is nary a colony visible after two days (see Fig. 3a and b). It is interesting to note that on some SEM images large DOLLOPs could already be seen after this time (see Fig. 6b). The colonies after six days of incubation are worth a more detailed analysis. The first question is whether there is any significant difference between treated and untreated samples according to statistics. The null hypothesis of this investigation states that there is no effect of the treatment. Since in eight of ten cases there is a significant difference in either the number of large colonies or both small and large colonies, this null hypothesis must be rejected. It should be pointed out here that not all differences are in the same direction, though, and in the following chapter we try to provide possible explanations for this situation.
Let us discuss which results can be expected given what is known from the effects of magnetic treatment and how the bacteria’s ability to form colonies could be influenced by that. It has been shown that magnetic treatment can either decrease the concentration of free Ca2+ or increase it, depending on the presence of microcrystals or other scaling precipitation in the initial tap water. The concentration of free Ca2+, on the other hand, can have an influence on the colony formation of bacteria, as has been shown for Microcystis aeruginosa [35]. Here Ca2+ can promote the quick aggregation of single cells into colonies by forming crosslinks between the negatively charged M. aeruginosa cells. The authors show that concentration changes in the order of mg/L in solutions with Ca2+ concentrations comparable to those in this study (see Fig. 2a) are able to produce significant differences in colony formation. This is possible because all bacterial cell surfaces possess net negative electrostatic charge due to ionized phosphoryl and carboxylate groups present on the outer cell envelope macromolecules [60]. Therefore a “like-likes-like” mechanism is applied here [33], since from a purely electrostatic point of view, the addition of Ca2+ will do the same for all bacteria, albeit to a different degree, since the absolute charge density on bacterial cells does differ, as can be shown by measuring their zeta potential [60]. Consequently, the first effect (electrostatic effect) that is to be expected is, depending on the direction of the Ca2+ concentration change, a higher or lower tendency to form bigger colonies.
The second possible effect is a direct influence of the magnetic field on the metabolic processes of the bacteria. Somewhat similar to the dephasing of proton spin pairs in the mechanism proposed by Coey [21] the so-called radical pair mechanism [61] is arguably the most plausible mechanism by which weak magnetic fields might affect biochemical reactions and thus also microorganisms inside of which they occur. In this mechanism the enzymatic conversion of ADP to ATP is magnetic field dependent [48-51]: The coupling to a magnetic field can flip the electron spins of an intermediate radical pair from a singlet to a triplet state that cannot revert back to the reactants due to spin conservation, thereby increasing the forward reaction rate. In more detail, the first step is an electron transfer from the ADP phosphate to a Mg2+ ion generating an ion-radical pair, Mg+· and an ADP oxyradical [48]. In their work the authors describe the singlet-triplet spin conversion being induced by hyperfine coupling of unpaired electrons with a magnetic 25Mg nucleus. This is the point where magnetism directly influences biochemistry, since the two spin states of the pair, singlet and triplet, contribute differently to the ATP synthesis: the singlet state allows the reverse electron transfer, whereas in the triplet state it is spin forbidden, so the forward reaction forming ATP is favored [49]. An important conclusion from this work is that both the spin conversion of the ion-radical pair and the ratio of singlet/triplet states and therefore ultimately also the yield of ATP can be controlled not only by the internal magnetic field (hyperfine coupling) of a 25Mg nucleus but also by an external magnetic field [49]. It is plausible that this mechanism is even more relevant for an external field with strong gradients acting differently on both spins, thereby changing their relative orientation. Although the authors of the mentioned study [48] applied stronger fields (550 and 800G) than the one used in the present investigation (6 G), they also showed that, when using naturally occurring Mg which only contains about 10% of 25Mg [62], the yield of ATP is not proportional to the field strength but actually drops below the rate without a field at 800G (see [48], table 1). Therefore, it is possible that the fields of the WCM are sufficient to accelerate the ATP production of all species in the treated sample, causing a certain growth boost. We are planning to test this hypothesis with single species experiments and quantitative ATP analysis in the future. A third possible influence relates to both Ca2+ ions and the direct influence of the magnetic field on the bacteria. Liboff [52] suggested that ion-cyclotron resonance, a mechanism based on the influence of the Lorentz force on moving charged particles, can play a role even if the field strengths are very low., like, e.g., the terrestrial field (~0.5G) or, in the present case, a WCM field (~6 G) . An ion in a static and uniform magnetic field moves in circles according to
 (3)
(3)
where z is the number of charges of the ion, e is the elementary charge, m is the mass of the ion and ω is the angular frequency. This relation is well known and applied in cyclotrons and mass spectrometry [63]. Liboff has shown that even the geomagnetic field can accelerate the Ca2+ flux within membrane-bound proteins that constitute the ion channels due to cyclotron resonance. The magnets used in the present experiment are of comparable field strength, so this rationale applies here as well. An accelerated flux of Ca2+ would also increase the metabolism and result in or contribute to a boost in growth. However, in contrast to the above-mentioned effect on ATP production, this effect is likely specific for each type of bacterium since, whereas the production of ATP is a general feature, different bacteria can have cell membranes with different characteristics.
Finally, we have recently found out that similar to what is known already to happen in concrete [64], bacteria native in tap water can actively precipitate calcium carbonate and thus change the concentration of free Ca2+ independently from the magnetic treatment [65]. This discovery also has an impact on the interpretation of the present results, as will be discussed below.
Now let us consider how these four mechanisms will influence colony forming and species distribution (NGS):
• The electrostatic effect will, dependent of the effect on the Ca2+ concentration, either increase the number of large colonies while decreasing the number of smaller colonies or vice versa.
• The radical pair mechanism will result in a general growth boost, thus increase the total number of colonies.
• The ion-cyclotron mechanism will increase the growth of certain bacteria more than of others, thus it could, dependent on the bacteria present, result in a growth boost.
• The biologically triggered CaCO3 precipitation can change the sign of the electrostatic effect by reducing the Ca2+ concentration if it was originally increased due to the Coey-effect.
Any combination of these effects is possible in tap water, and when looking at the results, most of them can be identified. Depending on the initial conditions, these effects influence the results to different degrees. Since the first two effects can be counterproductive concerning the total number of colonies, we decided to divide the colonies in two size groups instead of counting their total number. Let us now describe the effects and their possible combinations:
1. Electrostatic effect only:
a. Ca2+ concentration decrease only (no boost): Here we expect an increase of small colonies and a decrease of larger ones. This is partly true for experiment eight (only the increase of the smaller colonies is significant). Experiment ten does show this trend, but the data are not significant.
b. A Ca2+ concentration increase only (no boost) should lead to an increase of large colonies and a decrease of small ones. This is true for experiments two and three, and partly for experiments one, four, and five (here at least one of the changes matching the prediction is significant).
2. Electrostatic effect and radical pair mechanism:
a. Ca2+ concentration decrease and general boost: Here we expect an increase of both small colonies and larger ones. This is true for experiments seven and nine.
b. Ca2+ concentration increase and general boost: again an increase of both small and larger colonies is expected. This prediction is indistinguishable from prediction 2a and has thus been observed in experiments seven and nine.
These combinations cover all CFU results with significant differences. Whereas from these results alone it is not possible to deduce whether the radical pair mechanism or the ion-cyclotron resonance are responsible for the growth boost, the NGS results indicate that it is more likely the radical pair mechanism, since both treated and untreated samples display a practically identical microbiome profile (Fig. 5c). If the general ATP production boost due to this mechanism occurred all the time, all results should appear similar to those of experiments seven and nine. The fact that they do not points at the possibility that it is actually the ion-cyclotron resonance that creates the growth boost, and that only for certain bacteria that were not present in sufficient quantity in the other experiments – or that the radical pair mechanism is not general after all. The authors plan to do a quantitative NGS analysis and single strain experiments to test these hypotheses.
Finally, the biologically induced CaCO3 precipitation renders any correlation with the direction of the initial physical effect moot, since it can turn a Ca2+ concentration increase into a decrease. The authors are currently investigating the mechanisms and magnetic field dependence of this process [66].
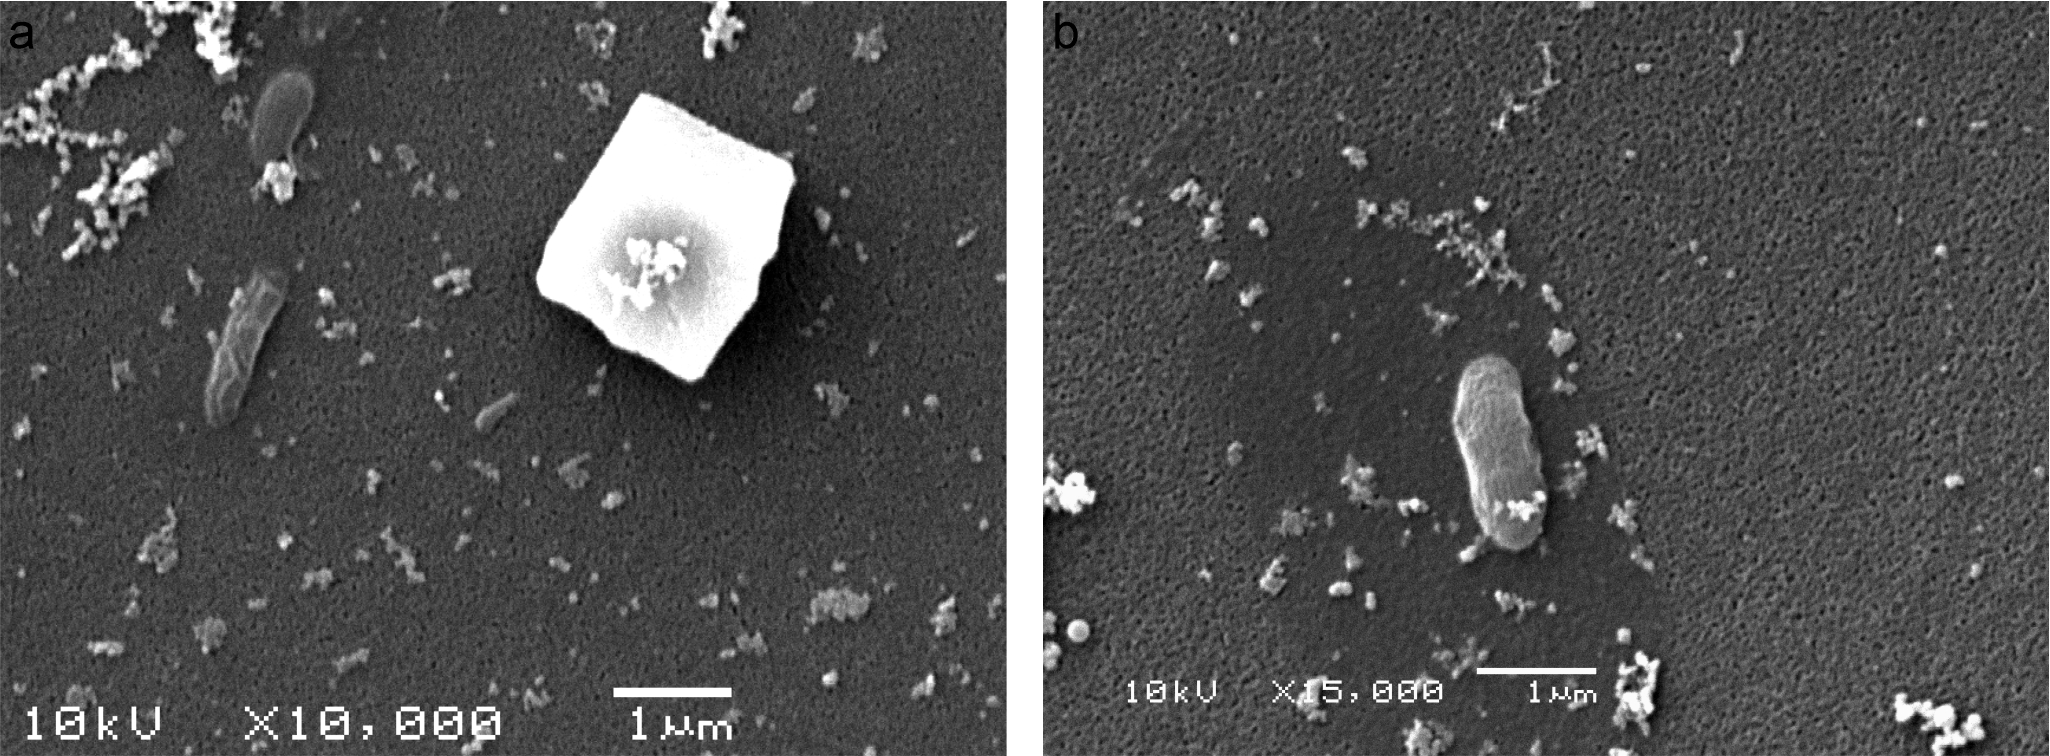
Figure 6. SEM images of reverse osmosis filter surfaces after vacuum filtering of untreated (a) and treated (b) samples after two days of incubation. On both images, grains of precipitated salts (smallest bright features) and bacteria (oval shaped features) can be identified. The cube on subfigure a is probably calcite [18]; the small balls in the bottom left region of subfigure b are probably DOLLOPs [23].
Conclusions
Treating tap water with a water core magnet can have long term effects on the behavior of the aquatic microbiome. A CFU analysis shows no quantifiable difference after two days of treatment, but after six days there is a significant difference concerning CFUs, while an NGS analysis shows that the microbiome profile of treated and untreated samples is identical. These results can be explained by change in cell cohesion due to the change of Ca2+ concentration due to DOLLOP formation in combination with a growth boost either from magnetically enhanced ATP production [48-51] or enhanced Ca2+ transport due to ion-cyclotron resonance [52,63]. With the wide variety of possible chemical and microbiological constituents of tap water [59] and the complex interaction of physical and biochemical processes, a WCM treatment can therefore cause several different effects on the microbiome. As a result of this study, the authors recommend an exact microbiological and chemical analysis of the water to be treated before applying magnetic water treatment devices to determine which long-term effects the use of a magnetic water treatment devices will have.
Acknowledgments
This work was performed in the cooperation framework of Wetsus, European Centre of Excellence for Sustainable Water Technology (www.wetsus.nl). Wetsus is co-funded by the Dutch Ministry of Economic Affairs and Ministry of Infrastructure and Environment, the European Union Regional Development Fund, the Province of Fryslân, and the Northern Netherlands Provinces. The authors like to thank the participants of the research theme “Applied Water Physics” for the fruitful discussions and their financial support, Marianne Heegstra and the Wetsus lab team for the chemical analyses, Jakob Woisetschläger for long and helpful discussions.
Discussion with Reviewers
Static Magnetic fields vs Electromagnetic fields
Your results show effects of magnetic fields on cell colony growth, could you comment on how you expect electromagnetic fields, varying fields and pulsed fields to fare in such experiments – what theories would you expect to be relevant for explaining effects in such cases?
We thank the reviewer for this question, which is a very big question indeed. Depending on strength, frequency and (in-)homogeneity of the applied time-varying fields several effects can take place, starting from induced Lorentz forces, Zeeman effect and singlet/triplet related mechanisms like Coey’s theory or the radical pair mechanisms for (very) low frequencies, and leading to other interactions at higher frequencies (NMR or microwave related phenomena, or pure heating). Pulsed fields, a sum of many frequencies according to the Fourier theorem, will therefore result in combined effects from the suggested mechanisms. These effects, depending on their magnitude, can potentially influence physical, chemical and microbiological parameters of tap water.
Questions for Discussion
1. Why were the water samples left at room temperature for 6 days rather than placed in an incubator at a fixed temperature for 6 days?
The motivation of this study was to mimic normal application of magnetic treatment devices, and these applications rarely happen at fixed temperatures.
2. How might colony size and type of microbe that resulted after 6 days relate to ambient changes, for example, of circadian rhythms of ambient temperature and the geomagnetic field, and other geocosmic factors such as lunar phase? Did you consider any of these other factors?
No, we have not considered any of these influences, since these would be the same for both sample and control. It is of course possible that such influences do play a role in colony forming, but since we concentrated our analysis on the differences between sample and control, we did not pay attention to them.
3. How similar is the microbiome of your starting tap water compared to other tap waters in the world? Is there a literature on tap water microbiomes (yet)? Also, are there any residual chemical preservatives or treatment chemicals in your tap water, added by your municipality, such as chlorine, chloramine, ozone, or other chemicals that may have thwarted or otherwise affected microbial growth, competition, and evolution (over 6 days incubation) in your study? A full report from your municipality on the overall composition and purity of your tap water around the time this study was conducted would be a good addition (citation & reference) to this paper.
Naturally, there is literature on the microbiome of tap water, albeit not very much, and it varies from source to source and time to time. An excellent analysis of the development of the microbiome in a drinking water distribution system is, for example, the work by Boers, S.A., Prest, E.I., Taučer-Kapteijn, M. et al. Monitoring of microbial dynamics in a drinking water distribution system using the culture-free, user-friendly, MYcrobiota platform. Sci Rep 8, 14727 (2018), https://doi.org/10.1038/s41598-018-32987-x . In order to answer the second part of this question, to our knowledge there is no chlorine added to tap water in the Netherlands, and the concentration of other relevant chemical constituents is given in the paper.
4. How are the changes in water microbiome that you observed after 6 days relevant to health if such waters (after 6 days of incubation) were to be consumed by humans? Are there any other implications for health and wellness of your study results?
We honestly cannot comment on that, since this is clearly beyond scope of our work. In general, drinking a six day old water is something we would not recommend, with or without treatment, but this statement is not based on any medical investigation.
5. If you were to conduct a similar study of this type again to explore the water microbiome in response to magnetic field treatment, what, if anything, would you do differently?
This study has been going on for many years, and we are very happy with the present outcome. We would not do anything differently, but we are at the moment working on single species experiments in highly controlled environments in order to test (some of the) hypotheses presented in this work. These experiments would not have been possible without the results of the present work.
Author Contributions
Astrid H. Paulitsch-Fuchs conceived and designed the experiments; Natalia Stanulewicz and Astrid H. Paulitsch-Fuchs performed the experiments; Elmar C. Fuchs, Astrid H. Paulitsch-Fuchs, Bernhard Pollner and Nigel Dyer analysed the data; Astrid H. Paulitsch-Fuchs, Bernhard Pollner and Elmar C. Fuchs wrote the paper.
References
[1] Josh, K.M.; Kamat. P. V. Effect of magnetic field on the physical properties of water, J. Ind. Chem. Soc. (1966), 43, 620-622.
[2] Duffy, E.A., Investigation of Magnetic Water Treatment Devices. Ph.D. dissertation, Clemson University, Clemson, S.C., (1977).
[3] Lin, I.; Yotvat, J. Exposure of irrigation and drinking water to a magnetic field with controlled power and direction, J. Mag. Magn. Mat. (1990) 83, 525-526.
[4] Higashitani, K.; Kage, A.; Katumura, S.; Imai, K.; Hatade, S., Effects of a magnetic field on the formation of CaCO3 particles, J. Colloid Interface Sci. (1993) 156, 90.
[5] Gehr, R.; Zhai, Z. A.; Finch, J. A.; Rao, S. R., Reduction of soluble mineral concentrations in CaSO4 saturated water using a magnetic field, Wat. Res. (1995) 29, 933-940.
[6] Baker, J.S.; Judd, S.J. Magnetic amelioration of scale formation, Wat. Res. (1996) 30, 247-260.
[7] Pach, L.; Duncan, S.; Roy, R.; Komarneni, S. Effects of a magnetic field on the precipitation of calcium carbonate, J. Mat. Sc. Let. (1996), 15, 613-615.
[8] Wang, Y.; Babchin, A.J.; Chernyi, L.T.; Chow, R.S.; Sawatzky, R.P., Rapid onset of calcium carbonate crystallization under the influence of a magnetic field, Wat. Res. (1997), 31, 346-350.
[9] Parsons, S.A.; Wang, B.-L.; Judd, S. J.; Stephenson, T., Magnetic treatment of calcium carbonate scale—effect of pH control, Wat. Res. (1997), 31, 339-342.
[10] Barrett, R.A.; Parsons, S.A. The influence of magnetic fields on calcium carbonate precipitation, Wat. Res. (1998) 32, 609-612.
[11] Colic, M.; Morse, D., The elusive mechanism of the magnetic ‘memory’ of water, Col. Surf. A (1999) 154, 167-174.
[12] Goldsworthy, A.; Whitney, H.; Morris, E., Biological effects of physically conditioned water, Wat. Res. (1999) 33, 1618- 1626.
[13] Coey, J.M.D.; Cass, S. Magnetic water treatment, J. Magn. Mag. Mat. (2000) 209, 71–74.
[14] Holysz, L.; Chibowski, E.; Szczes A., Influence of impurity ions and magnetic field on the properties of freshly precipitated calcium carbonate, Wat. Res. 2003, 37, 3351-3360.
[15] Kobe, S.; Dražic, G.; McGuiness, P.J.; Meden, T.; Sarantopolou, E.; Kollia, Z.; Sefalas, A.C., Control over nanocrystalization in turbulent flow in the presence of magnetic fields, Mater. Sci. Eng. C (2003) 23, 811.
[16] Knez, S.; Pohar, C., The magnetic field influence on the polymorph composition of CaCO3 precipitated from carbonized aqueous solutions, J. Colloid Interface Sci. (2005) 281, 377.
[17] Fathia, A.; Mohamed, T.; Claude, G.; Maurin, G.; Mohamed, B. A., Effect of a magnetic water treatment on homogeneous and heterogeneous precipitation of calcium carbonate, Wat. Res. (2006) 40, 1941-1950.
[18] Li, J.; Liu, J.; Yang, T.; Xiao, C., Quantitative study of the effect of electromagnetic field on scale deposition on nanofiltration membranes via UTDR, Wat. Res. (2007) 41, 4595-4610.
[19] Katsir, Y.; Miller, L.; Aharanov, Y.; Jacob, E.B., The effect of rf-irradiation on electrochemical deposition and its stabilization by nanoparticle doping, J. Electrochem. Soc. (2007), 154, 249-259.
[20] Holysz, L.; Szczes, A.; Chibowski, E., Effects of a static magnetic field on water and electrolyte solutions, J. Col. Interf. Sc. (2007) 316, 996-1002.
[21] Coey, J.M.D., Magnetic water treatment–how might it work?, Phil. Mag. (2012) 92, 3857-3865.
[22] Gebauer, D.; Völkel, A.; Cölfen, H., Stable prenucleation calcium carbonate clusters, Science (2008) 322, 1819.
[23] Pouget, E.M.; Bomans, P.H.H.; Goos, J.A.C.M.; Frederik, P.M.; de With, G.; Sommerdijk, N.A.J.M., The Initial Stages of Template-Controlled CaCO3 Formation Revealed by Cryo-TEM, Science (2009), 323, 1455-1458.
[24] Raiteri, P.; Gale, J.D. Water is the key to nonclassical nucleation of amorphous calcium carbonate, J. Am. Chem. Soc. (2010) 132, 17623.
[25] Gebauer, D.; Cölfen, H., Prenucleation clusters and non-classical nucleation, Nano Today (2011) 6, 564-584.
[26] Wolf, S.E.; Müller, L.; Barrea, R.; Kampf, C.J.; Leiterer, J.; Panne, U.; Hoffmann, T.; Emmerling, F.; Tremel, W., Carbonate-coordinated metal complexes precede the formation of liquid amorphous mineral emulsions of divalent metal carbonates, Nanoscale (2011)3, 1158-1165.
[27] Demichelis, R.; Raiteri, P.; Quigley, J.D.; Gebauer, D., Stable prenucleation mineral clusters are liquid-like ionic polymers, Nat. Comm. (2011)2, 590.
[28] M. Sammer, C. Kamp, A.H. Paulitsch-Fuchs, A.D. Wexler, C.J.N. Buisman, E.C. Fuchs, Strong Gradients in Weak Magnetic Fields Induce DOLLOP Formation in Tap Water, Water (2016) 8, 79
[29] Zunkovic, K.; Diploma thesis, University of Graz, Austria, (2007).
[30] Chen H., Lürling M., Calcium promotes formation of large colonies of the cyanobacterium Microcystis by enhancing cell-adhesion, Harmful Algae (2020) 92, 101768.
[31] Chopra D.P., Sullivan J.K., Reece-Kooyer S., Regulation by calcium of proliferation and morphology of normal human tracheobronchial epithelial cell cultures, J. Cell Sc. (1990) 96, 509-517
[32] Dagert, M.; Ehrlich, S. (1979). Prolonged incubation in calcium chloride improves the competence of Escherichia coli cells, Gene (1979) 6 /1: 23–28.
[33] Ise N., Like likes like: counterion-mediated attraction in macroionic and colloidal interaction, PCCP 12 (2019) 10279–10287.
[34] Feynman R.P., Leighton, R.B., Sands, M., The Feynman lectures on Physics, Vol. I, Millenium edition, Feynman – Leighton – Sands, chapter 2-2
[35] Sato, M., Amano, Y., Machida, M., Imazeki, F., Colony formation of highly dispersed Microcystis aeruginosa by controlling extracellular polysaccharides and calcium ion concentrations in aquatic solution. Limnology (2016) 18/1, 111–119.
[36] Sammer, M.; Diploma thesis, University of Graz, Austria, (2007).
[37] Ji, Y.; Wang, Y.; Sun, J.; Yan, T.; Li, J.; Zhao, T., Yin, X.; Sun, C., Enhancement of biological treatment of wastewater by magnetic field, Biores. Technol. (2010) 101/22, 8535-8540.
[38] Mittenzwey, R.; Süßmuth, R.; Mei, W., Effects of extremely low-frequency electromagnetic fields on bacteria – The question of a co-stressing factor. Bioelectrochemistry Bioenerg. (1996) 40/1:21-27.
[39] Mansouri, A.; Abbes, C.; Landoulsi, A., Combined intervention of static magnetic field and growth rate of Microbacterium maritypicum CB7 for Benzo(a)Pyrene biodegradation., Microb Pathog. (2017) 113, 40-44.
[40] Tessaro, L.W.E.; Murugan, N.J.; Persinger, M.A., Bacterial growth rates are influenced by cellular characteristics of individual species when immersed in electromagnetic fields. Microbiol Res. (2015).172, 26-33.
[41] Filipič, J.; Kraigher, B.; Tepuš, B.; Kokol, V.; Mandic-Mulec, I., Effects of low-density static magnetic fields on the growth and activities of wastewater bacteria Escherichia coli and Pseudomonas putida, Bioresour Technol. (2012) 120,225-232.
[42] Albuquerque, W.W.C.; Costa, R.M.P.B.; de Salazar e Fernandes, T.; Porto, A.L.F., Evidences of the static magnetic field influence on cellular systems, Prog Biophys Mol Biol. (2016) 121/1, 16-28.
[43] Ren, Z.; Leng, X.; Liu, Q., Effect of a static magnetic field on the microscopic characteristics of highly efficient oil-removing bacteria, Water Sci Technol. (2018) 77/2, 296-303.
[44] Xu, Y.B.; Duan, X.J.; Yan, J.N.; Du, Y.Y.; Sun, S.Y., Influence of magnetic field on activity of given anaerobic sludge, Biodegradation. (2009) 20, 875.
[45] Łebkowska, M.; Rutkowska-Narożniak, A.; Pajor, E.; Tabernacka, A.; Załęska-Radziwiłł, M., Impact of a static magnetic field on biodegradation of wastewater compounds and bacteria recombination, Environ Sci Pollut Res. (2018) 25/23, :22571-22583.
[46] Jung, J.; Sanji, B.; Godbole, S.; Sofer, S., Biodegradation of phenol: A comparative study with and without applying magnetic fields, J Chem Technol Biotechnol. (1993) 56, 73-76.
[47] Zhang, J.; Ding, C.; Ren, L.; Zhou, Y.; Shang, P., The effects of static magnetic fields on bone, Prog Biophys Mol Biol. (2014), 114/3, 146-152.
[48] Buchachenko, A.L.; Kouznetsov, D.A.; Orlova, M.A.; Markarian, A.A.; Magnetic isotope effect of magnesium in phosphoglycerate kinase phosphorylation, Proc Natl Acad Sci USA (2005) 102,10793–10796.
[49] Buchachenko, A.L.; Kouznetsov, D.A.; Breslavskaya, N.N.; Orlova, M.A., Magnesium isotope effects in enzymatic phosphorylation, J Phys Chem B (2008) 112, 2548–2556.
[50] Buchachenko, A.L.; Kouznetsov, D.A., Magnetic field affects enzymatic ATP synthesis, J Am Chem Soc (2008) 130, 12868–12869.
[51] Buchachenko, A.L.; Kouznetsov, D.A.; Breslavskaya, N.N., Ion-radical mechanism of enzymatic ATP synthesis: DFT calculations and experimental control, J Phys Chem B (2010) 114,2287–2292.
[52] Liboff, A.R., Geomagnetic cyclotron resonance in living cells, J Biol Phys (1985) 13, 99–102.
[53] Donaldson, J. D., Magnetic treatment of fluids – preventing scale, Finishing (1988) 12, 22-32.
[54] Spear, M. The growing attraction of magnetic treatment, Proc. Eng. (1992) 73, 143.
[55] Busch, K.W.; Busch, M.A.; Parker, D.H.; Darling, R.E.; McAtee, J.L., Jr., Studies of a water treatment device that uses magnetic fields, Corrosion 1986, 42, 211–221.
[56] Y. Hochberg, A sharper Bonferroni procedure for multiple tests of significance, Biometrika (1988) 75 (4) 800-802
[57] W. Hemmerich, StatistikGuru: Rechner zur Adjustierung des α-Niveaus. (2016) Retrieved from https://statistikguru.de/rechner/adjustierung-des-alphaniveaus.html (accessed 21st of August 2020)
[58] MO BIO Laboratories, PowerWater DNA Isolation Kit from MO BIO Laboratories, Inc. DNA quantified with Quantus, Promega Corporation, an affiliate of Promega Benelux BV (2020),
[59] Guidelines for drinking-water quality: fourth edition incorporating the first addendum. Geneva: World Health Organization; 2017. Licence: CC BY-NC-SA 3.0 IGO., ISBN 978-92-4-154995-0
[60] Wilson, W.; Wade, M.M.; Holman, S.C.; Champlin, F.R., Status of methods for assessing bacterial cell surface charge properties based on zeta potential measurements, J. Microbiol. Meth. 43 (2001) 153-164.
[61] Steiner, U.E.; Ulrich, T., Magnetic field effects in chemical kinetics and related phenomena, Chem Rev. (1989) 89,51–147.
[62] Meija, J.; Coplen, T.B.; Berlund, M.;Brand, W.A; De Bievre, P.; Gröning, M.; Holden, N.E.l; Irrgeher, J.; Loss, R.D.; Walczyk, T.; Prohaska, T., Atomic weights of the elements 2013 (IUPAC Technical Report), Pure and Applied Chemistry. (2016) 88/3, 265–91.
[63] Downard, K.; Mass Spectrometry – A Foundation Course. Royal Society of Chemistry; (2004) ISBN 0-85404-609-7:
[64] De Muynck; W., Cox; K., De Belie; N., Verstraete; W., Bacterial carbonate precipitation as an alternative surface treatment for concrete, Construct. Build. Mat. 22 (2008) 875-885.
[65] Liu, X.; Zarfel, G.; van der Weijden, R.; Loiskandl, W.; Bitschnau, B. , Dinkla, I.J.T.; Fuchs, E.C.; Paulitsch-Fuchs, A.H.; submitted (2021)
[66] Liu, X.; Zarfel, G.; Dinkla, I.J.T..; Fuchs, E.C.; Loiskandl, W.; Paulitsch-Fuchs, A.H., in preparation (2021)