
![]()
SPECIAL EDITION
Water Structure
Water as a Microdispersed System. Water “Activation” Mechanism. Water Phases at Room Conditions
Yakhno TA1*, Yakhno VG1,2
1 Federal Research Center Institute of Applied Physics of the Russian Academy of Sciences (IAP RAS), Nizhny Novgorod 603950, Russia
2 N. I. Lobachevsky State University of Nizhny Novgorod (National Research University), Nizhny Novgorod 603950, Russia
*Correspondence: yakhta13@gmail.com (TY); yakhno@appl.sci-nnov.ru (VY); Tel.: (011)-7-831-436-85-80 (TY and VY)
Keywords: water under optical microscope, water “activation” mechanism, water phases at room conditions
• Received: July 10, 2021
• Revised: October 27, 2021
• Accepted: November 15, 2021
• Published: Month XX, 2022
Abstract
The review provides evidence that water of any degree of purification is a microdispersed system. The dispersed phase (DP) of liquid water is represented by hydrophilic particles (mainly NaCl microcrystals) covered with a liquid crystalline hydration shell. The size of DP particles, visible through an optical microscope, is a few microns. DP is prone to aggregation and forms large associates (tens to hundreds of microns in diameter) floating in continual bulk water. Water activation by any kind of physical impact is accompanied by the disaggregation of associates and an increase in the total area of the interphase surface. This naturally changes a number of physicochemical parameters of the system (pH, Redox Potential, viscosity, electrical conductivity). The effect was described many times in the literature, but had no scientific explanation within the framework of the classical theory of water structurization at the molecular level. From this point of view, the method of manual stirring of different hydrophilic surfaces with water is also considered. Based on the portrait similarity of the physicochemical properties of structured near-wall water with polywater described by Lippincott et al in 1969, the authors believe that under room conditions there are only two phases of water – continuous and polywater.
Highlights:
1. Water is a microdispersed system at any degree of purification.
2. The microdispersed phase is represented by hydrophilic particles (mainly NaCl microcrystals) covered with a liquid crystalline hydration shell.
3. Aggregation – disaggregation of the dispersed phase is accompanied by a change in the area of the interphase surface. This entails a change in the physicochemical state of the system.
4. Under room conditions, there are two phases of water – ordinary continuous water and structured polywater near hydrophilic surfaces.
Introduction
It has long been supposed that purified laboratory water is freed from impurities and becomes just a mixture of H2O molecules capable of combining into one or another molecular cluster with femtosecond relaxation times. This information formed the basis for molecular modeling and explanation of the known thermodynamic anomalies of water [Eisenberg and Kauzmann (1997); Malenkov (2006); Sarkisov (2006); Nilsson and Pettersson (2011); Pang (2014)]. But, three years ago, examining water in a thin layer (~8 µm) under an optical microscope, we were first convinced that at any degree of purification it is a suspension of microparticles in continuous water [Yakhno and Yakhno (2019a)]. This fact made an indelible impression on us, and we began to look for references to the inhomogeneity of water at the micro level in other sources available to us. First of all, we drew attention to work by Ito et al. (1994), where the authors investigated the behavior of suspensions of fluorescent polystyrene microparticles (d = 1 µm, C = 0.2% in highly purified water) for several hours using a confocal laser scanning microscope. They discovered the appearance and growth of “voids” within the colloidal phase. According to Ise (2010) this is the attraction initiated by counterions between like-charged particles. Moreover, the ability to move a particle forcibly placed in the resulting voids was severely limited in comparison with particles located in adjacent areas with a high packing density [Yoshida et al., (1995)]. This suggested that these “voids” were filled with a water phase with a higher viscosity. The addition of salt to the solution reduced the distance between colloidal particles, but after reaching a certain limit, the formed “colloidal crystal” melted. Yinnon and Yinnon (2009) experimentally observed aggregates in under-saturated aqueous solutions. Aggregates studied include: 0.5 to 6 micrometer-sized domains composed of solvated strong electrolyte ions, organic- or bio-molecules; clusters of up to 280 water molecules. Several years earlier, the results were published [Del Giudice et al., 2000] that ions dissolved in water are not in a gaseous state, but settle in a coherent configuration, where they perform plasma oscillations in resonance with a coherent electromagnetic field, thus providing a satisfactory understanding of the thermodynamics of electrolytes.
In the works of Bukaty and Nesteruk (2011), and Bukaty and Nesteruk (2012), the results of experiments on determining the size distribution of optical inhomogeneities (clusters) in bidistilled water by the method of small-angle light scattering are presented. The measurements showed the presence in water of a spectrum of clusters with sizes in the range (1.5 – 6.0) µm, while the arithmetic mean radius was 2.3 µm and the root-mean-square radius was 2.5 µm. However, the authors did not report anything about the nature of these clusters. At the same time, the existence in the water of giant clusters with sizes from 10 to hundreds of microns was proved by means of IR spectroscopy [Fesenko and Terpugov (1999)], laser interferometry and small-angle light scattering [Sedlák (2006); Goncharuk et al., (2007); Bunkin et al., (2013)], dielectrometry and resonance method [Laptev et al., (2013)]. The report of Smirnov (2010) says: “Supramolecular complexes are formed by hundreds of thousands of water molecules grouped around hydrogen and hydroxyl ions in the form of ion pairs. For these supramolecular complexes, we suggest the name ‘emulons’ to emphasize their similarity to the particles that form the emulsion. The complexes consist of individual fractions with sizes from 1 to 100 microns, and the fractions with sizes of 30, 70 and 100 microns are much larger than the others” (see also Web ref, 1). According to the authors [Goncharuk et al., (2007); Goncharuk et al., (2015)], the size of giant water clusters depends on the content of deuterium in water, which forms a spatial HDO network in water, in each cell of which a giant H2O cluster is formed. The more deuterium, the smaller the network and the smaller the size of the water clusters. In recent years, within the framework of quantum electrodynamics, theoretical concepts of the formation of coherent water structures (coherent domains, CD) under the action of external electromagnetic fields have been actively developed [Preparata et al (2000); Marchettini et al (2010); Del Giudice et al (2013) De Ninno et al. (2014);. Yinnon and Liu (2015); Messori (2019)]. These concepts open up broad prospects for the study of remote communications between the external environment and various aqueous dispersions, but they require serious experimental confirmation. Here we will describe only what is visible under an ordinary optical microscope and, based on this, we will build our own logic of understanding the structure of water at the micro level.
Water Structure at Micro Level
The studies were performed under a Levenhuk microscope with a video camera coupled to a computer using the ToupView program. In the work, the microscope slides and cover glasses of ApexLab (Russia) production were used, with dimensions (25.4 mm × 72.2 mm × 1 mm) and (24 mm × 24 mm × 0.6 mm), respectively, Petri dishes d = 35 mm (polystyrene, sterile, MiniMed, Russia). Samples of liquids in the form of droplets in a volume of 5 μL with a Sartorius microdoser (Biohit) were applied to the substrates and covered with a coverslip. The thickness of the water film in the preparations was evaluated to be ~8 μm using geometry rules. The experimental conditions are described in more detail in the work [Yakhno and Yakhno (2019a)]. Figure 1 shows a typical picture of the microstructure of water with different degrees of purification. There is no doubt that all samples are structured in the same way.
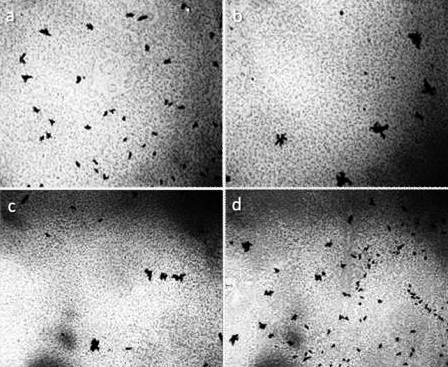
Figure 1. The structure of ultrapure water (a, b) immediately after depressurization of the container is also a microdispersion and fundamentally corresponds to the structure of distilled (c) and mineral (d) water. Black structures are clusters of hydrophobic trace impurities.The width of each frame is 3 mm [Yakhno and Yakhno (2019a)].
In addition, we also looked at water without using any backing or cover glass. Using a micropipette, a hole (pore) in a plastic plate was filled with water, placed under a microscope, and microstructures performing Brownian motion were observed (Figures 2,3).
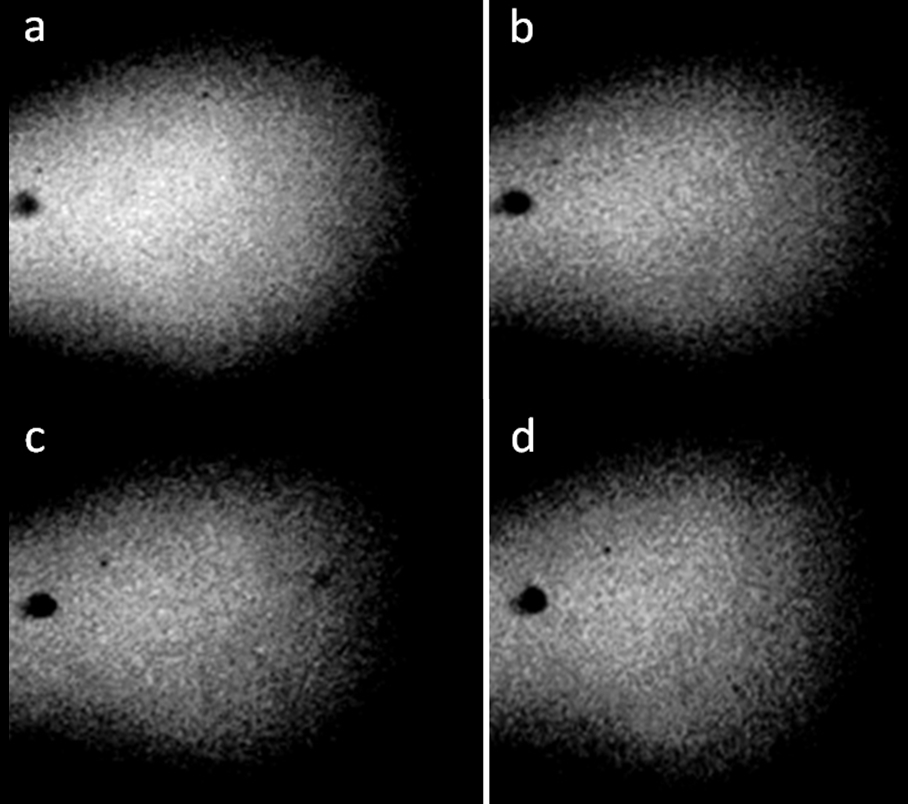
Figure 2. Distilled water in a pore with a diameter of 3 mm and a thickness of 1 mm. a-d: four consecutive photographs. The movement of structures with time is noticeable [Yakhno and Yakhno (2019a)].
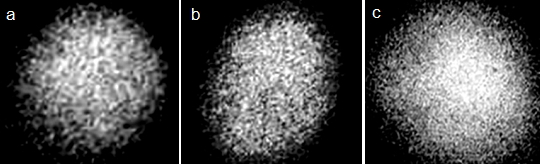
Figure 3. Microstructure of liquids in the “hanging drop” preparation. Liquid placed in a hole in a plastic plate with a diameter of 0.5 mm and 0.5 mm thickness. Microscopy “through liquid” – a: distilled water; b: tap water; c: water of the Black Sea [Yakhno and Yakhno (2019 b)].
After evaporation of equal volumes of water samples presented in Figure 3, it turned out that the mass of the solid sediment corresponds to the proportion a: b: c = 0.2: 0.45: 2.5. In other words, the degree of dispersion of water in the volume turned out to be inversely proportional to the mass of substances dissolved in it. The fact that the dispersed phase of water is not an optical illusion can also be seen by examining the layer of water between the slide and the cover glass during the evaporation of the liquid phase (Figure 4 [Yakhno and Yakhno (2019b]).
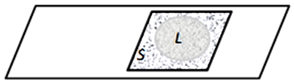
Figure 4. The “crushed drop” preparation is a thin layer of liquid between the slide and the cover glass during the evaporation of the liquid phase of water through the slits between the glasses. Evaporating through the edges of the preparation, the liquid recedes to the center, leaving solid sediment on its way: L – Liquid phase, S – Solid sediment.
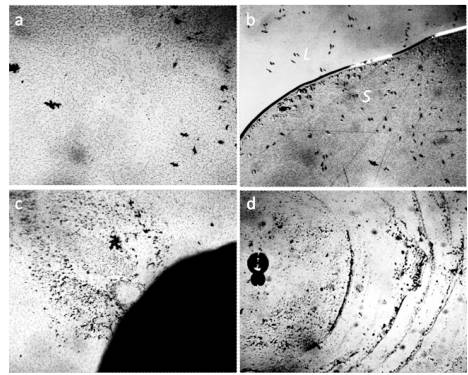
Figure 5. Dispersed phase (DP) of distilled water between the slide and the cover glass – a: in a thin layer of water (8 μm); b: in the process of evaporation of the liquid part of water (L) from the preparation. DP remains on the substrate (S); c: a large DP aggregate formed near the plasticine ball (dark segment on the right) during the evaporation of the liquid phase of water; d: concentric layers of the DP formed around a glass ball, placed between glasses, during evaporation. Microphoto. The width of each frame is 3 mm [Yakhno and Yakhno (2019) c].
The relative mass of the non-evaporating precipitate of distilled water was determined gravimetrically (torsion balance, up to 500 mg) and amounted to ~ 10%.
In the process of studying water and aqueous solutions, we made sure that the presence of a microstructure is an indispensable property of liquid media (Figure 6).
At higher magnification (Figures 7, 8), you can see that the structural unit of the hydrophilic dispersed phase is visible as a regular circle with a dark particle in the center.
Our ideas about the structure and dynamics of changes in the state of aggregation of DP are presented in the diagram (Figure 9).
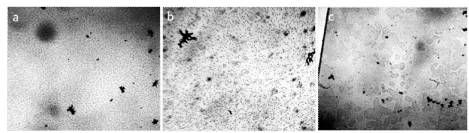
Figure 6. Structure of water and aqueous solutions under an optical microscope – a: distilled water; b: sublimated instant coffee; c: white dry wine. The thickness of the liquid layer, bounded by the substrate and cover glass, is ~8 μm. The width of each frame is 3 mm [Yakhno and Yakhno (2019 a].
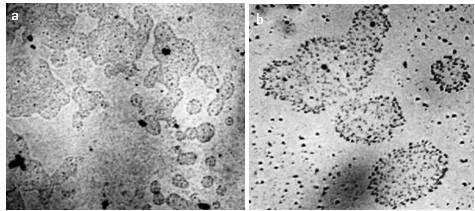
Figure 7. Microstructure of liquids – a: dry white wine “Chardonnay Tamani.” Frame width – 2.4 mm; b: Coacervate structures in the sediment of a 3% aqueous solution of NaCl. The frame width is 1.0 mm [Yakhno and Yakhno (2019 b]].
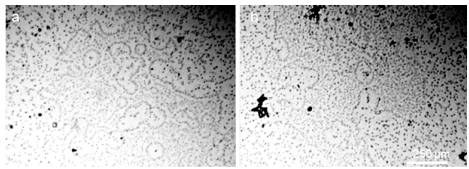
Figure 8. A layer of an aqueous solution of Nescafe Gold freeze-dried coffee (1.25 g / 100 ml) with a thickness of 8 μm between the slide and the cover slip. DP units visible.
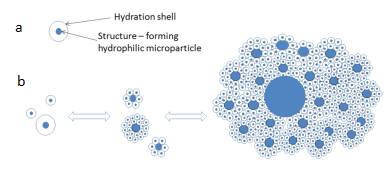
Figure 9. Schematic representation of the structural unit of the microdispersed phase (a) and the formation of aggregates visible through an optical microscope (b).
So, the picture seen through an optical microscope allows us to formulate the following hypothesis. The dispersed phase of water is formed by aggregates of hydrophilic microparticles, each of which is covered with a thick hydration shell. Aggregates are formed according to the fractal principle: small aggregates, meeting a larger hydrophilic particle, interact with it as a whole, forming a larger aggregate. These are natural processes aimed at reducing the free energy of the system. The microdispersed phase in water forms large-scale (hundreds of microns) aggregates in accordance with the Gibbs law – the tendency of the system to decrease its free energy by reducing the total surface area:
σ S → min, (1)
where σ is the specific value of the surface free energy, S is the total surface area of the dispersed phase.
If σ is constant, then processes that reduce the dispersion of the system occur spontaneously. In this case, the total surface (S) decreases and energy is released according to the Gibbs-Helmholtz equation (Grodsky et al., 2013):
Us = σ + qs = σ – T(dσ/dT)p, (2)
Where Us is the total surface energy of the system, σ is the surface tension, qs is the heat of formation per unit surface area.
In lyophilic systems, the energy of coagulation bonds is low (comparable with the energy of Brownian motion kT); therefore, high-energy impacts are not required to disperse the aggregates. The nature of hydrophilic microparticles was discussed by us earlier [Yakhno and Yakhno (2019 a); Yakhno and Yakhno (2019 d)]. According to the results of X-ray analysis, these are NaCl microcrystals. The question is legitimate: where does so much salt come from in distilled water? According to the National Institutions of Health [Laboratory Water. Its Importance and Application (2013)], “Water is easily contaminated by chemical solids, gases, vapors and ions that leach from conduit lines and containers. These may include sodium and silica from glass, plasticizers and ions from piping, microbial species and their endotoxins, as well as particulate contaminants (Millipore, n.d.). Soluble organic contaminants can even be introduced from deionizer resins used in the treatment process, especially if inadequate resins are selected or resins were previously contaminated.” The following are the real disadvantages of each water purification method: distillation, filtration and ultrafiltration, reverse osmosis and deionization. None of the water treatment methods are perfect. In particular, deionized water is often referred to as “hungry water,” which is easily contaminated and can corrode many materials. Even electrodeionization does not remove organics, particles, pyrogens, and bacteria, although water may be less susceptible to microbial contamination than ion exchange resin layers. In [Karakashev et al., (2019)], data are given that the control parameters of “pure” (distilled, double and triple distilled, deionized) water are determined by manufacturers in closed vessels, prior to its contact with air. Immediately after removing the water from the container and contacting with air, in less than a minute, it turns into a weak solution of carbonic acid due to the rapid dissolution of carbon dioxide in it. According to SIMS data [Yakhno et al., 2019 d], a dried drop of deionized water on a sterile silicone substrate showed a high content of sodium, chlorine, sulfur, and carbon ions. Most likely, these pollutants come from the surrounding air environment, since sulfur and carbon are part of soot, and, along with sodium chloride, make up the bulk of industrial emissions. Moreover, according to NASA, sea salt and dust are two of the most abundant aerosols [Web ref. 2]. Wind-driven spray from ocean waves flings sea salt aloft. NaCl constitutes 78% (w) of the dissolved solids in seawater [Murayama et al., (1996)]. Other studies [Murayama et al., (1997); Murayama et al (1999); Liu et al., (2012)] have shown that the directly observed total depolarization ratio suddenly increased in the afternoon when the sea breeze became dominant and decreased rapidly in the evening. It was also shown that nonspherical particles, dust and crystallized sea-salt particles diffused in the troposphere. The calculations showed that the diameter of crystallized NaCl particles was larger than 1 µm. Thus, we believe that these particles can serve as primers for the condensation of atmospheric moisture forming hydration shells. This is a possible way for the formation of hydrated salt microcrystals in the atmosphere. These microcrystals fall into the lower layers of the troposphere, become part of other aerosol pollution, and enter the water again, starting a new turnover cycle of salt in nature. In this regard, an interesting fact is that freshly melted snow has the structure of a colloidal crystal formed by a microdispersed phase (Figure 10). After the melted snow has dried in the open air, salt crystals are visible at the edges of the former puddle (Figure 11).
Regarding the hydration shell of DP elements, we believe that it has a liquid crystal structure similar to that of EZ [Zheng at all (2006); Pollack (2013); Zhang (2015)]. Next, we will return to this issue and confirm our opinion. When smears of the studied liquids are made, the DP aggregates remain on the glass substrate (Figure 12).
DP aggregates are plastic, easily deformed, do not evaporate at room temperature and do not dissolve in organic solvents (hexane, ether, toluene). Under the action of salt, the structures begin “to melt” (Figure 13).
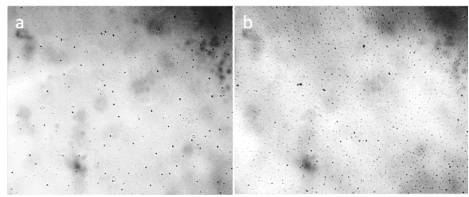
Figure 10. Freshly melted snow between the slide and the cover glass (the thickness of the liquid layer is 8 µm). a, b: different fields of view. The width of each frame is 3 mm.
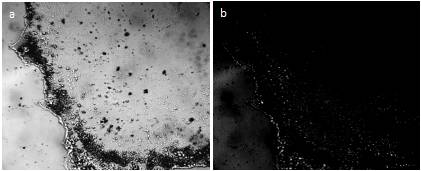
Figure 11. Sediment on the glass bottom 3 days after evaporation of melted snow – a: crystal structures at the border of evaporated volume of snow water; b: the same picture in polarized light. The width of each frame is 3 mm.
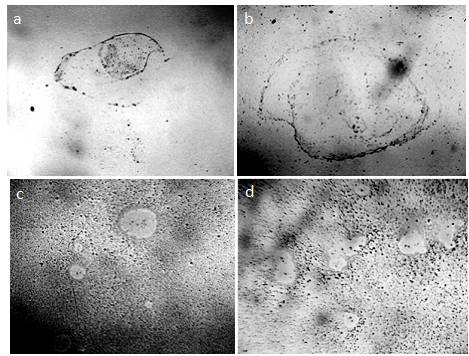
Figure 12. Fragments of dried smears of the studied liquids – a: distilled water; b: dry white wine; c, d: an aqueous solution of Nescafe Gold freeze-dried coffee [Yakhno and Yakhno (2019 b)]. DP aggregates are visible.
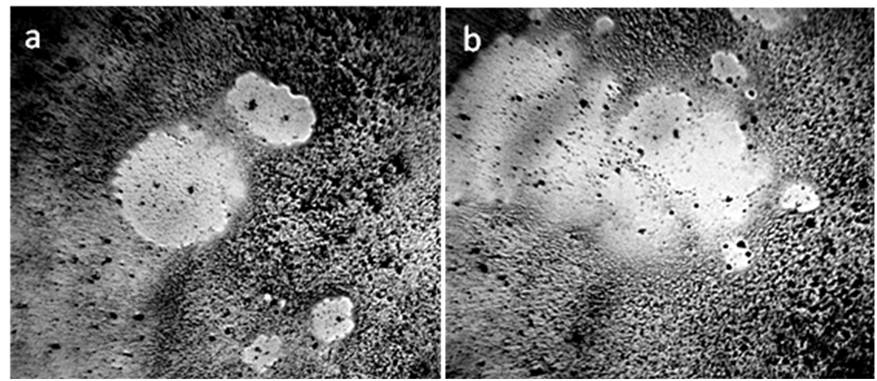
Figure 13. Strokes. DP water aggregates from coffee solution after adding NaCl (4 g / 100 ml) to it. The process of destruction (melting) of hydration shells. a, b: different fields of view. The width of each frame is 3 mm [Yakhno and Yakhno (2019 b)].
The fact that an increase in NaCl concentration destroys the EZ structure was also reported by the authors of the publication [Zhang et al., (2015)]. This fact confirms the common nature of the dispersed phase of water and EZ.
According to the results of gas chromatography-mass spectrometric analysis of a sample of dried coffee for water content, in the temperature range 200-300° C, the amount of water released from the analyzed sample increases abruptly, which may be associated with the destruction of the polymer structure of hydration shells [Yakhno et al (2017)] (Figure 14, Table 1.).
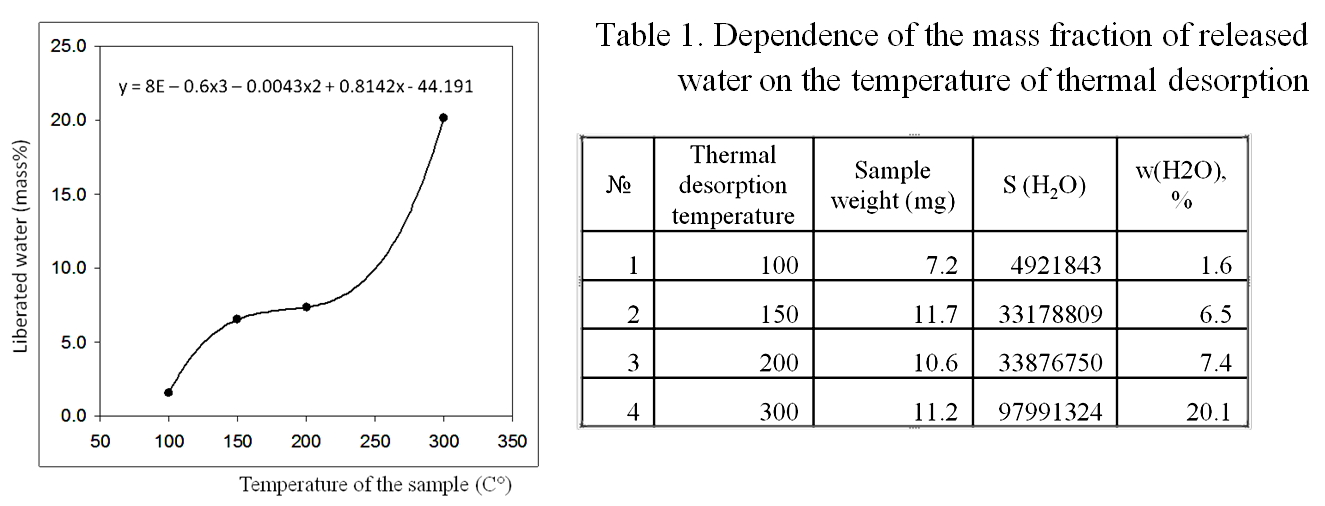
Figure 14. Results of gas chromatography-mass spectrometric analysis of a sample of dried coffee for water content. A sharp increase in water evaporation occurs in the range of 200-300° C, which may be associated with the destruction of the polymer structure of hydrated water.
Dispersion as a Thermodynamic Parameter of the System. Water Activation
Let’s go back to Figure 9, which shows the aggregation – disaggregation scheme of the dispersed phase. This is a real mechanism for controlling the physicochemical properties of liquid media, which was previously considered inapplicable to “pure” water. According to Borilo [Borilo (2012), p. 18], “Dispersion (or specific surface area) is an independent thermodynamic parameter of the state of the system, a change which causes corresponding changes in other equilibrium properties of the system. Dispersion acts as an intense feature of the system. This value can be compared with concentration, that is, with the amount of surface per unit volume. Thus, the surface acts as a separate component. In this case, you can draw an analogy with temperature or pressure. Preliminary consideration shows that dispersion is an independent and full-fledged thermodynamic parameter of the system. … Thus, the surface tension is a partial derivative of any thermodynamic potential with respect to the interfacial area at constant corresponding parameters.”
The author’s reasoning follows:
“The factor of the surface energy intensity is the surface tension caused by the uncompensated field of intermolecular forces at the interface. For a heterogeneous system, relative to the change in the internal energy Ur, can be written as:
![]()
(3)
If S, V, ni and q are constant, then
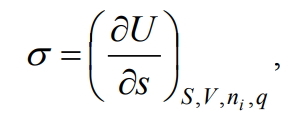
(4)
That is, surface tension is a partial derivative of the internal energy with respect to the area of the interface at constant entropy, volume, number of moles of components and charge. The latter can be written with respect to other thermodynamic potentials, namely the Gibbs energy G, the Helmholtz energy F and the enthalpy H, then with the corresponding constant parameters we get:
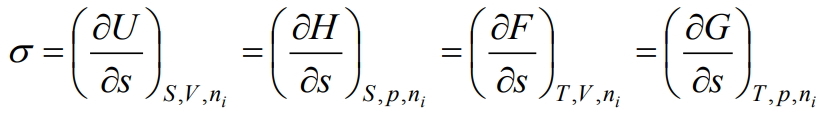
(5)
Thus, surface tension is a partial derivative of any thermodynamic potential with respect to the interfacial area at constant corresponding parameters. Noteworthy is the fact that the thermodynamic determination of the surface tension is similar to the determination of the chemical potential, only the surface tension characterizes the interfacial surface, and the chemical potential characterizes the solute. Both quantities are partial derivatives of any thermodynamic potential, but in one case – by the surface area, in the other – by the number of moles of the substance” [Borilo (2012), p. 25]. The above reasoning of the author refers to thin films. But we believe that it is quite possible to extend them to microdispersed systems, which, as it turned out, includes water.
A review of the available literature on the results of the impact on water of various disturbing factors of a physical nature allows us to conclude that they all lead to the same consequences – an increase in pH, a decrease in Redox potential, an increase in electrical conductivity, and a decrease in viscosity. All this together increases the bioavailability of water for plants and animals. Let us illustrate this with specific examples.
In [Gulyaev et al (2005)], bidistilled water was exposed to strong spatially inhomogeneous electromagnetic fields. As a result, it became a better solvent than distilled water, while having a lower viscosity, lower surface tension and a higher wetting coefficient. It was shown that such modified water acquired increased biological activity. The authors associate the mechanism of these changes with additional dissociation of water molecules and the formation of positive protonophilic H+ (H2O)p and negative oxydrilophilic OH– (H2O)n cluster ions. Fundamentally the same changes (an increase in pH, a decrease in Redox potential, and an increase in electrical conductivity) occur in water after cavitation exposure [Kulagina et al., (2014)]. It is shown that after treatment the activated water does not return to its original state in all measured parameters for 200 min. In [Chirkova and Stas (2014)], an assessment was made about changes in the physicochemical properties of deionized water as a result of electromagnetic exposure and various methods of degassing. It was found that any method of exposure to deionized water leads to an increase in its electrical conductivity and pH, as well as a decrease in Redox potential. Degassing by evacuation and blowing with an inert gas leads to practically the same result. The change in the properties of water was most pronounced as a result of exposure to a high-frequency electromagnetic field. The study of the influence of physical fields on the physicochemical properties of water has been carried out [Musienko et al. (2014)]. The influence of He-Ne laser radiation, constant magnetic field and ultrasonic radiation on the pH value and the specific electrical conductivity of tap water has been investigated. There was a slight increase in pH for all 3 types of physical impact on water (3.8% -5.8%). Ultrasonic action exerted the greatest influence on water pH [Musienko et al. (2014)]. The increase in the pH of the control water sample, according to the authors, is associated with water degassing over time. Upon laser irradiation, the specific electrical conductivity of water increased by 21%. The electrical conductivity of water under the influence of ultrasonic radiation increased significantly (by 46%). Under the influence of a magnetic field, the electrical conductivity of water changed slightly (4%). It was found [Anosov and Trukhan (2012)] that water, preliminarily activated by a magnetic vector potential, changes the mobility of the infusoria introduced into it, the rate of sugar fermentation by yeast, and the preferred consumption by mice. The change in some physical parameters after the activation of water is also shown: the UV absorption spectrum and the state of the presence of silica in water. It has been suggested that water is the primary target under the influence of many weak electromagnetic fields on biological objects.
In our work [Yakhno et al. (2015)], a study was carried out about the effect of the hydropercussion – cavitation action (GKV) on tap water. The setup was a tabletop apparatus consisting of a rotor-stator module made of stainless steel, fixed on a tripod and immersed in a plastic vessel. The treated volume of water was five liters. When connected to the network (220 V), the rotor began to rotate at a frequency of 2750 rpm. After processing the water, its temperature slightly exceeded the temperature of the control sample. This difference ranged from 0.2°C to 2.0°C in different experiments. In this case, a vortex funnel was created in the vessel. After treating the water for an hour, significant changes in its physical and chemical parameters were noted: an increase in pH by 14%, an increase in specific electrical conductivity by 5.6%, an increase in the speed of sound by 0.3%, and a decrease in surface tension by 17%. Boiling tap water led to changes in these indicators of approximately the same magnitude and direction. At that time (six years ago) we knew nothing about the existence of the microstructure of water, and the question “Where do the protons go?” [Yakhno et al. (2015)] did not receive an intelligible answer. Interestingly, at the beginning of the 20th century, the Austrian naturalist Victor Schauberger invented a way to turn ordinary water into “living” by swirling it; another Austrian – Rudolf Steiner – invented the “biodynamic farming technique” based on the swirling of water flow. “The yield increased enormously without the use of fertilizers’’ [Pollack (2013), p. 179]. The phenomenon had no scientific explanation. We conducted a small experiment on swirling water using the IKEA Product, milk frother. Bottled natural water, “Aquanica,’’ with a total mineralization of 200-500 mg / l was used. The pH and Redox potential were measured before and after 10 minutes of exposure to the foaming agent on water, as well as one, two and three hours after exposure. The microstructure of water was monitored under a Levenhuk microscope with a Levenhuk C1400NG video camera coupled to a computer [Yakhno and Yakhno (2020)]. Whipping water for ten minutes with a rotating whisk resulted in a 4% increase in pH and an 8% decrease in Redox potential (Figure 15). The changes persisted during the observation time (three hours). The microscopic picture of water before and after exposure is shown in Figure 16.
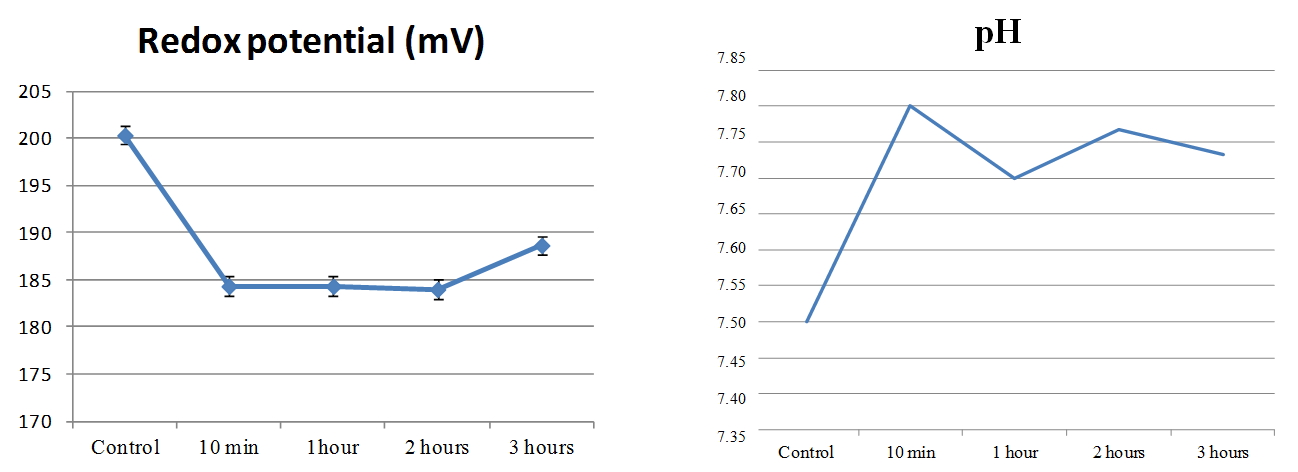
Figure 15. Change in Redox potential (left) and pH (right) of natural water, “Aquanica,” after 10-minute operation of the foamer [Yakhno and Yakhno (2020)].
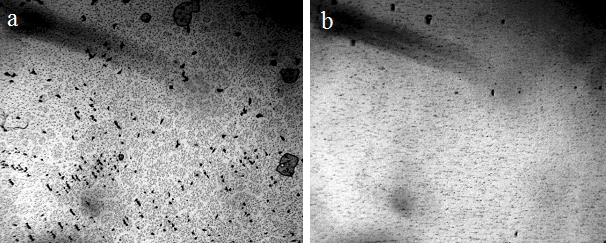
Figure 16. Microstructure of mineral water, “Aquanika,” in a thin layer (~8 microns) between the slide and the cover glass – a: control; b: 2 hours after operation of the foamer for 10 minutes. The width of each frame is 3 mm [Yakhno and Yakhno (2020 a)].
The destruction of water units by mechanical action does not raise questions. It turned out that low-intensity light also leads to the dissociation of the microdispersed phase of water. Figure 17 shows the result of irradiating water with a 20 mW green LED laser for 10 minutes. Natural mineral drinking water, “Serafimov Dar,’’ was used in the experiment. Water was poured into a 100 ml glass beaker; the light source was placed vertically directly above the water surface in the central zone equidistant from the glass walls. In this case, a decrease in the electrical capacity of the liquid by ~1 pF was also noted [Yakhno et al., (2018)]. The microdispersed phase of water was examined under a microscope before and after irradiation (Figure 17).
Earlier, we showed that the procedure of boiling water is accompanied by the same qualitative changes in its physicochemical properties as the hydropercussion-cavitation effect on it for 1.5 hours: degassing, an increase in pH, electrical conductivity and ultrasound speed [Yakhno et al (2015)]. This procedure is also accompanied by disordering of DP water aggregates (Figure 18).
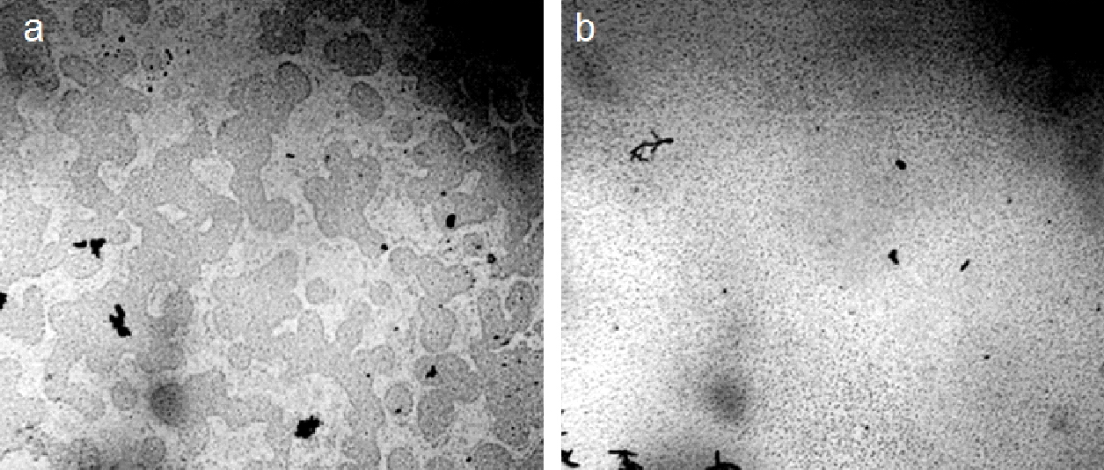
Figure 17. Microstructure of natural mineral drinking water, “Serafimov Dar.” Microscopy of a ~16 µm thick liquid layer before (a) and after (b) irradiation of a glass with water with a 20 mW green laser for 10 minutes.
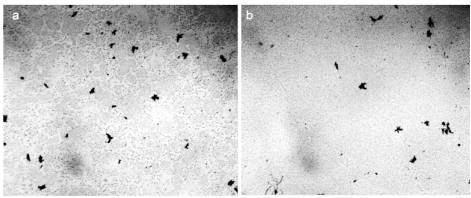
Figure 18. Microscopy of distilled water between the microscope and cover slip. The thickness of the water layer is 16 microns, the width of each frame is 3 mm – a: original sample before boiling; b: water after heating to a boil in a microwave oven and then cooling to room temperature.
The observed changes relax over time (days). We believe that the change in a number of physical indicators given in this work is a consequence of the energy impact on water, accompanied by degassing and destruction of its micro-aggregate structure – an increase in the area of the interface between free and bound water. Since the EZ surface carries a negative potential, the number of “seats” for protons (hydronium ions) in the liquid significantly increases, which leads to alkalization of the solution.
It was interesting to see how matters stand with melt water, which is recommended by some as part of a healthy diet. Some doctors claim that fresh melt water helps to accelerate recovery processes, increase the body’s resistance to infections, reduce the sensitivity of the mucous membranes, and normalize the tone of the bronchial muscles [Web ref. 3]. We looked at the microstructure of tap water before and after freezing – thawing (Figure 19). It turned out that it loses part of the microdispersed phase, which is dispersed from the main volume during defrosting in the form of loose flakes.
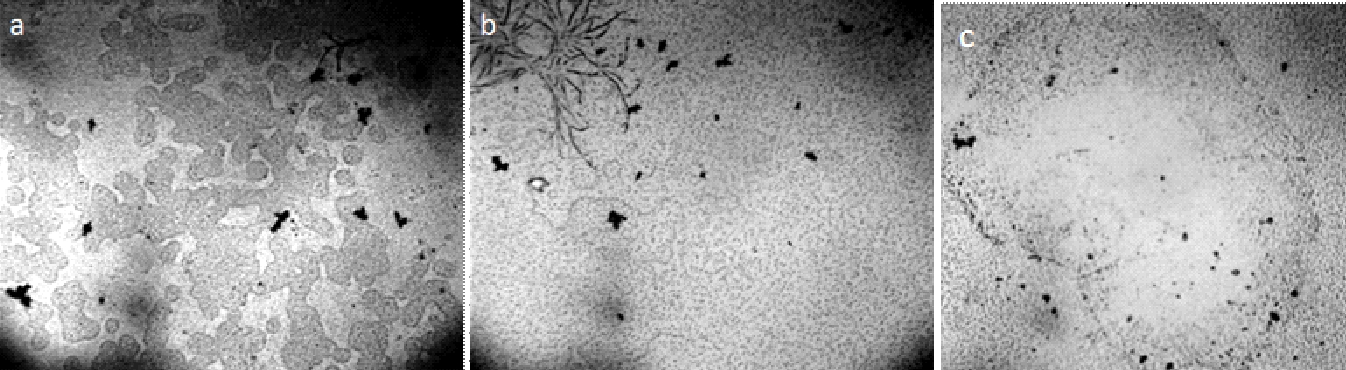
Figure 19. Microscopy of a thin layer (~8 µm) of distilled water before freezing (a) and after freezing – thawing (b); c: clot of dispersed phase in thawed water. The width of each frame is 3 mm.
In the introductory part of [Maestro et al., (2016)], literature data are collected that when water is heated in the range of 50° – 60°C, a number of its physical characteristics change naturally: thermal conductivity, refractive index, electrical conductivity, surface tension, piezo-optical coefficient. In our opinion, this may be a consequence of the downsizing of aggregates of the microdispersed phase and its transition to a finely dispersed state. The same mechanism works with other various methods of influencing water. Earlier, we revealed slow fluctuations in a number of hydrodispersions (tea, coffee, dry red wine, blood serum) associated with periodic aggregation – disaggregation of DP [Yakhno and Sanin (2015); Yakhno and Yakhno (2016); Yakhno and Yakhno (2017 a); Yakhno and Yakhno (2017 b); Yakhno and Yakhno (2017 c); Yakhno et al., (2017); Yakhno (2011)]. The fluctuation parameters (amplitude and phase) unambiguously depended on the DP concentration in the liquid. At the same time, a number of independently recorded indicators fluctuated synchronously: integral mechanical properties of liquids, surface tension, and width of the edge ridge in drops dried on glass. The fluctuation parameters did not depend on external electromagnetic fields, the shape of the vessel, and direct contact with air. When a surfactant was added to the medium under study, the amplitude of the oscillations sharply decreased. A model of self-oscillations was built, associated with a periodic change in the osmotic pressure in the surrounding fluid due to partial destruction and subsequent restoration of the integrity of the hydration shells of DP [Yakhno and Yakhno (2017 c); Yakhno and Yakhno (2020 b)]. As is known, osmotic pressure is also generated at hydrophilic surfaces without any solute [Zheng (2006); Pollack (2013); Chaplin (2012)].
So, literature data and our own experiments lead to the conclusion that “water activation” occurs not at the molecular, but at the micro level, regardless of the nature of the disturbing factor, and is associated with the downsizing of DP aggregates – an increase in the interfacial area.
About Stable Water Structures at Standard Pressure and Temperature That were Obtained by Manual Stirring of Hydrophilic Surfaces with Water
In the last decade, a number of publications have appeared on a new method for obtaining solid-state water by prolonged contact of liquid water with hydrophilic surfaces [Elia et al., (2013 a); Elia et al., (2013 b); Elia et al., (2014); Elia et al., (2015); Elia et al., (2017); Yinnon et al., (2016); Elia et al., (2019); Elia et al., (2020)] and subsequent lyophilization of the used water. The principle of the method described in [Elia et al., (2013 a)] is as follows. “Nafion membranes having a surface of 60-120 cm2 and a thickness of 50-180 μm, were initially washed 5 times using 20 ml of Milli-Q water. Then, the membrane was placed in an open Petri dish (made either of Pyrex glass or Polystyrene) in contact with 10-20 ml of Milli-Q water (Specific electrical conductivity χ = 1-2 μS cm-1), manual stirring was performed repeatedly to allow 2-3 mm of liquid to lap against the membrane. Then the conductivity was measured and the procedure was repeated turning over the membrane. The procedure was repeated manually some tens of times, producing an increase of conductivity after each step. After some hours the membrane was removed from the Petri dish and allowed to dry in air for several hours, then it was again placed in the previously used water and the whole procedure was repeated again. In order to obtain a significant increase in conductivity (up to 100-300 μS cm-1) the procedure was repeated from 10 to 20 times, the kinetic being quite variable from time to time. It has also been observed that the volume of the treated water had an influence on the increase of the conductivity in the sense of a higher increase for smaller volumes” [Elia et al., (2013 a)]. Changes in the parameters of the same direction also occurred if instead of Nafion they used cellophane, cotton wool or paper filter [Elia et al., (2019), Elia et al.,(2020)]. In our opinion, these changes are fully consistent with the changes described in the previous chapter, and are obviously associated with the downsizing of the DP of water and an increase in the interfacial area. In this case, a certain additional contribution can be made by micro-fragments of hydrophilic substrates, which are separated as a result of friction against water and enter the total volume. These microfragments, by definition, must be coated with EZ. Further, in accordance with the methodology, the water remaining after repeated iterations of the hydrophilic surface is subjected to lyophilization (freezing and drying under vacuum). After that, a solid sediment remains (Figure 20, a, b; Figure 21, a – d).
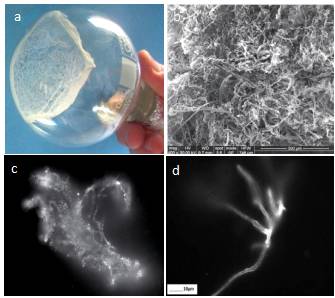
Figure 20. Iteratively nafionized water (INW) – a: solid sediment after lyophilization [Elia et al., (2017)]; b: sediment structure under SEM [Elia et al., (2017)]; c: Irregular shape of the structures observed with fluorescence microscopy in INW [Elia et al., (2013 a)]; d: Fluorescent microscope picture of INW. A 1% in weight carboxylate-modified polystyrene latex beads solution is dispersed in INW. The 200 nm-sized beads carry green fluorescent probes and emit bright, high contrast colors when illuminated by 465 nm light. Micron-sized irregular shaped structures are observable, on which the beads appear to be clustered [Elia et al (2017)]. (With kind permission from “WATER”).
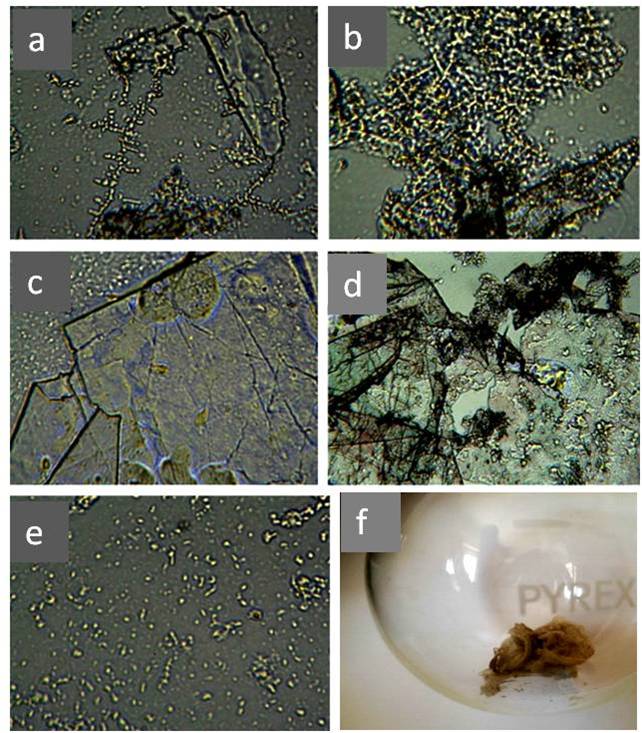
Figure 21. Optical microscopy images of IPW. a–d: Images of IPW-CE samples with χ IPW-CE of, respectively, 128 μS cm−1, 170 μS cm−1, 184 μS cm−1and 242 μS cm−1; e: image of IPW- N×500 enhancement. Numerous micron-sized fractals structured domains are visible; f: gel-like residue of IPW-CE [Elia et al., (2020)]. (In accordance with Creative Commons Attribution 4.0 International License).
The mass of the solid sediment was ~10% of the INW mass [Elia et al., (2017)]. The structure of dry sediment (Figure 20b) and microstructures in the bulk of the liquid (Figure 20c, d), in our opinion, strongly resemble fragments of the initial substrate – Nafion, which has a fibrous hollow microstructure [Gallyamov and Khokhlov (2014)].
The Iteratively Perturbed Water by Cellophane (IPW-CE) [Elia et al., (2020)] is an elaborate and detailed study. Figure 21 shows the results of morphological analysis of the structure of solid sediments IPW-CE after lyophilization.
Photos (a-d) in Figure 21 resemble microfragments of cellophane with an admixture of DP water (e). Cellophane, as a cellulose derivative, also has a microporous structure. Slit-like micropores are located between the binary sheets of the crystal cell. The penetration of water is most easily carried out into the interleaf space [Loelovich (2016), p. 17]. With active and repeated friction against water, the microstructure undergoes deformation and microfragments of the hydrophilic substrate enter the water. Our hypothesis is partially supported by the difference in microstructure after lyophilization of INW (Figure 20, b) and IPW-CE (Figure 21, a-d). This difference corresponds to the different microstructure inherent in Nafion and cellophane. Despite the morphological difference in solid-state residues after lyophilization, the physicochemical properties of water disturbed by different hydrophilic materials are very similar to each other [Elia et al., (2019), and Elia et al., (2020)]: all samples contained associates 10–4 mm in size, but in different concentrations, had a higher density and electrical conductivity than the initial water. According to the authors, the associates were detached from the surface and crumpled EZ, as a result of mixing and deformation of the surfaces [Elia et al. (2019)]. When water was perturbed by cellulose preparations, in particular, pH, electrical conductivity, heat of mixing with acids or bases, and density changed. It is natural to assume that the nature of these changes is also associated with an increase in the specific surface area of the system caused by multiple mechanical perturbations. In particular, this fact is confirmed by the linear correlation between electrical conductivity and other physicochemical variables [Elia et al. (2020)]. The interrelation of our observations with the formation of coherent domains within the framework of the theory of a quantum electromagnetic field [Del Giudice et al. (1988)] requires special studies. This theory can be used to interpret the stable phase of water in EZ [Marchettini et al. (2010); Del Giudice et al (2013); Yinnon et al. (2016)]. Thus, the classical concepts of water as a liquid homogeneous at the micrometer level must be revised, since they do not correspond to reality. Another important similarity of “water perturbed by hydrophilic surfaces” lies in the features of the IR spectra of these samples, which, in our opinion, deserves special attention.
Water Phases at Room Conditions
More than 70 years ago (see review [Henniker (1949)]), convincing experimental facts were obtained that indicate that water near hydrophilic surfaces forms a new phase – a near-surface layer, which is very different in terms of the complex of physical properties from bulk water. The thickness of this layer is up to hundreds of microns. Direct evidence of the existence of a new water phase was presented, including in terms of refractive index, diffraction of X-ray and neutron radiation, viscosity, adhesion, and the presence of long-range order in structural ordering. This information has been repeatedly confirmed by many researchers using different techniques of physical experiments. Experimental evidence was obtained for the fact that the structure of water formed at hydrophilic surfaces corresponds to the structure of ice and represents layers of hexagonal structures superimposed on each other in one, two, three or four layers [Kolkmeijer and Favejee (1933); Macey (1942); Mering (1946); Williamson (1948)]. It has been shown that thin (h <150 µm) layers of water located between glass surfaces have shape elasticity [Derjaguin (1933)]. Films with a thickness of 0.35 μm had the rigidity of metallic lead [Deryagin (1936)]. The viscosity of water in the gap between glass plates separated by 1 μm was many times higher than the viscosity of water in the volume [Terzaghi and Angew (1924)], and at a distance between the plates of 2.5 μm it was 10 times higher [Norton and Johnson (1944)].
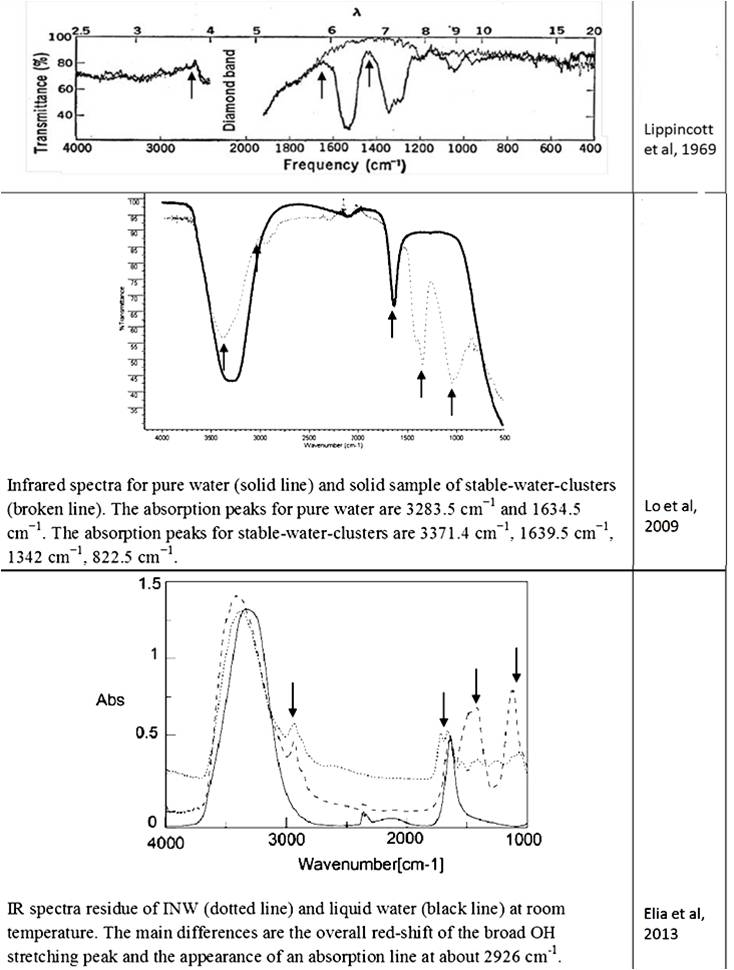
The data on the existence of a new phase of water under room conditions were not accepted by representatives of “classical science.” Suffice it to recall the opening and closing of “polywater” (water-II) [Derjagin et al., (1967); Franks (1982); Gould (1996)]. The water obtained by Soviet scientists during the condensation of water vapor in ultra-thin quartz capillaries had a significantly higher viscosity, density, refractive index, and surface tension than ordinary water. Its dissolving power was less. Experiments on obtaining polywater have been successfully reproduced in many research laboratories around the world, including Europe, the USA and Australia, and were widely discussed in the press and at international forums [Derjagin (1970); (Web ref. 4)]. The molecular weight of water-II determined from the vapor density exceeded this indicator for ordinary water by 8-10 times, and the absorption in the IR region was characterized by two peaks that are not characteristic of any other known substance [Lippincott et al., (1969)]. Based on the data obtained, it was assumed that the new substance is a polymer consisting of water molecules combined into hexagonal cells [Lippincott et al., (1969)]. Upon the formation of water-II from ordinary water vapor on the surface of fused quartz or glass, B.V. Deryagin assumed the existence of a special kind of condensation catalysis [(Web ref. 4)]. However, in water samples in a number of laboratories, inorganic [Rousseau and Porto (1970; Davis et al., (1971); Kurtin et al., (1970)] and organic [(Web ref. 4)]] impurities were found. In addition, unique IR absorption bands characteristic of polywater (1595 cm–1 and 1400 cm–1) were also found in a sample of human sweat [Rousseau (1971)]. All this, ultimately, served as a reason for accusing the authors of the discovery of insufficient purity of the experiment and called into question the very existence of the phenomenon [Ginzburg (1971)]. At the same time, for example, the hypothesis about the possible existence of polywater in biological fluids was ignored.
Under the onslaught of skeptical colleagues, the authors were forced to publicly “repent” [Derjagin and Churaev (1973); Derjagin et al.,(1974)]. However, it turned out that the “impurities,” interacting with the surrounding water, significantly changed its properties at the interface. In the work [Derjagin (1990), p. 68] we read: “A new stage in the study of surface phenomena was the discovery of a special structure of layers of polar liquids, bordering with the surface of an adjacent phase. Under the influence of this surface, polar molecules are oriented relative to it in a certain way, and this orientation is transferred from layer to layer over a certain distance. A similar phenomenon was observed for the first time in water layers adjacent to the surface of a hydrophilic body. In this case, the degree of orientation decreases with distance from the substrate, becoming insignificant at a distance of the order of the length of hundreds of molecules. As a result of a change in the structure, the properties of the boundary layers of water (refractive index, density, viscosity, dissolving ability) differ from the normal ones characteristic of the volume of water. The freezing point also changes. It is for this reason, as we have shown, that in permafrost regions the layers of water adjacent to the particles of hydrophilic clays do not freeze, at least at temperatures not lower than -10°C.” And further (p. 70): “According to its optical properties, the boundary layer is homogeneous and anisotropic, like liquid crystals, and is separated from the bulk phase by a sharp interface. Thus, in addition to the previously known solid, liquid and gaseous phases, there are ‘boundary phases’ of a strictly defined thickness, which naturally decreases with increasing temperature.” After the “exposure” of the researchers of the new phase of water, the work in this direction was frozen and partially forgotten. However, after half a century, the opinion that liquid water is two-phase resurfaced. According to modern data, the simplest model of the structure of liquid water assumes the existence of two separate microscopic phases [Pershin (2005); Russo and Tanaka (2014); Maestro et al., (2016); Gallo et al., (2016)]. Many physical quantities exhibit behavior that suggests the presence of two states in liquid water. For example, infrared and Raman spectra, as well as the presence of an isosbestic point in the Near Infrared Spectra, are considered as a clear sign confirming the model of a mixture of two phases [Renati et al.,l (2019)]. According to Preparata et al., (2000), liquid water is a two-component liquid system consisting of a coherent phase (about 40% of the total volume at room temperature) and an incoherent phase. Thin films of water of ice-like structure with a thickness of several molecular layers on hydrophilic surfaces have been rediscovered [Hu et al., (1995); Aarts et al., (2005); Jinesh and Frenken (2006); Jinesh and Frenken (2008); Striolo (2011)]. Obviously, these water films are formed from water vapor present in the ambient air, since their thickness depends on humidity. At this nanoscale level, effective viscosity of interfacial water near hydrophilic surfaces was approximately 106 times greater than that of bulk water [Goertz et al., (2007)] while no significant changes in the viscosity of water near hydrophobic surfaces are observed [Sendner et al., (2009)]. When a hydrophilic surface is immersed in water, a layer of structured liquid crystalline water up to 500 μm thick forms near it in a few minutes, displacing ions and microparticles from it, which are usually present in an aqueous medium [Zheng et al., (2006); Pollack (2013)]. An exclusion zone (EZ) is formed, in response to which the concentration of ions and particles in free water increases, increasing also its osmotic pressure [Chaplin (2012); Yakhno and Yakhno (2017 c)]. It is believed that the thin ice-like layer that covered the previously dry surface is used as a matrix for EZ growth [Fenter and Sturchio (2004); Verdaguer et al., (2006); Maccarini (2007)].
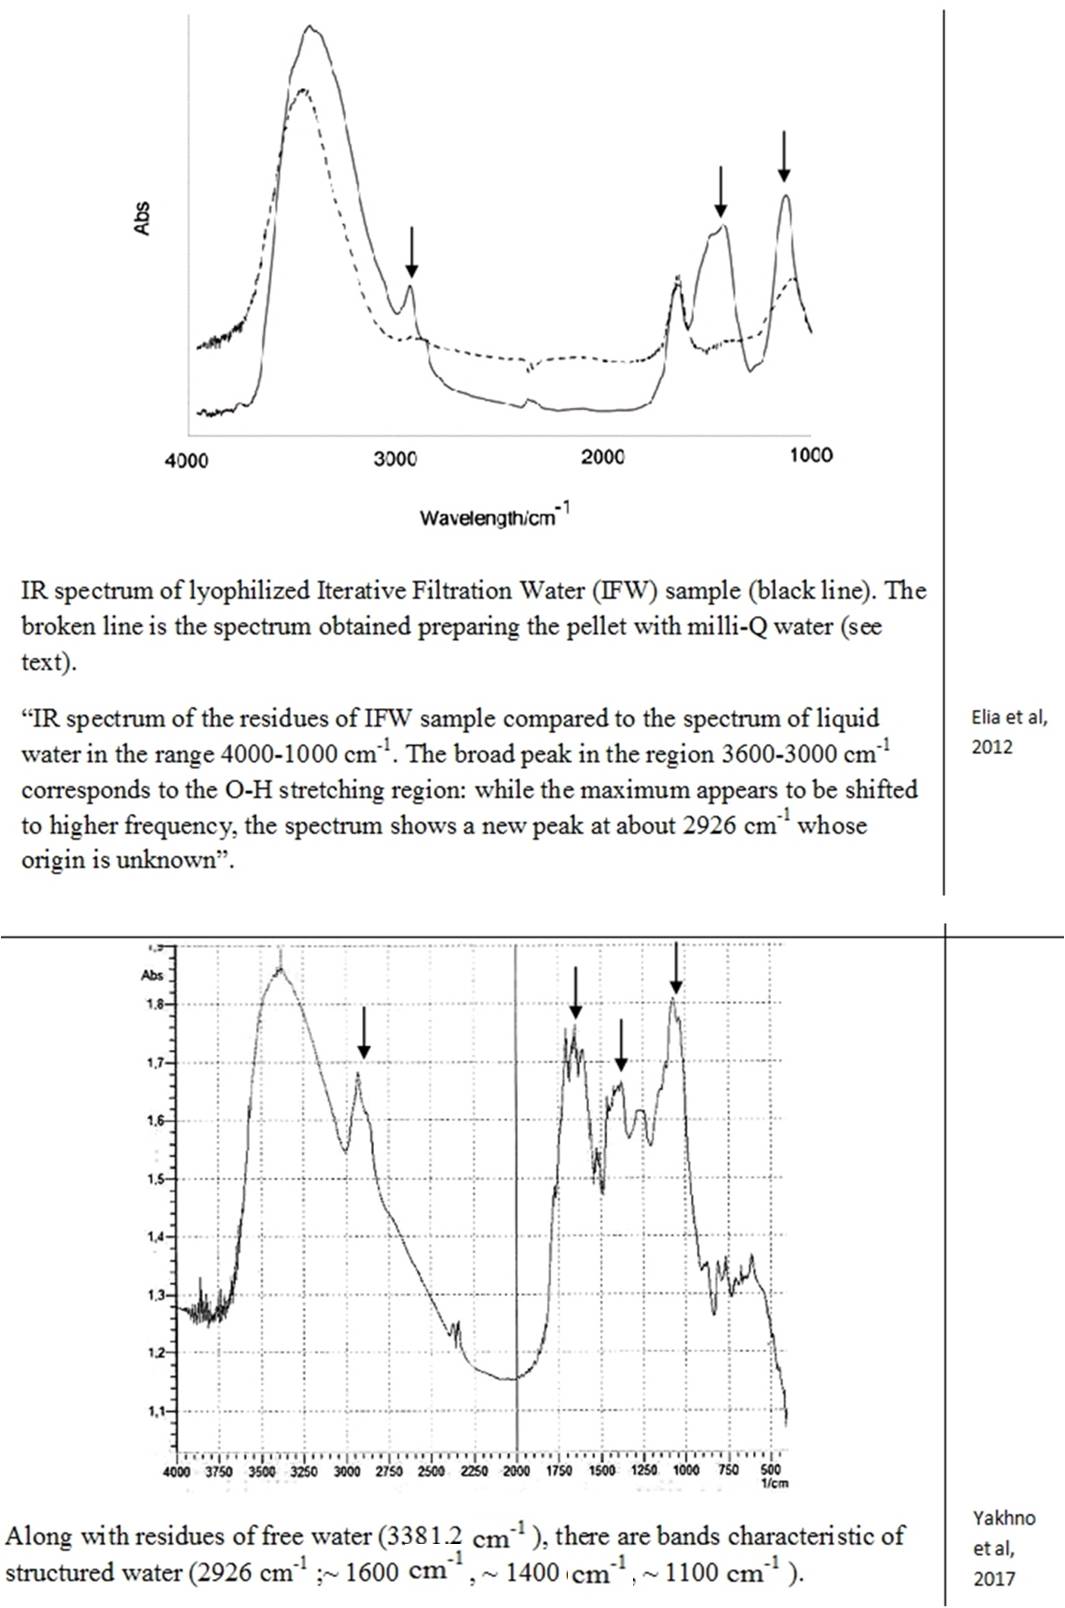
Despite the abundance of experimental evidence for the existence of the near-wall phase of water, a number of researchers stubbornly continue to deny this fact [Schurr (2013); Huszár et al., (2014); Elton et al., (2020); Esplandiu et al., (2020); Ninham et al., (2020)]. Several alternative explanations for EZ have been presented, in particular, Schurr’s theory based on chemotaxis and diffusiophoresis [Schurr (2013)]. This theory was strongly supported by Elton et al., (2020) and Esplandiu et al., (2020). Another view of the formation of EZ is associated with swelling in water and partial destruction of Nafion, a solid polymer electrolyte, a popular owner of hydrophilic surfaces [Huszár et al., (2014); Ninham et al., (2020)]. When this polymer swells, its fibers partially untwist and go out into bulk water. Such elongated strands can also form a rigid, parallel palisade that can repel colloidal microparticles; this, according to the authors of [Ninham et al., (2020)], creates the effect of an EZ near Nafion. Analysis of alternative opinions is beyond the scope of this work. Pollack clearly commented on skeptical statements about the formation of a special near wall layer of water: “In sum, the four issues of challenge fail to derail the original line of interpretation, that the EZ is a distinct, ordered structure that excludes solutes. Ample evidence for this interpretation (which Schurr seems to have missed) lends strength to this view” [Pollack (2013 b)]. Based on the features of the IR spectrum, the deconvolution of the OH-stretching peak between 2880 and 3800 cm–1 shows the complete disappearance of the higher energy component by about 3600 cm–1 relative to bulk water [Elia et al., (2013 b)]. This feature is characteristic of OH-stretching in ice. It is also noted that “Other features appearing at 1418 cm-1 and 1105 cm-1, that are not present in liquid water, are difficult to attribute univocally at the present stage of knowledge.” [Elia et al., (2013 a), p. 22]. Let us recall that the authors of the discovery of polywater faced a similar problem more than 50 years ago: “the complete absence of absorption from 2500 to 4000 cm-1, the presence of a strong band at about 1595 cm-1 and an intense doublet in the region of 1400-1” [Lippincott (1969)] … And further: “… we believe that water is restructured on the fused quartz or Pyrex surface into a polymeric form with bonds and bond energies completely different from that of ordinary water. Its properties are not those of water, and it should not be considered to be or even called water, any more than the properties of the polymer polyethylene can be directly correlated to the properties of the gas ethylene. In the case of the formation of polyethylene, a bond change occurs. In the case of polywater, a bond change also occurs, although it has previously been unknown. Vibrational spectra indicate unique stable polymeric structure” [Lippincott (1969), p. 1486]. As you can see, the authors of the discovery of “polywater” also obtained it upon contact of ordinary water with hydrophilic surfaces – fused quartz and glass. In accordance with the publication by Lo et al., (2009), the structures discovered by the authors – stable water clusters at room temperature – also had characteristic differences in the IR spectrum from ordinary water: the absorption peaks for pure water are 3283.5 cm-1 and 1634.5 cm-1. The absorption peaks for stable-water-clusters are 3371.4 cm-1, 1639.5 cm-1, 1342 cm-1, 822.5 cm-1. We see the same “red shift” and characteristic absorption for “water structures” obtained by other authors (Table 2). The IR spectrometric analysis of the Nescafe Gold coffee solution, in which we clearly observed aggregates of the dispersed phase of liquid crystalline water, revealed similar shifts [Yakhno et al.,(2017)]. To obtain the IR spectrum, a part of the sample dried to constant weight was ground in an agate mortar with a certain amount of KBr powder and pressed into a tablet. The IR spectrum was recorded on an IRRAFINITY-1 instrument (Shimadzu) in the range of wave numbers 400-4000 cm-1. The spectrum of a pure KBr tablet was used as a background. Table 2 shows the IR spectrum of the sample at room temperature. It can be seen that, along with residues of free water (3381.2 cm-1), there are bands characteristic of structured water (~1600 cm-1, ~1400 cm-1, ~1100 cm-1).
Thus, all the detected stable aqueous structures have similarities in the features of the IR spectrum characteristic of polywater. This means that there are only two phases of water – continuous and near-wall (EZ), and the latter can also exist in the form of “water structures”: EZ near hydrophilic impurities [Yakhno and Yakhno (2019 a)] or EZ, exfoliated from the substrate [Zhang et al., (2015)]. This second phase of water has a unified structure and corresponds to the previously described polywater [Lippincott et al., (1969)].
Thus, we carefully studied the structure of water under an optical microscope in its calm and excited state, reviewed the literature data relevant to the problem, and presented an alternative view of the activation mechanism and the formation of the second phase of water. The fact that water is a microdispersed system fundamentally changes the view on its thermodynamics. There is no doubt that the structure of water at the micro level is no less important for assessing the physicochemical properties than the structure at the atomic level. In terms of practical applications, one can return to the topic of water activation for agricultural work (Victor Schauberger; Rudolf Steiner), and also use hydrophilic filters to obtain water with a reduced size of the dispersed phase. However, the development of technologies for specific applications requires special research.
Conclusion
Under room conditions, water is a microdispersed system with all its inherent properties. There are two phases of water: one that is the usual continuous water, and the other that is water, which is a cyclic polymer Н2О, consisting of flat layers of hexagonal cells superimposed on each other (polywater). Polywater can exist as a near wall layer at hydrophilic surfaces (EZ), and as “micron-sized structures” floating in continual water. The structures are prone to the formation of aggregates (coagulates) tens and hundreds of microns in size. The degree of water dispersion determines its physicochemical properties. The downsizing of aggregates by any disturbance leads to a decrease in viscosity, an increase in electrical conductivity, an increase in pH, and a decrease in Redox potential. That is, the reason for the change in properties lies at the micrometer level, accessible for observation under an ordinary light microscope, and this reason is a change in the “surface concentration.” We consider the continuation of research in this area to be promising.
In conclusion, let us remember the statement of Albert Schweitzer: “Any truth is first ridiculed and then recognized.”
Conflicts of Interest
The authors declare no conflict of interest.
Funding
This research was funded by the Institute of Applied Physics RAS (Project No. 0030-2021-0014) in terms of collecting, processing data and presenting the results of data processing. The study has been supported also in the frames of the Governmental Project of the Ministry of Science and Higher Education of the Russian Federation (Project No. 075-15-2021-634) in terms of theoretical studies and data analysis.
Acknowledgments
The authors acknowledge Editorial Group WATER for the helpful comments and editing the text of the article. The authors highly appreciate the suggestions made by the reviewers, which greatly helped us to improve the manuscript.
Discussion with Reviewers
Paolo Renati
Just a question about the dimension of the Dispersed Phase (DP): could you better specify the dimension of dispersed phase in the several samples? If the thickness of these layers is about 8 micrometers, does this confinement affect the size of the DP?
Yakhno & Yakhno
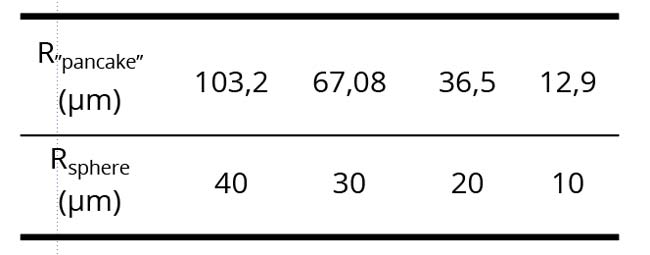
In Figure 1 DP elements are enclosed between glasses and are in a slightly (and sometimes in a strongly) flattened state. Pictures are motionless. Our observations suggest that the diameter of the DP particles can be in the range from a few to tens of microns. The radius of the flattened “pancakes” obtained from strongly compressed spheres of the (DP) naturally increases. From the evaluation formula (4/3) * R3sphere = (d = 8 µm) * R2 “pancake” we get clear numerical correspondences:
Paolo Renati
Please, specify here whether the DP is solid or liquid. And, if solid, you should explain better how you can be confident that this residual is what, in the liquid, was the DP.
Indeed, if the DP – which could be comparable to some kinds of electrodynamic coherent domain aggregates (Yinnon, 2009) – is something that exists in a thermodynamic equilibrium in the liquid, please, discuss how you conceive its permanence still in the solid phase (after evaporation).
Maybe it could be a similar mechanism as observed by Elia et al., in the genesis of solid water at room conditions, after lio-freeze-drying. In case, yes, it’s useful to mention this or to mention that these considerations will be done in one of the following sections.
Yakhno & Yakhno
The fact that the precipitate we observe during the evaporation of distilled water is formed from the DP suspended in liquid water is something that we have repeatedly observed during the evaporation of water through the edges of the preparation, which can be seen in Figure 5a, b.
In smears prepared from liquid aqueous solutions and dried in air, DP aggregates are plastic, easily deformed, do not evaporate at room temperature and do not dissolve in organic solvents. Under the action of salt, the structures begin to “melt” (Figure 13). Structural and functional similarity of CD and EZ [Marchettini et al., 2010] seems pretty convincing to us. We believe that after the liquid water has evaporated and the DP has dried, it is unlikely to retain its functionality from the point of view of your interest (Yinnon, 2009), since we have deprived the harmonious system of one of its integral parts (liquid water). But this should be investigated in more detail. Further transformations of DP in the process of drying and cracking are described in our article [Yakhno, Yakhno (2019) c]. After incubation for 4 hours at 60 degrees Celsius, the DP is subject to aging and cracking. Previously, similar processes in colloidal systems were considered in the article [Bacchin P., Brutin D., Davaille A., Giuseppe E., Chen XD, Gergianakis I., Giorgiutti-Dauphin’e F., Goehring L., Hallez Y., Heyd R., Jeantet R., Floch-Fouere C., Meireles M., Mittelstaedt E., Nicloux C., Pauchard L., Saboungi M.-L. Drying colloidal systems: laboratory models for a wide range of applications. Euro. Phys. J. E, 2018, 4:94 DOI 10.1140 / epje / i2018-11712-x]. Also, their similarities in the micro- and macrocosm, including pictures and geophysical phenomena, are noted.
Macroscopically residue of Iteratively Perturbed Water by Cellophane (RIPW-CE) and Residue of Iteratively Perturbed Water by Nafion (RIPW-N) after liophylization procedure have a gel-like consistency [Elia et al. 2020] (Figure 21 f). It is similar to our results observed in dried smears (Figure 13). But, the microscopic images by the same authors (Figure 20 and 21 a-d) do not inspire confidence. We suspect that our colleagues mistake the micro-fragments of the substrates, which they used to perturb liquid water in the course of experiments, for “solid water.” More research is needed.
Paolo Renati
It should be clarified a little better which of the hypothesized physical (or chemical-physical) dynamics is able to connect the decreasing of the size of the DP (or of an increase of a specific surface area in the liquid) to an increase in conductivity.
I mean, one hypotheseis could be that the increasing of the EZ water coating the microparticles in the liquid could be responsible for increased conductivity, because EZ water is a phase richer than the bulk liquid in “quasi-free” electrons (belonging to the Electric Dipole Aggregates, a coherent fraction, which the EZ water is made of, that constitute the solid residual after lyophilization).
Yakhno & Yakhno
Let us return to Borilo’s book [Borilo, 2012, p. 25], where this dependence is clearly shown. We find this perspective very convincing.
“It is convenient to classify surface phenomena in accordance with the combined equation of the first and second principles of thermodynamics. For a dispersed system, it can be written in the following form:
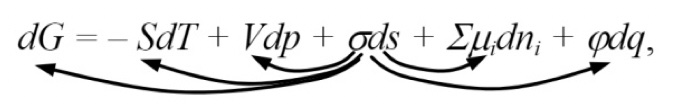
where G is the Gibbs energy; S: entropy; T is the temperature; V: volume; p: pressure; σ: surface tension; s: surface area; µi: chemical potential of component i; ni is the number of moles of component i; ϕ: electric potential; q is the amount of electricity.
This equation expresses the increment of the Gibbs energy in terms of the algebraic sum of increments of other types of energy. The transformation of surface energy into one of the presented types of energy corresponds to certain surface phenomena. The arrows indicate five possible transformations of surface energy: 1) into Gibbs energy, 2) into heat, 3) into mechanical energy, 4) into chemical energy, and 5) into electrical energy. These transformations accompany such phenomena as a change in reactivity with a change in dispersion, adhesion and wetting, capillarity, adsorption, electrical phenomena.”
In theory, your hypothesis is quite legitimate. The problem is that we know what the DP looks like after evaporation of bulk water (see Figure 12 in our manuscript). And this is not at all similar to the fibrous and lamellar structures presented in the figures in the works of Elia et al. (see Figure 20 and 21 in our manuscript). These images are more like microfragments of substrates used to perturb the water. Maybe we’re wrong. More research is needed.
References
Aarts IMP, Pipino ACR, Hoefnagels JPM, Kessels WMM, van de Sanden MCM (2005). Quasi-Ice Monolayer on Atomically Smooth Amorphous SiO2 at Room Temperature Observed with a High-Finesse Optical Resonator. PRL, 95, 16, 166104. DOI: 10.1103/PhysRevLett.95.166104
Anosov AV, Trukhan EM (2012). The variation of the vector potential in the laboratory changes the biological properties of water. Biophysics, 57, 3, 389-394. (in Russian).
Borilo LP (2012). Thin-film inorganic nanosystems (ed. prof. Kozik VV). – Tomsk: Tomsk State University, 134 p. ISBN 978-5-94621-362-2 (In Russian.).
Bukaty VI, Nesteruk PI. (2011). Investigation of optical inhomogeneities (clusters) in bidistilled water by the optical method of small angles. Polzunovskiy Vestn., 3, 106–108. (In Russian)
Bukaty VI, Nesteruk PI.(2012). Development of a measuring and computing complex and a method of small scattering angles to control optical inhomogeneities (clusters) in bidistilled water after the action of a magnetic field. Electron. Phys. Technol. J. 7, 1–10. (In Russian)
Bunkin NF, Shkirin AV; Suyazov NV, Starosvetskij AV (2013). Calculations of light scattering matrices for stochastic ensembles of nanosphere clusters. J. Quant. Spectr. Rad. Trans. 123, 23–29.
Capolupo A, Del Giudice E, Elia V, Germano R, Napoli E, Niccoli M, Tedeschi A,. Vitiellok G. (2014). Self-similarity properties of nafionized and filtered water and deformed coherent states. Int. J. Mod. Phys. B, 28, 3, 1450007 DOI: 10.1142/S0217979214500076
Chaplin M (2012). Self-generation of colligative properties at hydrophilic surfaces. Preprint. arXiv:1203.0206 [cond-mat.soft] (or arXiv:1203.0206v1 [cond-mat.soft]), [v1] Thu, 1 Mar 2012.
Chirkova VYu, Stas IE (2014). Diagnosis of changes in physico-chemical characteristics of deionized water due to electromagnetic field effect and various methods of degasation. News of Altai State University. DOI 10.14258 / izvasu (2014) 3,1-44. (in Russian)
Davis RE, Rousseau DL, Board RD (1971). “Polywater:” Evidence from electron spectroscopy for chemical analysis (ESCA) of a complex salt mixture. Science, 171, 167-170.
De Ninno A, Del Giudice E, Gamberale L, Congiu Castellano A. (2014) The Structure of Liquid Water Emerging from the Vibrational Spectroscopy: Interpretation with QED Theory. WATER, 6, 13-25.
Del Giudice E, Preparata G, Vitiello G (1988). Water as a Free Electric Dipole Laser. Physical Review Letters, 61, 9, 1085-1088.
Del Giudice E, Preparata G, Fleischmann M (2000). QED coherence and electrolyte solutions. J. Electroanal. Chem., 482 2,110–116. doi: 10.1016/s0022-0728(00)00019-x
Del Giudice E, Tedeschi A, Vitiello G, Voeikov V. (2013) Coherent structures in liquid water close to hydrophilic surfaces. J. Phys.: Conf. Ser. 442 012028 doi:10.1088/1742-6596/442/1/012028. 2013
Derjagin BV (1970). New data on superdense water. Physics – Uspekhi, 100, 4, 726-728.
Derjagin BV (1990). The world of colloid-superficial phenomena. Vestn. Akad. Nauk. SSSR. The heading “From the notebook of the researcher” 9, 68-75. (In Russian).
Derjagin BV, Churaev NV, Fedyakin NN, Talaev MV, Ershova IG (1967). Modified state of water and other liquids. Izv. Akad. Nauk, Ser. Khim., 10, 2178. (In Russian)
Derjagin BV, Sorin ZV, Rabinovich YaI, Churaev NV (1974). Results of analytical investigation of the composition of “anomalous” water. J Colloid Interf Sci, 46, 3, 437-441.
Derjaguin BV, Churaev NV (1973). Nature of “Anomalous Water”. Nature, 244, 430–431.
Derjaguin, B. Die Formelastizität der dünnen Wasserschichten. Zeitschrift für Physik, 1933, 84, 657–670.
Deryagin BV (1936). Range of Action of Surface Forces. Nature, 138, 330-331.
Eisenberg D, Kauzmann W (1997). The structure and properties of water. Oxford University Press, 318 p. ISBN-10:0198570260.
Elia V, Ausanio G, De Ninno A, Gentile F, Germano R, Napoli E, Niccoli M (2013). Experimental evidence of stable aggregates of water at room temperature and normal pressure after iterative contact with a Nafion® polymer membrane. WATER, 5, 16–26. doi: 10.14294/WATER.2013.4.
Elia V, Ausanio G, De Ninno A, Germano R, Napoli E and Niccoli M (2013). Experimental Evidences of Stable Water Nanostructures at Standard Pressure and Temperature Obtained by Iterative Filtration. WATER, doi: 10.14294/WATER.2013.11.
Elia V, Germano R, Napoli E (2015). Permanent dissipative structures in water: the matrix of life? Experimental evidences and their quantum origin. Curr Top Med Chem. 15, 559–71.
Elia V, Lista L, Napoli E, Niccoli M (2014). A thermodynamic characterization of aqueous nanostructures of water molecules formed by prolonged contact with the hydrophilic polymer Nafion. J Therm Anal Calorim. 115, 1841–9.
Elia V, Napoli E, Germano R, Oliva R, Roviello V, Niccoli M, Amoresano A, Naviglio D, Ciaravolo M, Trifuoggi M, Yinnon TA (2019). New chemical-physical properties of water after iterative procedure using hydrophilic polymers: The case of paper filter. J. Mol. Liq., 296, 111808.
Elia V, Napoli E, Germano R, Roviello V, Oliva R, Niccoli V, Amoresano A, Toscanesi M,Trifuoggi M, Fabozzi A, Yinnon TA (2020). Water perturbed by cellophane: comparison of its physicochemical properties with those of water perturbed with cotton wool or Nafion. J Therm Anal Calorim
Elia V, Napoli E, Niccoli M (2013). Physical–chemical study of water in contact with a hydrophilic polymer: Nafion. J Therm Anal Calorim. 112, 937–44.
Elia V, Yinnon TA, Oliva R, Napoli E, Germano R, Bobba F, Amoresano A (2017). Chiral micron-sized H2O aggregates in water: circular dichroism of supramolecular H2O architectures created by perturbing pure water. WATER, 8, 1–29.
Elton, D.C.; Spencer, P.D.; Riches, J.D.; Williams, E.D. Exclusion Zone Phenomena in Water—A Critical Review of Experimental Findings and Theories. Int. J. Mol. Sci. 2020, 21, 5041. doi:10.3390/ijms21145041.
Esplandiu MJ, Reguera D, Fraxedas J (2020). Electrophoretic origin of long-range repulsion of colloids near water/Nafion interfaces. Soft Matter, 16, 3717-3726.
Fenter P, Sturchio NC (2004). Mineral–water interfacial structures revealed by synchrotron X-ray scattering. Prog. Surf. Sci., 77, 171–258.
Fesenko EE; Terpugov EL (1999). On the unusual spectral properties of water in a thin layer. Biofizika, 44, 5–9 (In Russian)
Franks F (1982). Polywater. Cambridge, MA: The MIT Press, 208 pp.
Gallo P, Amann-Winkel K, Angell CA, Anisimov MA, Caupin F, Chakravarty C, Loerting T, Panagiotopoulos AZ, Russo J, Tanaka H, Vega C, Xu L, Pettersson LGM (2016). Water: A tale of two liquids. Chem. Rev., 116, 7463–7500.
Gallyamov MO, Khokhlov AR (2014). Polymer Membrane Fuel Cells: Materials for the Fuel Cell Fundamentals course. Moscow: Faculty of Physics, Moscow State University, 72 p. ISBN 978-5-600-00346-0 (In Russian).
Ginzburg VL (1971). What problems of physics and astrophysics seem to be especially important and interesting? Physics – Uspekhi, 103, 87, 93-94. (In Russian).
Goertz, MP; Houston, JE; Zhu X-Y (2007) Hydrophilicity and the Viscosity of Interfacial Water. Langmuir 23(10), 5491-7, DOI: 10.1021/la062299q
Goncharuk VV, Smirnov VN, Syroeshkin AV, Malyarenko V.V. (2007). Clusters and giant heterophase clusters of water. Chem. Technol. Water 29, 3–17. ISSN 0204 – 3556. (in Russian).
Goncharuk VV, Taranov VV, Kurlyantseva AYu, Syroeshkin AV (2015). Phase transition in waters with different content of deuterium. J. Water Chem. Technol, 37, 219–223.
Gould SJ. Ice-nine, Russian style, in the book: The Mismeasure of Man. Norton, 1996, 447 pp. Available online (accessed on 11 August 2000).
Grodsky KI, Kienskoy NN, Gavrilova VV, Nazarov VV. Moscow: DI Mendeleev RKhTU, eds. (2013). Basic concepts and equations of colloidal chemistry. 40 p. (in Russian).
Gulyaev YuV, Eremin SM, Markov IA, Novoselova EG, Novikov VV, Ten YuA, Fesenko EE (2005). Physico-chemical properties of reagent-free water and its biological activity. Journal of Radioelectronics, 11 (electronic journal, ISSN 1684-1719) (in Russian)
Henniker JC (1949). The depth of surface zone of a liquid. RMP, 21 2, 322-341.
Hu J, Xiao X-d, Ogletree DF, Salmeron M (1995). The structure of molecularly thin films of water on mica in humid environments. Surface Science, 344, 3, 221-236
Huang C, Wikfeldt KT, Tokushima T, Nordlund D, Harada Y, Bergmann U, Niebuhr M, Weiss TM, Horikawa Y, Leetma M, Ljungberg MP, Takahashi O, Lenz A, Ojama L, Lyubartsev AP, Shin S, Pettersson LGM, Nilsson A (2009). The inhomogeneous structure of water at ambient conditions. Proc. Nat. Acad. Sci. USA, 106, 15214–15218
Huszár I, Mártonfalvi Z, Laki A, Iván K, Kellermayer M (2014). Exclusion-Zone Dynamics Explored with Microfluidics and Optical Tweezers. Entropy, 16, 4322–4337.
Ice-nine, Russian style. In the book: Gould SJ (1996). The Mismeasure of Man. Norton, 1996, 447 pp. Available online. (accessed on 11 August 2000).
Ise N (2010). Like likes like: counterion-mediated attraction in macroionic and colloidal interaction. Phys. Chem. Chem. Phys. 12 10279-10287
Ito K, Yoshida H, Ise N (1994).Void Structure in colloidal dispersions. Science 263 (7) 66-68.
Jinesh KB, Frenken JWM (2006). Capillary Condensation in Atomic Scale Friction: How Water Acts like a Glue. PRL, 96, 166103.
Jinesh KB, Frenken WM (2008). Experimental Evidence for Ice Formation at Room Temperature. PRL, 101, 036101.
Karakashev SI, Firouzi M, Wang J, Alexandrova L, Nguyen AV (2019). On the stability of thin films of pure water. Adv. Colloid Interface Sci. 268, 82–90.
Kolkmeijer NH, Favejee JCL (1933). The Structure of Emulsoid Sol Particles and their Hydration Film. Nature, 133, 602.
Kulagina VA, Sapozhnikova ES, Stebeleva OP, Kashkina LV, Zheng Ch-I, Li Ts, Lee F-Ch (2014). Features of the effect of cavitation on the physicochemical properties of water and effluents. Journal of Siberian Federal University. Engineering & Technologies, 5, 7, 605-614 (in Russian).
Kurtin SL, Mead CA, Mueller WA, Kurtin BC, Wolf ED (1970). “Polywater”: a hydrosol? Science, 167, 1720 -1722.
Laboratory Water. Its Importance and Application. (2013). National Institutions of Health, , 22 p.
Laptev BI, Sidorenko GN, Gorlenko NP; Kulchenko AK, Sarkisov YS, Antoshkin LV (2013). Evaluation of the structure of water and aqueous solutions of sodium chloride using dielectrometry and resonance method. Vestn. TSUAB 2, 235–244. (In Russian)
Lippincott ER, Stromberg RR, Grant WH, Cessac GL (1969). Polywater. Science, 164, 1482–1487.
Liu X, Shi H, Zhang K, Jensen EJ, Gettelman A, Barahona D, Nenes A, Lawson P. (2012). Sensitivity studies of dust ice nuclei effect on cirrus clouds with the Community Atmosphere Model (CAMS). Atmos. Chem.Phys., 12, 12061-12079.
Lo S.Y, Geng X, Gann D (2009). Evidence for the existence of stable-water-clusters at room temperature and normal pressure. Phys. Lett. A, 373, 3872–3876. doi:10.1016/j.physleta.2009.08.061.
Loelovich MYa (2016). Models of supermolecular structure and properties of cellulose. High-molecular compounds, Ser. A, 58, 6, 604-624. (In Russian).
Maccarini M (2007). Water at solid surfaces: A review of selected theoretical aspects and experiments on the subject. Biointerphases, 2, MR1–MR15.
Macey HH (1942). Clay-water relationships and the internal mechanism of drying. Trans. Brit. Ceram. Soc., 41, 73–121.
Maestro LM; Marqués MI, Camarillo E, Jaque D, García Solé J, Gonzalo J.A, Jaque F, del Valle JC, Mallamace F, Stanley HE (2016). On the existence of two states in liquid water: Impact on biological and nanoscopic systems. Int. J. Nanotechnol., 13, 667–677.
Malenkov GG (2006) Structure and dynamics of liquid water. J. Struct. Chem., 47, S5–S35.
Marchettini N, del Giudice E, Voeikov V, Tiezzi E. (2010) Water: A medium where dissipative structures are produced by coherent dynamics. J Theor Biol. 265, 4, 511-6. doi: 10.1016/j.jtbi.2010.05. 021.
Mering J (1946). On the hydration of montmorillonite. Trans. Faraday Soc., 42B, 205-224.
Messori C (2019). The Super-Coherent State of Biological Water. Open Access Library Journal, 6 e5236.
Murayama T, Furushima M, Oda A, Iwasaka N, Kai K (1996). Depolarization ratio measurements in the atmospheric boundary layer by lidar in Tokyo. J. Meteorol. Soc. Jpn., 74, 571–578.
Murayama T, Furushima M, Oda A, Iwasaka N.(1997). Aerosol optical properties in the urban mixing layer studied with polarization lidar with meteorological data. In: Advanced in Atmospheric Remote Sensing with Lidar. Eds: Ansmann A, Neuber R, Rairoux, P, Wandinger U. Springer: New York, NY, USA, 19–22.
Murayama T, Okamoto H, Kaneyasu N, Kamataki H, Miura K (1999). Application of lidar polarization measurement in the atmospheric boundary layer: Effects of dust and sea-salt particles. J. Geophys. Res., 104, 31781–31792.
Musienko KS, Ignatova TM, Glazkova VV (2014). Studying the influence of physical fields on the physicochemical properties of water. Biomedical Engineering and Electronics, 2. URL: biofbe.esrae.ru/199-963. (in Russian)
Nilsson A; Pettersson LGM (2011). Perspective on the structure of liquid water. Chem. Phys., 389, 1–34.
Ninham DW, Bolotskova PN. Gudkov SV, Juraev Y, Kiryanova MS, Kozlov VA, Safronenkov RS, Shkirin AV, Uspenskaya EV, Bunkin NF (2020). Formation of Water-Free Cavity in the Process of Nafion Swelling in a Cell of Limited Volume; Effect of Polymer Fibers Unwinding. Polymers, 12, 2888;
Norton H, Johnson AL (1944). Fundamental study of clay: v, nature of water film in plastic clay. J. Am. Cer. Soc., 21, 77-80.
Pang X– F. (2014). Water: molecular structure and properties. Word Scientific Publishing Co. Pte. Ltd., 492 p. ISBNN 978-9814440424.
Pershin SM (2005). Two-liquid water. Phys. Wave Phenom., 13, 4, 192-208.
Pollack G (2013 a). The fourth phase of water: beyond solid, liquid, and vapor. Ebner and Sons Publishers, Seattle, WA, 320 p.
Pollack GH (2013 b). Comment on “A Theory of Macromolecular Chemotaxis” and “Phenomena Associated with Gel–Water Interfaces. Analyses and Alternatives to the Long-Range Ordered Water Hypothesis”. J. Phys.Chem. B, 117, 7843–7846.
Preparata G, Messina B, Talpo, G, Gigante GE, Del Giudice E, Bizzarri M, Sermonti G, Grieco U, Valenzi V, Roseghini ML (2000). The Role of QED (Quantum Electro Dynamics) in Medicine. Proceedings of Meeting 14/12/1999 Institute of Pharmacology University of Rome “La Sapienza”2000, 1-27.
Renati P, De Ninno ZA, Tsenkova R (2019). Temperature Dependence Analysis of the NIR Spectra of Liquid Water confirms the existence of two phases, one of which is in a coherent state. J. Mol. Liq, 292, 111449.
Rousseau DL (1971). “Polywater” and sweat: similarities between the infrared spectra. Science, 171, 170-172.
Rousseau DL, Porto SPS (1970). Polywater: polymer or artifact? Science, 167, 1715-1719.
Russo J, Tanaka H (2014). Understanding water’s anomalies with locally favoured structures. Nature Communications, DOI: 10.1038/ncomms4556.
Sarkisov GN (2006) Structural models of water. Phys. Usp., 49, 809–820.
Schurr JM (2013). Phenomena Associated with Gel–Water Interfaces. Analyses and Alternatives to the Long-Range Ordered Water Hypothesis. J. Phys. Chem. B, 117, 7653–7674.
Sedlák M. (2006). Large-scale supramolecular structure in solutions of low molar mass compounds and mixtures of liquids: I. Light scattering characterization. J. Phys. Chem. B, 110, 4329–4338. doi: 10.1021/jp061919t.
Sendner C, Horinek D, Bocquet L, Netz RR (2009). Interfacial Water at Hydrophobic and Hydrophilic Surfaces: Slip, Viscosity, and Diffusion. Langmuir, 25, 10768-10781.
Smirnov AN. (2010). New structures of water: emulons. Molecular biophysics, Physics of the living, 18, 2, 5-17. (In Russian).
Striolo A (2011). From interfacial water to macroscopic observables: a review. Adsorption Science & Technology, 29 3, 211-258.
Terzaghi C, Angew Z (1924). Math. Mech. 4, 10’7. (As quoted in Hennicker’s review).
Verdaguer A, Sacha GM, Bluhm H, Salmeron M (2006). Molecular Structure of Water at Interfaces: Wetting at the Nanometer Scale. Chem. Rev., 106, 1478–1510.
Williamson, WO (1948). The clay/water relation. ReSearch, London, 1, 363-371.
Yakhno T (2011). Blood as a polydisperse system. Lambert Academic Publishing GmbH & Co, Germany, 94-116. ISBN: 978-3-8443-5767-7 (in Russian).
Yakhno TA, Sanin AG (2015). Fluctuations of the dynamic parameters of structurization of drying droplets periodically sampled from the total volume of multicomponent aqueous solutions. Proceedings of the VII International Congress “Weak and superweak fields and radiation in biology and medicine,” September 7 – 11, 2015, St. Petersburg, 7, 114. (in Russian)
Yakhno TA, Uvarov VM, Sanin AG, Kazakov VV (2015). Hydro-shock-cavitation effect on water, or where do protons disappear? Proceedings of the V Congress of Biophysicists of Russia, October 4-11, 2015, Rostov-on-Don, 2, 339. (in Russian).
Yakhno TA, Yakhno VG (2016). Investigation of oscillatory processes in colloidal liquids by the drying drop method. Proceedings of the XI International Scientific and Technical Conference, Sevastopol, April 25-29, 2016. 1,15-19 (in Russian)
Yakhno TA, Yakhno VG, Zanozina VF (2017). Phase transitions of water as a source of slow oscillatory processes in liquid media. Proceedings of the XII International Science-Technical Conference “Modern Trends in Biological Physics and Chemistry”, Sevastopol, Russia, 2–6 October 2017; 23–27. (In Russian).
Yakhno TA, Yakhno VG. Slow self-oscillatory processes in colloidal liquids. The role of the solvent (2017a). Abstracts of the XXIV International Conference “Mathematics. Computer. Education”. Pushchino, 23-26 January 2017, Moscow-Izhevsk 2017, p. 91. (In Russian).
Yakhno TA, Yakhno VG (2017 b). “Coffee drop phenomenon” and its temporary fluctuations. Autonomous oscillatory processes in colloidal liquids. JTF, 87, 3, 323-330.
Yakhno TA, Yakhno VG (2017 c). Water-induced self-oscillatory processes in colloidal systems by the example of instant coffee. J. of Bas. and Appl. Res. Int., 20, 2, 70-83.
Yakhno TA, Pakhomov AM, Sanin AG, Yakhno VG (2018). The effect of low-intensity light on the structural and dynamic parameters of water. Proceedings of the VIII International Congress “Weak and Superweak Fields and Radiations in Biology and Medicine”, 2018, St. Petersburg, 8, 99. (in Russian).
Yakhno T, Yakhno V (2019 a). A study of structural organization of water and aqueous solutions by means of optical microscopy Crystals, 9, 52.
Yakhno TA, Yakhno VG (2019 b). Microstructure and phase transitions of water according to optical microscopy. Proceedings of the second all-Russian conference “Physics of aqueous solutions”, October 17-18, 2019, Moscow, 44-45. (in Russian)
Yakhno TA, Yakhno VG (2019 c) Physical – chemical evolution of the dispersed phase of water when it dries. Russian journal of biological physics and chemistry, 4, 1, 9-16. (in Russian)
Yakhno T, Drozdov M, Yakhno V. (2019 d). Giant Water Clusters: Where Are They From? Int. J. Mol. Sci., 20, 1582.
Yakhno TA, Yakhno VG (2020 a). Study of the role of the microdispersed phase of water during its transition to the state of activation. Russian journal of biological physics and chemistry, 5, 1, 43-51. (in Russian).
.Yakhno TA, Yakhno VG (2020 b). Structure and Dynamics of Aqueous Dispersions. Open Access book “Colloids – Types, Preparation and Applications” ed. by Prof. Rashed MN, London, UK, 1-30. DOI: 10.5772/intechopen.94083.
Yinnon C, Yinnon TA. (2009). Domains in aqueous solutions: Theory and experimental evidence. Modern Physics Letters. B, 23,16, 1959–1973. doi: 10.1142/s0217984909020138
Yinnon TA, Elia V, Napoli E, Germano R, Liu Z-Q (2016). Water ordering induced by interfaces: an experimental and theoretical study. WATER, 7, 96–128.
Yinnon TA, Liu ZQ (2015). Domains Formation Mediated by Electromagnetic Fields in Very Dilute Aqueous Solutions: 1. Quantum Electrodynamic Aspects. WATER 7, 33-47, doi: 10.14294/WATER.2015.4
Yoshida H, Ise N, Hashimoto T (1995). Restricted motion of a particle trapped inside a void in a colloidal dispersion. Langmuir 11 2853-2855
Zhang Y, Takizawa S, Lohwacharin J (2015). Spontaneous Particle Separation and Salt Rejection by Hydrophilic Membranes. WATER, 7, 1-18. doi: 10.14294/WATER.2015.2.
Zheng J, Chin W-C, Khijniak E, Khijniak E Jr, Pollack, G (2006). Surfaces and interfacial water: evidence that hydrophilic surfaces have long-range impact. ACIS, 127, 19-27.
Web References
(Web ref. 1). Science and Life, The structure of water: new experimental data https://www.nkj.ru/archive/articles/20017 / (In Russian) (accessed on 2 July 2019).
(Web ref. 2). Voiland A. Aerosols: Tiny Particles, Big Impact. Available online: http://earthobservatory.nasa.gov/features/Aerosols (accessed on 2 November 2010).
(Web ref. 3). About melt water. Available online: https://aif.ru/health/food/1446590 (accessed on 10 November 2018).
(Web ref. 4). Derjagin B (2007). Abnormal water – hypotheses and facts. (In Russian). Available online: www.o8ode.ru/article/water/udivit/anomalwater.htm (accessed on 7 May 2008).