
 Analysis of Stimulated Electrophotonic Glow of Liquids
Korotkov, K1,*; Orlov, D1
1 Department of Computer Science, St. Petersburg Federal University “ITMO,” Kronverski prospect 49, St. Petersburg, 197101, Russia
* Correspondence: Tel.: (+7-921) 936-8394; Email: kk@korotkov.org
Key Words: electrophotonics, photons, structured water, water energy, GDV, water quality, memory of water
Received 9 September 2009; revised 29 December; accepted 15 January 2010. Published 12 February 2010; available online 12 February 2010.
Summary
A new method of monitoring water properties—dynamic Electrophotonic (EPC) analysis—has been developed. It is based on measuring water by using computer processing programs to gage how the water surface has been stimulated by electromagnetic field photon emissions. The technology is based on the well known gas-discharge visualization (GDV) method. Numerous experiments demonstrated high sensitivity of the EPC analysis for detecting weak transformations of water under the influence of electromagnetic fields, air, light, and other subtle factors. The EPC method was used to dectect the difference between natural and synthetic liquids. Different liquids, such as blood, saliva, microbiological cultures, and oils may be studied by this approach as well. There is evidence that allows us to propose that EPC image properties are determined by the structure of the near-surface clusters, which means that the electrophotonic method is one of the informative methods for studying structural properties of liquids.
Article Outline
Introduction
The usefulness of the Dynamic Electrophotonic Capture (EPC) Analysis based on Gas Discharge Visualization (GDV) method (Korotkov et al., 2002, 2010; Web ref.1) applied for studying liquid-phase subjects, was first demonstrated during a study of the glow of microbiological cultures (Gudakova et al., 1990), blood of healthy people and cancer patients (Korotkov et al., 1998), reaction of blood to allergens (Sviridov et al., 2003), homeopathic remedies of 30C potency (Bell et al., 2003), and very small concentrations of various salts (Korotkov, Korotkin, 2001). The differences between the glow parameters of the NaCl, KCl, NaNO3 and KNO3, solutions and distilled water were observed until the 2-15 dilution. However, the dynamic trends of the 2-15 dilution and distilled water still had different directions.
Great interest has been roused by the studies directed at detecting the differences between the glow of natural and synthetic essential oils with identical chemical composition (Korotkov et al., 2004). The oils were analyzed in order to detect possible differences between oils that were obtained by means of natural and synthetic processes, between oils of organic and regular origin; between oils obtained in different climatic conditions and oils extracted by means of different methods; between oils with different optical activity; between fresh oils and oils that were oxidized by various methods. The combinations of oils under study did not show any statistically significant differences when analyzed by means of the gas chromatography method.
Technique
The study of Electrophotonic parameters of liquids is based on using a commercially produced instrument called a GDV Camera, which is manufactured by the KTI Company, St. Petersburg (Web ref. 2). This instrument analyzes stimulated photon emissions from human fingers. The instrument is used
for health and well-being diagnostics (Measuring 2002), analysis of athletes (Bundzen et al., 2005), analysis of altered states of consciousness (Bundzen et al., 2002. Korotkov et al., 2005), analysis of the influence of music (Gibson, Williams 2005) and Qigong to people (Rubik, Brooks 2005), as well for analysis of geo-active zones (Hacker et al., 2005) and minerals (Vainshelboim et al., 2005).
When the EPC parameters are measured for liquid subjects, a drop of the liquid is suspended at 2-3 mm distance above the glass surface of the optical window of the device, and the glow from the meniscus of the liquid is registered (Fig.1). The volume of the liquid is about 5*10-3 ml. The temperature is kept in the range 22-24 C, the relative humidity is maintained from 42% to 44%. The train of triangular bipolar electrical 10 mcs impulses of amplitude 3 kV at a steep rate of 106 V/s and a repetition frequency of 103 Hz, is applied to the conductive transparent layer at the back side of the quartz electrode thus generating an electromagnetic field (EMF) at the surface of the electrode and around the drop. Under the influence of this field, the drop produces a burst of electron-ion emissions and optical radiation light quanta in the visual and ultraviolet light regions of the electromagnetic spectrum. These particles and ions initiate electron-ion avalanches, which give rise to the sliding gas discharge along the dielectric surface (Korotkov, Korotkin, 2001). A spatial distribution of discharge channels is registered through a glass electrode by the optical system with a charge coupled device TV camera, and then it is digitized in the computer.

Figure 1: Principle of study of electrophotonic glow of liquids. 1 – liquid meniscus; 2 – transparent quartz electrode; 3 – impulse generator; 4 – optical system; 5 – metal electrode.
The drops are exposed to the EMF from 2 s up to 10 s, and short “films” are recorded in the computer as .avi files. The frame rate (frequency of recording) is defined by the optical system and typically ranges from 30 to 60 frames per second. The avi files are then converted to a series of BMP files, and the area (the number of light-struck pixels) and average intensity (ranked from zero for absolute black to 255 for absolute white) parameters are generated by the software for every image. The time series are averaged on ten measurements that provide the statistical reliability at the confidence level of 0.95 with the experimental sensitivity of 75%. Examples of the EPC glow for different liquids are presented in Fig.2. This method is very sensitive to the condition of water and liquids, but in the process of discharge, micro-droplets of water are dispersed to the surface of the electrode, thus changing the volume of drop in time. So this method may be used for short—up to 30 s—time series only. Recording 30 frames per second provides about 900 images in 30 s which is quite enough for statistical analysis.
a
b 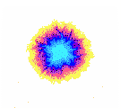
c 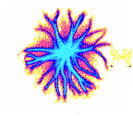
Figure 2: Examples of EPC glow of different samples of water. a – distilled water; b – tap water; c – structured water.
The reproducibility of the method was verified by measuring the time dynamics of the gas discharge around a titanium metal cylinder that was 10 mm in diameter. The cylinder was placed at the center of the optical electrode and electrically connected with the EPC instrument. A special holder fixed the position of the cylinder on the electrode. 30 subsequent measurements provided statistical reliability at the confidence level of 0.95 with the experimental sensitivity of 95%. The deviation at every point of the time series was less than 3%.
The same type of metal cylinder is used in another method of measuring variations of water properties over a period ranging from ten minutes to many hours. In this case, the water is kept in a glass vial and a standard Pt electrode is inserted in the water (Fig.3). The Pt electrode is connected with the metal cylinder, which in this case is disconnected from the EPC instrument. In this case, the electrical current (and the intensity of gas discharge around the metal cylinder), is defined by the capacitance resistance of the electrical chain: cylinder – electrical wires – Pt electrode – water, which depends on the water properties.

Figure 3: Principle of study of electrophotonic glow of liquids. 1 – EPC instrument; 2 – metal cylinder; 3 – glass with water; 4 – Pt electrode; 5 – sliding gas discharge.
To define the exact dependence from the capacitance, the metal cylinder was connected to different grounded capacitances. The experimental data and a quantitative approximation are presented in Fig.4. As you see from the graph, the signal increases up to approximately C = 100 pF, and this line may be described by the equation:
[1] A = 3717·Ln(C) – 2269.3 at x ≤ 100.

Figure 4: Dependence of the EPC Area of the metal cylinder from the capacitance.
For water and different liquids the capacitance is in the range 25-30 pF and little changes of physical properties of the water cause changes of the capacitance parameter, which is reflected in significant changes of the EPC signal. This makes the “Pt electrode method” very sensitive to the changes of water properties under the influence of different factors. This method allows one to study time changes of water properties for many hours.
Together with the above-mentioned two methods, a set of instruments was developed for studying low-conductive liquids (including oils) and different subjects (see Fig.5).
a

b

c
d

Figure 5: EPC installations for studying different subjects. A,B – low-conductive liquids; C – grains; D – leaf.
Results
(a) Method with Suspended Drop

Figure 6: Time dependence of the EPC glow area of the water drop.’ 1,2 – Samples of water taken right after opening a bottle; 3,4 – Samples of water taken 4 hours after opening the bottle; 5 – Distilled water. The vertical lines represent the level of variation between 10 independent samples of the tested water.
The presented data shows that right after opening the bottle the glow of water is characterized by a great variability between the measurements and by a considerable increase of the values of parameters, with two distinct phases, but about 2 minutes after the opening the results become stabilized. For the samples of water that were taken 4 hours later, a rise can be observed during the first 30 seconds; after that the parameters remain stable. The amplitude of glow for the distilled water is considerably lower and practically does not change in time.
Monotone increasing of the area at the first seconds of measurement is due to the electro-positive discharge accumulation that takes place at the surface of the glass electrode where the discharge is occurring. As was demonstrated by computer modeling (Korotkov 1985), an electrical field created by positive ions decreased the applied EMF so that the length of the discharge streamers decreased in every subsequent discharge. After some time, when the dynamic equilibrium between the speed of the positive ions accumulation, their neutralization and leakage along the surface was established and the length of the streamers became quasi-constant.
To study the dependence of EPC parameters on the concentration of salt solutions of strong electrolytes (completely dissociated into ions by the solvent) such as NaC1, KC1, NaNO3 in distilled water have been used. Fig.7-8 reflects typical concentration dependence for the parameters EPC Area and Entropy. Both parameters reach a quasi-stable level at some concentration that is related to a particular electro-conductivity of the solution (Fig.9).

Figure 7: Dependence of the EPC Area on the concentration for a NaNO3 solution.
Neighboring concentrations of the same solution of strong electrolytes have been studied and found to have different ion radiuses and electro-conductivity as well as significantly different EPC parameters. Similar concentrations of different solutions have also been found to have different ion radiuses and electro-conductivity.

Figure 8: Dependence of the EPC Area on the concentration for a NaNO3 solution.
The glow area of drops of the same size is a function of photon emissions from their surface. Consequently, activity and flexibility of ions, as well as the ionization and dissociation degree, will contribute to the value of the given parameter. The Area parameter and the equivalent electro-conductivity appear to be connected by the polynomial dependency of the fifth range.
Such dependences confirm a non-linear character of connection between the electro-conductivity and EPC coefficients. It is reasonable to suggest both groups of parameters reflect some basic physical properties of solutions. Such a property for the equivalent electro-conductivity is the flexibility of ions and ion clusters. The revealed dependence of the coefficients of non-linear regression from the values of ion radiuses, found during analysis of the data, supports these assumptions. The given dependency is also characteristic for super small concentrations of ions that correspond to the hypothesis that cluster structures in liquids may be revealed by the EPC-technique.
The sensitivity of the Electrophotonic analysis of water allows studying changes of water properties under different influences. As an example, Fig. 10 demonstrates an EPC signal from several samples of tap and filtered water under the influence of a pulsating magnetic field. In all cases we see significant changes of the EPC Area of the water samples.

Figure 10: EPC Area for initial and magnetized samples of water.
We have mentioned a paper of Bell et al., (2003): “Evaluation of Ultra-molecular Doses of Homeopathic Medicines Under Blinded, Controlled Conditions.” Bell et al. showed that, compared with the solvent, homeopathic remedies of 30C potency had a different response to the electromagnetic field.
Similar research was done with Bach Flower essences. They are being prepared by adding several drops of the flower essence to the solvent. Fig. 11 demonstrates the results of the experiment where a different number of drops of chamomile essential oil were added to 100 ml of solvent. As can be seen in the graph, we had the highest EPC signal from solvents with half a drop and two drops. It is interesting that Dr. Bach recommended adding two drops.

Figure 11: EPC Area of solutions with different number of chamomile essential oil drops (from 0 to 5) added to 100 ml of solvent.
There are a lot of speculations about the influence of pyramidal structures on different processes, and in particular on the human condition. We developed a model of a pyramid made from paper 30 cm high (~ 1 ft) and placed a glass with 100 ml of tap water under the pyramid for a night. After repeating this experiment several times we found that in some cases the EPC image of water being measured in the morning changed its appearance. Fig. 12 demonstrates typical images of initial water as well as water after a night under the pyramid. We need to direct the reader’s attention to the fact that these results were irreproducible; we had them just several times in many experiments, and no correlations with environmental conditions or with moon phases were found.

Figure 12: EPC images of water. A – initial tap water; B,C – the same water after a night under the pyramid.
Later, we were able to travel to Mexico, where we conducted numerous experiments with water kept at the top of pyramids for several hours or overnight, and in many cases we observed significantly different EPC parameters for this water compared with control samples.
During experiments we noticed that the result depended on the length of time water was kept under the pyramid. In 2009, Dmitrii Orlov performed a long-term experiment. Two liters of tap water were filtered and poured into two glass vessels filled to the top without extra air. Vessels were hermetically closed. One vessel was placed under the paper model of a Cheops pyramid oriented to the cardinal, and the other vessel was covered with black non-transparent cloth. Both vessels were placed on the top shelf of a cupboard and left intact for three months. Then the vessels were opened and water samples were measured in the following regime. A sample of water was placed in the EPC installation (Fig. 1) and measured 8 times for 25 s each with 5 frames per second intervals. Parameters were averaged on 8 measurements. This process was repeated 4 times. Results are presented in Table. 1.
As we see from Table 1, a statistical difference between samples was found for parameters Area and Intensity. We noticed that the water under the pyramid had a much higher Standard Deviation compared with the control sample. Of course, these results should be accepted as preliminary and anecdotic, and this topic needs much more time and research attention.
There are a lot of discussions about water structurization under the influence of internal inclusions. Structured water is characterized by ordering water molecules. That generally occurs next to hydrophilic interfacial surfaces, where layers of ordered water are found with properties that differ from those of bulk water (Chai et al., 2008). This water has physical properties that differ from ordinary bulk water (Wiggins, 2002). In particular, it has been observed that extended water clusters aggregating in an auto stabilizing network can grow to macroscopic proportions (Chaplin, 2000; Johansson, 2009). This leads to a formation of reactive oxygen species (ROS) in water (Voeikov, Del Giudice, 2009), which increases the concentration of free electrons in water and may result in an increased signal of stimulated photon emission registered by the EPC instrument.
A series of experiments was conducted by measuring EPC images of different water samples after immersing gemstones such as tourmaline crystals in water. The experiments were conducted both with tourmaline crystals of 3-5 carats and tourmaline crystal powder. The crystals were cleaned three times in alkaline solution, rinsed with distilled water and dried with warm air. The gemstones were obtained from the Himalayan region.
Table 1. Parameters of water kept under the pyramid compared with control samples. Data having 0.95 statistical differences in accordance with the Mann-Whitney test are marked with *.
|
|
|
|
Area |
Intensity |
Form Coeff |
Entropy |
|
1st series |
Pyramid |
Average |
1274* |
82.0* |
2.2 |
1.8 |
|
|
St Dev |
140 |
1.7 |
0.1 |
0.2 |
|
|
Control |
Average |
1567* |
86.2* |
2.2 |
2.0 |
|
|
|
St Dev |
57 |
1.7 |
0.1 |
0.1 |
|
|
2nd series |
Pyramid |
Average |
1321* |
82.0* |
2.3 |
1.8 |
|
|
St Dev |
123 |
1.4 |
0.1 |
0.2 |
|
|
Control |
Average |
1540* |
87.5* |
2.3 |
1.9 |
|
|
|
St Dev |
54 |
1.9 |
0.1 |
0.1 |
|
|
3rd series |
Pyramid |
Average |
1364 |
82.4* |
2.4 |
1.8 |
|
|
St Dev |
104 |
1.4 |
0.2 |
0.2 |
|
|
Control |
Average |
1497 |
89.0* |
2.2 |
1.9 |
|
|
|
St Dev |
54 |
1.6 |
0.1 |
0.1 |
|
|
4th series |
Pyramid |
Average |
1447 |
82.6* |
2.5 |
1.8 |
|
|
St Dev |
84 |
1.3 |
0.2 |
0.2 |
|
|
Control |
Average |
1506 |
89.9* |
2.3 |
1.8 |
|
|
|
St Dev |
48 |
1.6 |
0.2 |
0.1 |
Typical time dynamics of the EPC area are presented in Fig.13. The initial signal of mineral water has some dynamical character, which means a response of the water to the electrical field of the EPC instrument, which is typical for active natural waters. This type of dynamics is quite reproducible and after several seconds the EPC signal reaches a quasi-stable level. After the tourmaline crystals were immersed in water the signal increased and was kept for about an hour, after that it came to a quasi-stable level, significantly higher than the initial signal. Every curve of Fig.13 was taken with a new sample of water. The control sample of water had no significant difference from sample 1.

Figure 13: Time dynamics of the EPC signal of mineral water after tourmaline gemstones were immersed into the water. 1 – initial sample; 2,3 – 5 min and 30 min after placing the gemstones; 4,5 – 1 hour and 2 hours after immersing the gemstones.
As mentioned above, different mineral waters have a different time response to the electrical field of the EPC instrument. For example, Fig. 14 demonstrates time dynamics for a natural mineral water (curve 1) that is absolutely different from the one presented in Fig. 13. Fig. 14 demonstrates an example of the so named “water memory.” The tourmaline crystals were kept in the water for the duration of one hour, then they were removed, and during several hours, samples of water were taken for measurements. As you see from the graphs, for many hours after the crystals were removed from the water, the water had parameter values different from the initial EPC signal.

Figure 14: Time dynamics of the EPC signal of mineral water after the tourmaline gemstones were kept in the water for 1 hour and taken out. 1 – initial sample; 2,3 – 1 hour and 5 hours after taking out the gemstones; 4 – 9 hours after taking out the gemstones.
The presented results were repeated many times with different water, and in most cases immersing crystals into the water produced a significant effect. This confirms ideas of water structurization on crystalline surfaces with increased production of free electrons.
Nowadays, the EPC method is being used for testing different drinking water having similar chemical composition for its activity. At the same time, several research lines have been developed for studying different liquids, first of all blood.
Study of Blood with the “Suspended Drop” Method
After developing the technology for testing water, it was natural to apply it for different liquids, first of all blood. Several research lines demonstrated interesting results. In the work of Korotkov et al. (1998) blood plasma samples were taken from patients with primary and metastatic cancer (carcinoma of the stomach, carcinoma of the uterine cervix, broncho-pulmonary cancer, adenocarcinoma, etc.), and compared with control samples taken from healthy donors. Samples were also taken from a patient with a benign tumor.
The experiments were carried out in 1- or 4-well plastic plates containing 200 microliters each of blood plasma solution, diluted either in de-ionized distilled water (milli-Q Reagent Water System). Some plasma samples were examined in the fresh state and others after freezing and thawing. Ten series of two-fold dilutions were made, so as to result in a final concentration of total protein content of about 75 to 0.15 mg/ml. In some cases the dilution was continued so as to reach a concentration of 15 mg/ml.
It was found that the EPC characteristics of blood plasma samples were quite different for healthy donors than they were for patients with cancer. As the illustrations of Fig. 15 show, the EPC parameters varied with the dilution in an irregular way. No rule has been noted in the behavior of the curves. In all the samples studied, the EPC parameters were significantly and reproducibly higher for cancer patients as compared with the controls. Intermediate values were found for the patient with a benign tumor. Despite the irregular course of the curves, the difference between cancer and control was maintained throughout the dilution series. The observed differences remained unaltered by freezing and thawing. These results were statistically significant and reproducible. It is noteworthy that the differences became more significant after dilution and succussion than they were in the original plasma.
You may also see in Fig. 15 the repetitive “waves” area, the peaks being shifted as a result of one or two dilutions with every fresh sequential dilution and potentization. This kind of quasi-sinusoidal curve is typical for the reaction of biological objects to a variety of low-intensity stimuli. Such dose-response curves often reveal a complex polymodal character, and the presence of “dead zones.” In addition, an inversion in the dose-response to high dilutions is also observed in most experiments. This effect is well known, mostly in pharmacology and immunology (Froehlich, 1968; Hao, 1985). Among a number of explanations, it has been suggested that the effect is related to transmission of information via the molecular organization of water. Much evidence supports the hypothesis that water acts as the signal pathway for the effects of many low-intensity physical influences, such as weak electromagnetic and other fields.

Figure 15: EPC Area of samples of blood plasma diluted in NaCl with two-fold dilutions for healthy and ill patients.
We believe that the differences we have observed in the EPC images between normal and pathological blood plasma cannot be attributed to the known changes in the blood biochemistry characteristic of cancer. These include hypercoagulability, a low pH resulting from lactate produced by anaerobic glycolysis, together with a number of other homeostatic abnormalities. It seems virtually impossible to understand the effects described here without considering the role of the supra-molecular organization in the aqueous medium of the organism.
Since the organization of water is necessarily of a highly dynamic nature, one must consider that a body of water oscillates as a whole, so that any changes to the oscillatory pattern in one part of it will rapidly spread to the rest. This implies that the general oscillatory pattern of the water in an organism will be sensitive to any of a great variety of influences, even though they may occur at strictly localized sites. Thus it is to be expected that the effect of malignant transformation in any part of the body should be seen in the blood plasma. It is particularly significant that the difference between cancer and normal samples remained in evidence throughout the dilution series, even up to 1/1024 of the original plasma.
A new approach to a non-invasive diagnostic of allergy was developed by Sviridov et al. (2005).

Figure 16: Example of dynamical trend for two samples of blood: 1 – initial; 2 – with allergen.
The simple and non-invasive method we describe can be used for integral early diagnostic criteria and prognostic implications of pathological states of an organism, especially of a tumor transformation. This system could be further developed. Further detailed information may be obtained by means of an integrated analysis of all aspects of the image, including geometry, brightness, and spectral characteristics. It may then become possible to use the EPC method to classify the stages of progression of a malignant disease.
Analysis of Essential Oils
A large series of experiments with essential oils and their synthetic counterparts with identical chemical composition were conducted by a research team from AVEDA Co, USA (Vainshelboim et al., 2004, 2005). In this technique, a drop of oil was positioned on a glass plate with a hollow, and a metal electrode was touching the drop. The oils were analyzed in order to detect possible differences between oils that were obtained by means of natural and synthetic processes; between oils of organic and regular origin; between oils obtained in different climatic conditions and extracted by means of different methods; between oils with different optical activity; between fresh oils and oils that were oxidized by various methods.
The difference between the EPC area and the averaged intensity for the time curves was found for the 42 pairs of investigated oils and liquids, after about two seconds of exposure to the electromagnetic field. Again, for each pair of oils and liquids, they had similar chemical contents in accordance with the gas chromatography analysis, but each differed in origin. That is, for a particular pair of oils and liquids, both could have been sourced differently, or one liquid was synthetically derived while the other was naturally derived, and so forth. In all cases, however, no distinct difference was observed between the chemical spectra of the studied pairs of oils and liquids, in accordance with the gas chromatography data.
An example of this case-scenario is an investigation of Oil of Bitter Almond versus Synthetic Benzaldehyde. The analysis by gas chromatography (GC) has proven that both chromatograms for the respective materials are statistically identical. Specifically, Oil of Bitter Almond contains about 95.00% pure natural benzaldehyde, while Synthetic Benzaldehyde is 99.00+% to 99.5+% pure. (Information on Benzaldehyde (Product Numbers 41, 809-9 and B133-4) taken from the 2003-2004 Aldrich® Handbook of Fine Chemicals and Laboratory Equipment).
However, given this information, the GC analysis by itself has its limitations. That is, it cannot reveal the subtle differences between the two materials (however, once again, except under unique advanced techniques that are expensive, time consuming, and are not readily available). This is why the analysis by Dynamic GDV-graphy has been applied to this situation.
Fig. 17 shows a graph for the averaged intensity parameter for Oil of Bitter Almond and Synthetic Benzaldehyde. The graph clearly demonstrates that the average values show a statistically significant difference for the averaged intensity parameter after four seconds of measurements.
The main trends of these experiments for these two liquids revealed, for the averaged intensity parameter, a higher position of realizations for Oil of Bitter Almond and a lower position of realizations for Synthetic Benzaldehyde. In later experiments, it was shown that in terms of the area parameter, the trends were reversed for the same two liquids. That is, a higher position of realizations for Synthetic Benzaldehyde and a lower position of realizations for Oil of Bitter Almond were revealed in the case of the area parameter. Therefore, the results show that the same chemical ingredient in both materials (which is Benzaldehyde for this situation) can be distinguished from one another by using the Dynamic EPC-graphy.

Figure 17: Time dependence of the intensity of the EPC image around drops of Bitter Almond (1) and Synthetic Benzaldehyde (2) oils. Data averaged on 10 measurements.
In other studies, highly purified Citrus Natural and highly purified Citrusl Synthetic oils were used. Both oils abruptly changed their behavior in interaction with the electromagnetic field of the EPC instrument after about 2.5 seconds (see Fig. 18) and a statistically significant reproducible difference was detected between the synthetic and the natural Citrus essential oils.
Though the oils of Moroccan Rose, Bulgarian Rose, and Russian Rose are chemically similar, as can be seen, they were taken from different locations. During the initial moments of measurement, the time series for the area of each oil coincided. However, in less than one second, each of the curves began to deviate and differ in statistically significant ways from each other (see Fig. 19). In addition, no statistically significant difference between Moroccan Rose and Bulgarian Rose oils was found, but they both differed in statistically significant ways from Russian Rose oil.
Table 2 presents the list of investigated compositions with marked statistical difference in EPC parameters.
Table 2. Results of study of different pairs of oils.
|
The Individual Case Scenarios |
Area |
Intensity |
Oils of Essential and Synthetic Nature |
||
|
Bitter Almond versus Synthetic Benzaldehyde |
X |
X |
|
Linalool Synthetic versus Linalool Extracted from Bergamot |
X |
X |
|
Linalool Synthetic versus Linalool Extracted from Bois de Rose |
X |
|
|
Linalool Synthetic versus Linalool Extracted from Pinene |
X |
|
|
Linalool Synthetic versus Linalool Extracted from Shiu Oil |
X |
|
Oils of Organic and Regular Origin |
||
|
Peppermint Organic versus Peppermint Regular |
X |
|
|
Lavender Organic versus Lavender Regular |
X |
|
|
Cloveland Organic versus Cloveland Regular |
X |
|
|
Oils Received in Different Climatic Conditions and Extracted by Different Ways (Oils from Different Sources) |
||
|
Indian Jasmine versus Moroccan Jasmine |
||
|
Algerian Jasmine versus Indian Jasmine |
X |
|
|
Algerian Jasmine versus Moroccan Jasmine |
X |
|
|
Cold-Pressed Valencia FCC* Orange versus Midseason FCC* Orange |
X |
|
|
Cold-Pressed Valencia FCC* Orange versus Brazil Cold-Pressed High Aldehyde Content Orange |
X |
|
|
Brazil Cold-Pressed High Aldehyde Content Orange versus Midseason FCC* Orange |
X |
|
|
Bulgarian Rose versus Russian Rose |
X |
|
|
Bulgarian (Otto) Rose versus Russian Rose |
X |
|
|
Bulgarian Alba Organic Rose versus Russian Rose |
X |
|
|
Moroccan (Otto) Rose versus Russian Rose |
X |
|
|
Turkish Bulgarian Type Rose versus Russian Rose |
X |
|
|
Bulgarian Rose versus Bulgarian (Otto) Rose |
X |
|
|
Bulgarian (Otto) Rose versus Moroccan (Otto) Rose |
X |
|
|
Bulgarian (Otto) Rose versus Turkish Bulgarian Type Rose |
X |
|
|
Bulgarian Rose versus Bulgarian Alba Organic Rose |
No difference found |
|
Oils of Various Optical Activity |
||
|
Dextro Carvone versus Laevo Carvone |
X |
|
|
Dextro Limonene versus Laevo Limonene |
X |
|
|
Dextro Linalool versus Laevo Linalool |
X |
X |
Natural Oils: Fresh and Oxidized in Various Ways |
||
|
Lime Oil Italian Refrigerated versus Lime Oil Italian Oven Treated at 120°F |
X |
|
|
Lime Oil Italian Refrigerated versus Lime Oil Italian Xenon Arc Treated |
X |
|
|
Lime Oil Mexican Refrigerated versus Lime Oil Mexican Oven Treated at 120°F |
X |
|
|
Lime Oil Mexican Refrigerated versus Lime Oil Mexican Xenon Arc Treated |
X |
|

Figure 18: Time dependence of the area of the gas discharge image around drops of oil: Citrus natural (1) and Citrus synthetic (2). Data averaged over 10 measurements.

Figure 19: Time dependence of the area of the gas discharge image around drops of Rose oil of different origin. Data averaged over 10 measurements. 1 – Moroccan Rose; 2 – Bulgarian Rose; 3 – Russian Rose.
Conclusion
The obtained data shows that the electrophotonic method has high selectiveness and sensitivity when used for the study of liquid-phase objects, in particular for various types of water. The obtained information depends on the chemical composition of water, but the determining and the most curious dependency is the dependency on the structural composition of the liquid. The electrophotonic parameters are determined by the emission activity of the surface layer of the liquid, which depends on the presence of surface-active valences. This property is obviously determined by the structure of the near-surface clusters, which means that the electrophotonic method is one of the informative methods for the study of structural-informational properties of liquids.
Acknowledgment
The authors thank Gerald Pollack and Vladimir Voeikov for gainful discussions and Dominique Conseil for supporting the work.
References
Bell, I; Lewis, DA; Brooks, AJ; Lewis, SE; Schwartz, GE (2003). Gas Discharge Visualisation Evaluation of Ultramolecular Doses of Homeopathic Medicines Under Blinded, Controlled Conditions. J Altern Complement Med 9: 25-37.
Bundzen, PV; Korotkov, KG; Unestahl, LE (2002). Altered States of Consciousness: Review of Experimental Data Obtained with a Multiple Techniques Approach. J Altern Complement Med 8: 153-167.
Bundzen, PV; Korotkov, KG; Korotkova, AK; Mukhin, VA; Priyatkin, NS (2005). Psychophysiological Correlates of Athletic Success in Athletes Training for the Olympics. Human Physiology 31: 316–323.
Chai, BH; Zheng, GM; Zhao, Q; Pollack, G (2008). Spectroscopic studies of solutes in aqueous solutions. J Phys Chem 112: 2242-2247.
Chaplin, MF (2000). A proposal for structuring of water. Biophys Chem 83: 211-221.
Del Giudice, E; Vitiello, G (2006). Role of the electromagnetic field in the formation of domains in the process of symmetry-breaking phase transition. Phys Rev A. 74: 1-9.
Froehlich, H (1968). Long-range coherence and energy storage in biological systems. Int J Quant Chem 2: 641-649.
Gibson, S; Williams, B (2005). The effect of music and focused meditation on the human energy field as measured by the gas discharge visualization (GDV) technique and profile of mood states. Subtle Energies and Energy Medicine 16: 57-60.
Gudakova, G; Galinkin, V; Korotkov, K (1990). Study of the phases of the development of fungi CANDIDA by Gas Discharge Visualization technique (Kirlian effect). J Mycol Fitol 24: 174-179 (In Russ).
Hacker, GW; Pawlak, E; Pauser, G; Tichy, G; Jell, H; Posch, G; Kraibacher, G; Aigner, A; Hutter, J (2005). Biomedical evidence of influence of geopathic zones on the human body: scientifically traceable effects and ways of harmonization. Forsch Komplementärmed Klass Naturheilkd 12: 315-327.
Hao, BL (1985). Chaos. World Scientific: Singapore.
Johansson, B (2009). Effects of Functional Water on Heart Rate, Heart Rate Variability, and Salivary Immunoglobulin A in Healthy Humans: A Pilot Study. J Altern Complement Med 15: 871-877.
Korotkov, K (1985). Physical processes in sliding gas discharge. J Technical Physics Letters, 412: 67-70 (In Russ).
Korotkov, K; Gurvitz, B; Krilov, B (1998). New conceptual approach to the early diagnosis of cancer. Consciousness and Physical Reality 3: 51-58 (In Russ).
Korotkov, K; Korotkin, D (2001). Concentration dependence of gas discharge around drops of inorganic electrolytes. J Appl Phys 89: 4732-4737.
Korotkov, K (2002). Human Energy Field: study with GDV Bioelectrography. Backbone Publishing: NY. p. 360.
Korotkov, K; Krizhanovsky, E; Borisova, M; Hayes, M; Matravers, P; Momoh, KS; Peterson, P; Shiozawa, K; Vainshelboim, A (2004). The Research of the Time Dynamics of the Gas Discharge Around Drops of Liquids. J Appl Phys. 95: 3334-3338.
Korotkov, K; Bundzen, P; Bronnikov, V; Lognikova, L (2005). Bioelectrographic Correlates of the Direct Vision Phenomenon. J Altern Complement Med. 11: 885–893.
Korotkov, KG; Matravers, P; Orlov, DV; Williams, BO (2010) Application of Electrophoton Capture (EPC) Analysis Based on Gas Discharge Visualization (GDV) Technique in Medicine: A Systematic Review. J Altern Complement Med. 16(1): 13-25.
Ed. R.A. Chez (2002). Measuring the Human Energy Field: State of the Science. National Institute of Health, Samueli Institute: Maryland.
Rubik, B; Brooks, A (2005). Digital High-Voltage Electrophotographic Measures of the Fingertips of Subjects Pre and Post-Qigong. Evidence Based Integrative Medicine 2: 245-242.
Sviridov, L; Stepanov, A; Hlopunova, O; Koroktov, K; Ahmeteli, G; Korotkina, S; Kriganovski, E (2003). Registration of the agglutination reaction by Gas Discharge Visualization Technique. Modern Microbiology. Proceedings of the conference in Saint Petersburg, (In Russ): 32-33.
Vainshelboim, AL; Hayes, MT; Korotkov, K; Krizhanovsky, E; Momoh, KS (2004). Investigation of natural and synthetic flavors and fragrances using the dynamic gas discharge visualization technique. Proceedings of PITTCON Conference. Chicago. 149-150.
Vainshelboim, AL; Hayes, MT; Momoh, KS (2005). Bioelectrographic Testing of Mineral Samples: A Comparison of Techniques. J Altern Complement Med. 11: 299-304.
Voeikov, VL; Del Giudice, E (2009). Water Respiration – The Basis of the Living State. WATER 1: 52-75.
Wiggins PM (2002). Enzymes and two states of water. J Biol Phys Chem 2: 25-37.
Web References
1. http://korotkov.org/ [02.02.2010]
2. http://ktispb.ru/en/index.htm [02.02.2010]
Discussion With Reviewers
Louis Rey1: The problem of the existence of clusters in pure water is heavily challenged by serious scientists such as Teixeira and it should be noted that the Preparata / DelGiudice theories are not accepted amongst all specialists.
Korotkov and Orlov: The problem of the existence of clusters in pure water is one of the most interesting in water science. Theories of Preparata / Del Giudice provide a strong conceptual basis for understanding this problem. The model is published in several peer-reviewed international journals, and as we know, there are no serious objections of the developed concept. Of course, as with any theory, this is just a model, based on particular assumptions, and it may reflect some specific situations. At the same time, new data provides experimental support to this theory. In a recent paper, a big international team [http://www.pnas.org/content/106/36/15214] has written: “The present results provide experimental evidence that the extreme differences anticipated in the hydrogen-bonding environment in the deeply supercooled regime surprisingly remain in bulk water even at conditions ranging from ambient up to close to the boiling point.”
Rey: I have read Dr. Bell’s papers; their conclusions are not that clear.
Korotkov and Orlov: To my mind, the conclusions of Dr Bell et al. are quite clear. For example, consider our Results: “The procedure generated measurable images at the two highest voltage levels. At 17 kV, the remedies exhibited overall lower image parameter values compared with solvents (significant for Pulsatilla and Lachesis), as well as differences from solvents in fluctuations over repeated images (exposures to the same voltage).” And consider our Conclusions: “GDV technology may provide an electromagnetic probe into the properties of homeopathic remedies as distinguished from solvent controls. However, the present findings also highlight the need for additional research to evaluate factors that may affect reproducibility of results.”
Rey: What is the nature of the “contact” between the cylinder (2) and the EPC instrument (1)?
Korotkov and Orlov: The cylinder is positioned on the electrode surface and pressed to it by a metal spring to avoid any movements.
Rey: In the first paragraph of the Results section, what kind of “water” is referred to when you speak of two water samples, since distilled water is the reference?
Korotkov and Orlov: Two water samples were taken from the same bottle.
Rey:Under Fig. 6, you talk about “opening the bottle.” What do you mean by “opening the bottle”? In which surroundings (temperature T, light, relative humidity H, still or turbulent air, ratio R between the diameter of the bottle and the one of the opened neck?
Korotkov and Orlov: Experiments were conducted at room temperature conditions: T = 240C + 10C; H = 24%; still air; R = 5; deemed electrical light).
Rey: Several times I have been on top of the Teotihuacan pyramids, so I wonder how conditions, such as T°, wind, positioning outside or inside, etc., can be controlled during an overnight stay.
Korotkov and Orlov: We would reiterate what is written in the paper. These results should be accepted as preliminary and anecdotic, and this topic needs much more time and research attention.
1 Ph.D., Chemin de Verdonnet 2 CH, 1010 Lausanne, Switzerland. Correspondence: louis.rey@bluewin.ch, Tel: +41 21 652 09 66, Fax: +41 21 652 09 67