
 Anomalous “Living” Spectrographic Changes in Water Structures: Explorations in New Territory
DeMeo J1*
1 Director, Orgone Biophysical Research Lab, Ashland, Oregon, USA
* Correspondence email: demeo@mind.net
Keywords: Water spectroscopy, water activation, water structure, blue water, water fluorescence, Wilhelm Reich, orgone accumulator, healing water, life energy, cosmic ether.
Received: March 8, 2018; Revised: August 14, 2018; Accepted: September 14, 2018; Published: November 18, 2018; Available Online: November 18, 2018
Abstract
Unusual spectrographic signatures can be induced into water by radiant non-contact material-environmental influences. Far-ultraviolet (UV) absorption and near-UV/blue fluorescence properties were observed to appear in distilled water samples by charging inside the controversial Wilhelm Reich Orgone Accumulator (ORAC), where no chemical or material contacts were made between the charging ORAC device and the water being treated. Similar spectral absorbance and fluorescence reactions were identified in natural rainwater and snowmelt samples, being nearly identical in spectral properties to the ORAC-charged water samples. Spectral similarities, as found in other studies of water structure or activation – such as exclusion-zone (EZ) water samples, and in aqueous solutions of DNA – have also been identified. These repeating spectral absorbance and fluorescence similarities as found in such diverse experimental or natural influences, involving both direct physical contact and non-contact radiant induction, are postulated to indicate a substantive cosmic energy which infuses into favorably-exposed water. Widely-observed natural optical phenomena of a similar blue color, almost uniformly detected by spectral intensity measures suggestive of water-structure fluorescence reactions, but rarely considered as such, are also discussed. Examples include certain exceptionally blue mountain lakes, blue glowing atmospheres over certain mountain ranges, blue-glowing waters and hot springs with healing properties, and blue glacial ice blocks and snow holes, as observed under both direct sunlight and overcast conditions. Certain blue-glowing astrophysical phenomena are also considered, which take on a new light given the more recent discoveries on the abundance of water in the universe.
Introduction
Water is a reactive substance, whose unusual and life-giving properties have over millennia been articulated by poets, naturalists and scientists alike. Today, it is accepted that water is the “universal solvent” that also lays a basic foundation for life in conjunction with biochemical factors. Experiments at my laboratory over many years have expanded this general understanding into the realm of cosmic energy, or life-energy, at work within water, notably following on the track of 2oth century scientists such as Becker (1998), Gurwitsch (Beloussov et al. 2000; Beloussov et al. 2007), Brown (1975), Burr (1972), Piccardi (1962, 1965), Piccardi and Capel-Boute (1972) and Reich (1951, 1973a, 1973b, 1973c, 1973d). Their findings on bioelectric, bio-cosmic and life-energy, taken together, also share a close functional identity to the prematurely-discarded cosmic ether of space, which was in fact detected by numerous scientific investigators of the early-mid 2oth and early 21st centuries. (DeMeo 2011a, 2014, 2018; Galaev 2001, 2002; Miller 1928, 1933; Munera 2002; Munera et al. 2006; Web ref. 1; Web ref. 2) In my experimental investigations, these two factors, of biological energy and cosmic energy, find a common intertwined and perhaps inseparable meeting point in the study of water.
Notable for facilitating experimental investigations of water, life-energy and cosmic energy factors has been the controversial Reich Orgone Accumulator (ORAC), composed of alternating layers of ferromagnetic and dielectric materials, resembling a Faraday Cage or “hollow capacitor” (DeMeo 2010, 2013; Reich 1973b). This unique device – so widely slandered, with published literature on Reich’s findings banned and burned by government decrees on two continents – is today independently tested and proven to have energy-charging and other conventionally-unanticipated reactions upon living and non-living matter. Anomalies in physical factors within the interior space of the ORAC, such as temperature, humidity, evaporation, optics, electrostatics and radiation background counts, are also well documented. Summary overviews on this subject have previously been given (Baker 1980, 1982; DeMeo 2010, 2011b, 2011c, 2013, 2015; DeMeo and Senf 1997; Web ref. 9), presenting substantial new evidence confirming Reich’s original experiments and theory. Here, the subject is approached with fresh experimental evidence, using the tools of optical spectroscopy for both absorbance and fluorescence measures.
For example: Distilled water samples in open glass dishes, treated by placement inside the Reich ORAC, were found to acquire a far-UV absorption signature, with a complement near-UV/blue fluorescence reaction. Neither was significantly present in untreated Control water samples. Rainwater and snowmelt as captured from vigorous storms at the author’s West Coast high-altitude (1350 meters) laboratory, located in a pollution-free region of old growth forest, also showed similar spectral signatures. These spectral reactions are also similar in many respects to spectral reactions previously identified at the Gerald Pollack laboratory, in high-dielectric Nafion-exposed waters, acquiring the EZ exclusion-zone reaction. (Chai et al. 2008; Pollack 2013; Zheng et al. 2006) The spectral reactions are additionally similar to those found by biochemists in aqueous solutions of nucleic acids and DNA. (Lakowicz et al. 2001; Vaya et al. 2010) The ORAC and rain-snow waters are nearly identical in UV-absorbance and fluorescence wavelengths, but somewhat broader though inclusive of the absorbance and fluorescence frequencies observed in the EZ/Nafion and DNA studies. The effects induced by the Reich ORAC method are rather unique, however, in how they are generated without the treated water making direct physical contact with the materials composing the ORAC enclosure, ruling out conventional physico-chemical explanations. Radiating energy fields of a non-thermal, non-ionizing and conventionally mysterious nature are at work.
This view of water as a reactive substance to cosmic energetic factors, which may then develop stronger self-organizing properties when exposed to the interior of the ORAC enclosure, finds some verification in studies on the reactivity of water to such things as sonoluminescence, homeopathic shaking, and other mechanical influences. Belovolova, et al. (2009) have summarized some of this evidence, noting that the “intensity of UV luminescence decreases with water purification” and that while humates and other organic compounds in natural water tend to yield a natural UV fluorescence, “it seems impossible to explain all features of fluorescence of aqueous media only by the presence of impurities”. My investigation specifically used distilled water, and studiously avoided mechanical, sonic or electromagnetic influences (other than unavoidable weak 60 Hz EMF affecting both ORAC and Control), guarding against such factors. As shown in the results given below, serious questions are thereby raised: How could distilled water resting in a glass dish and merely allowed to sit inside the ORAC-chamber for a few days in an electromagnetically quiet room, develop pronounced spectral signatures similar to those created by strong mechanical forces, or by physico-chemical factors as discussed below, while identical distilled water kept under a cardboard box nearby did not?
My findings, a product of the theoretical structure firstly proposed by Reich but not limited to him, affirm an unorthodox interpretation of water “structure”, as a special charged-excited condition whereby water gains specific unusual cosmic-energetic and probable self-organizing properties from varied influences. These influences notably include energy fields operative over short distances in laboratory apparatus, and by radiant transmission through the open air (ORAC). From these findings, it is inferred and postulated that these effects, and other unusual spectral laboratory reactions (EZ water, DNA water), plus rare bluish-glowing water-related phenomena observed in nature – such as blue luminescent snow holes, glacial ice blocks, high-altitude lakes and bluish low-level “transparent fogs” or energy-fields surrounding mountains – may have a similar cosmic-energy charged-excited water absorbance/fluorescence mechanism, beyond conventional theory. One critical clue in this new interpretation is the widespread use of spectroscopic intensity values in the development of conventional theory. Measures of optical intensity do not discriminate between their causation and can be due to Rayleigh scattering, preferential red-frequency absorption, or the result of fluorescence reactions in the water or ice samples being measured. This latter mechanism, of causally-coupled absorbance and fluorescence, is rarely mentioned in the water- or ice-color analyses I have consulted, but is an equally possible mechanism. The conventional explanations are therefore not unequivocal.
Methods
Spectrographic Instruments and Calibrations
The spectrographic absorption experiments reported here, which began in 2010, used an Ocean Optics spectrometer (model USB4000 UV-VIS) with a range of 210-900 nm, with a 0.2 nm sensitivity. For absorbance measures in distilled water, which is exceedingly transparent, the 1 cm light-path of the usual spectrometer was inefficient for acquiring the best results. Instead, cylindrical 10-cm cuvettes with UV-transparent quartz glass end windows were employed (Starna Cells, model 34-Q-100). UV-transparent “solarized” fiber optic cables connected the light source and spectrometer through a special cradle for the 10 cm cuvettes (Ocean Optics CUV-UV-10). Each absorbance graph reflects a 10-scan average, with 20 data-point smoothing. Figures 1 and 2 show these apparatus.
For fluorescence measures, which began later in 2012, the sensor portion of the same USB 4000 spectrometer was used, but with a different and more intense stand-alone UV-VIS light source (Ocean Optics DH-2000) with separately activated deuterium and halogen light bulbs, as seen in Figure 3. A 90-degree fluorescence cuvette holder (Ocean Optics CUV-ALL-UV), and quartz fluorescence cuvettes (Starna Cells 3-Q-10 or 23-Q-10) were employed. Maximum diameter “solarized” fiber-optic cables (600-25-XSR) were used. Even with the more intense light source, fluorescence scans of highly transparent water in 1-cm fluorescence cuvettes required operating the spectrometer at its highest sensitivity, of 1000 milliseconds per scan, 100 scan-averages, and 20 data-point smoothing. For the fluorescence experiments reported here, in all cases only the deuterium bulb was activated.
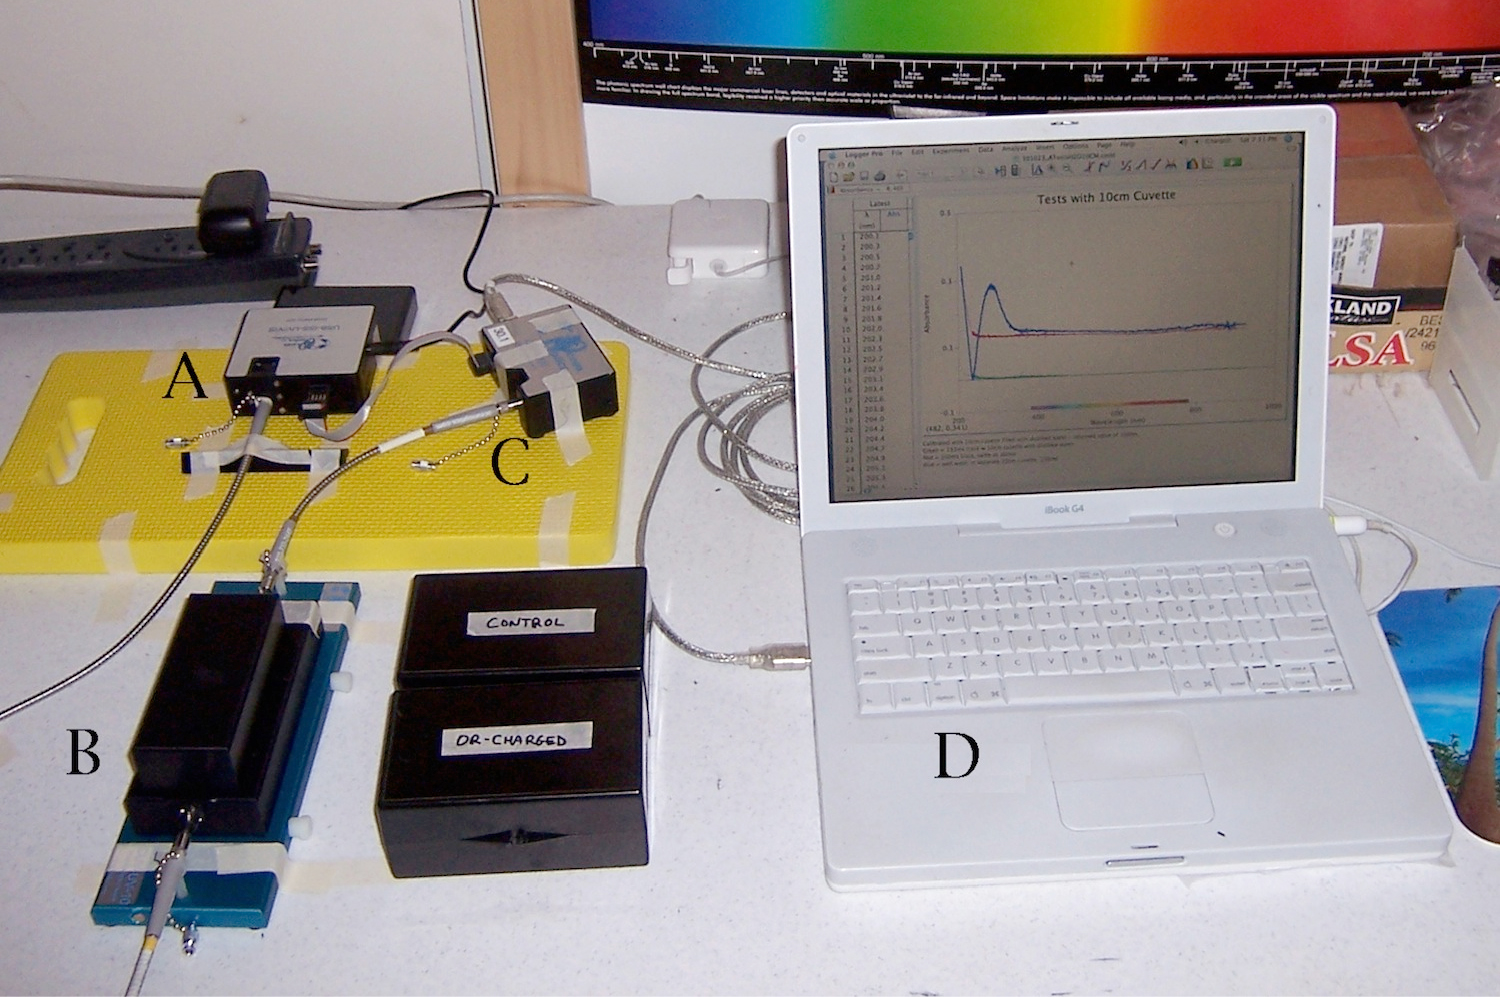
Figure 1. Setup for Spectral Absorption Experiments. Light source “A” connects by fiber-optic cables to 10 cm cuvette cradle “B”, which then connects by additional fiber-optics to spectrometer “C”, which then feeds its data to computer “D” for acquisition and graphical display.
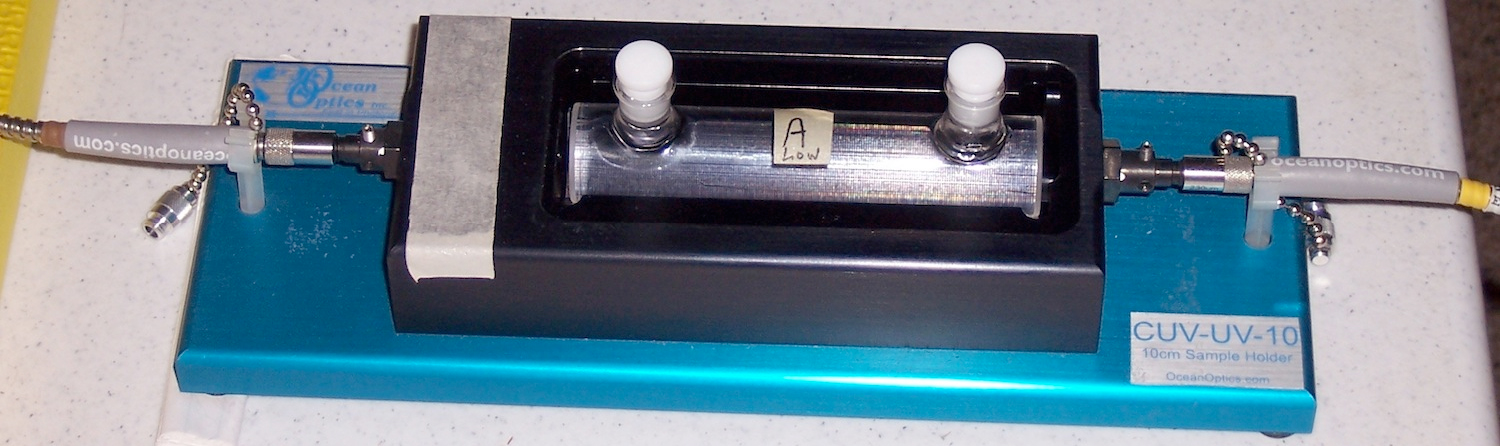
Figure 2. 10-cm Quartz End-Window Cuvette, in special cradle connected with fiber-optics. A light-tight cover is placed over the cuvette cradle (see item “B” in Fig.1).
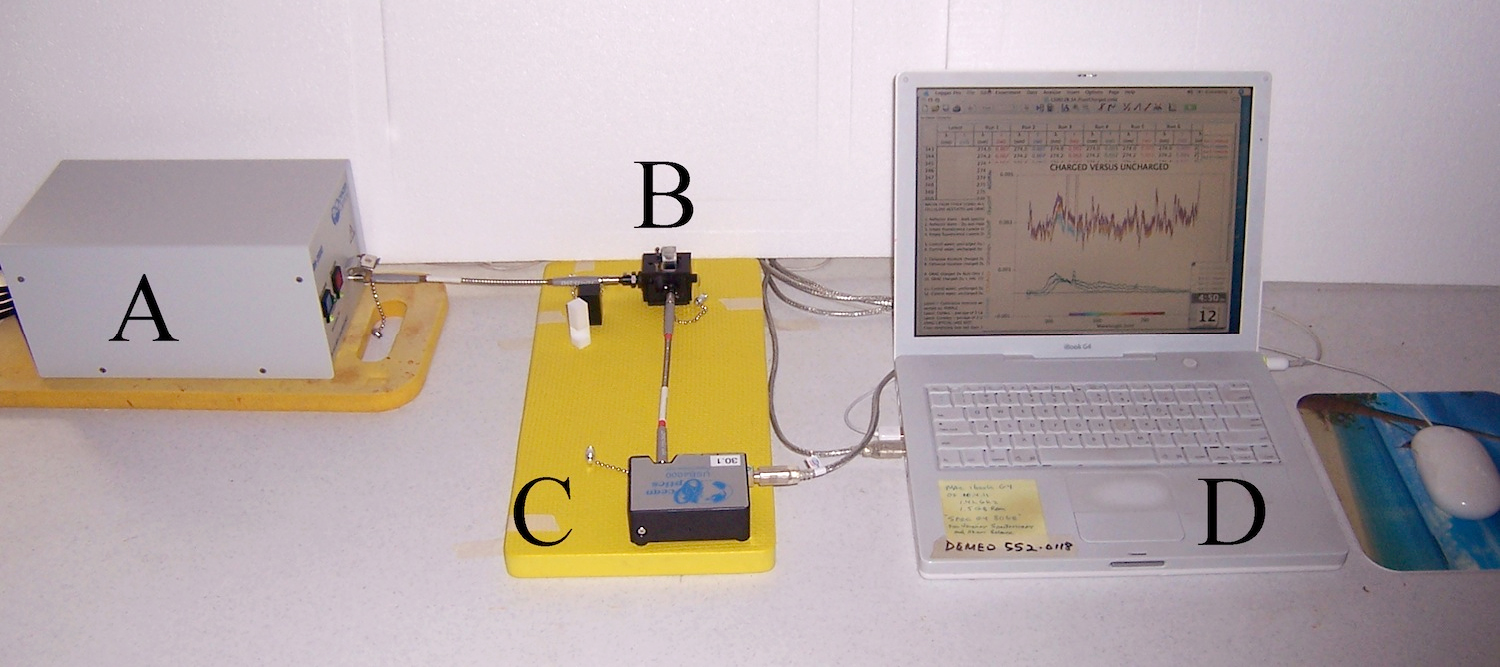
Figure 3. Setup for Spectral Fluorescence Experiments. Light source “A” connects by UV-transparent “solarized” fiber-optic cable to 90˚ fluorescence cuvette cradle “B”, which connects by fiber-optics to spectrometer “C”, which then feeds data to the computer “D”. Vernier Scientific’s Logger Pro software was utilized for data capture and graphing, on a Mac G4 running OSX 10.4.11 for both absorbance and fluorescence measures.
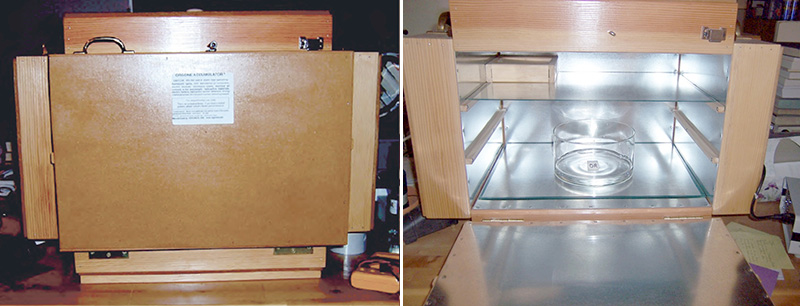
Figure 4. The ORAC-Charger Enclosure used for these experiments. The door for the ORAC opens downwards in this design.
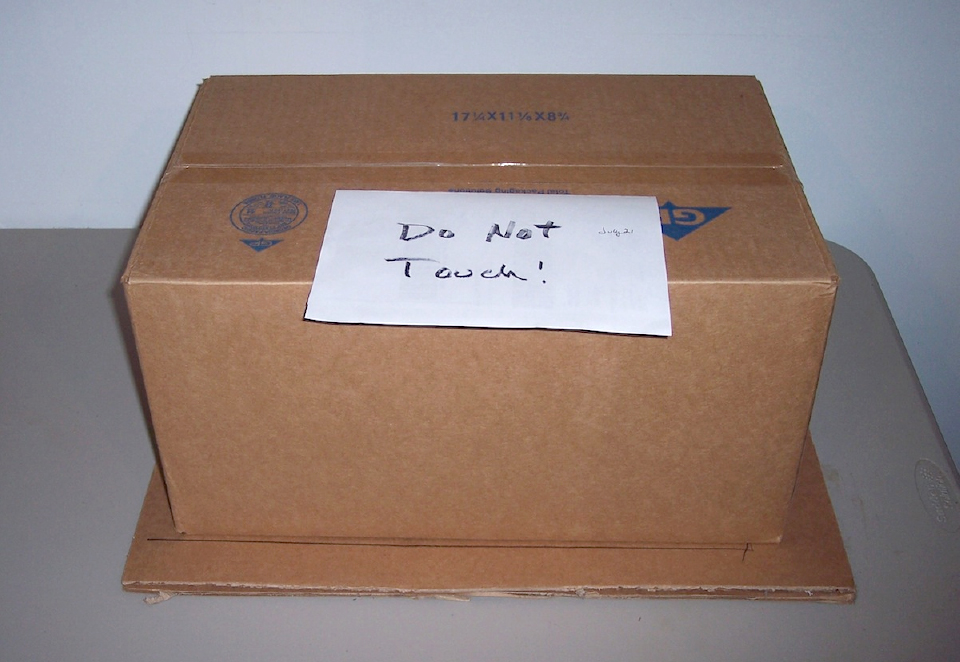
Figure 5. The Cardboard Control Enclosure. It must be placed on a thick cardboard sheet, to insulate against possible dielectric or metallic influences from the table upon which it sits.
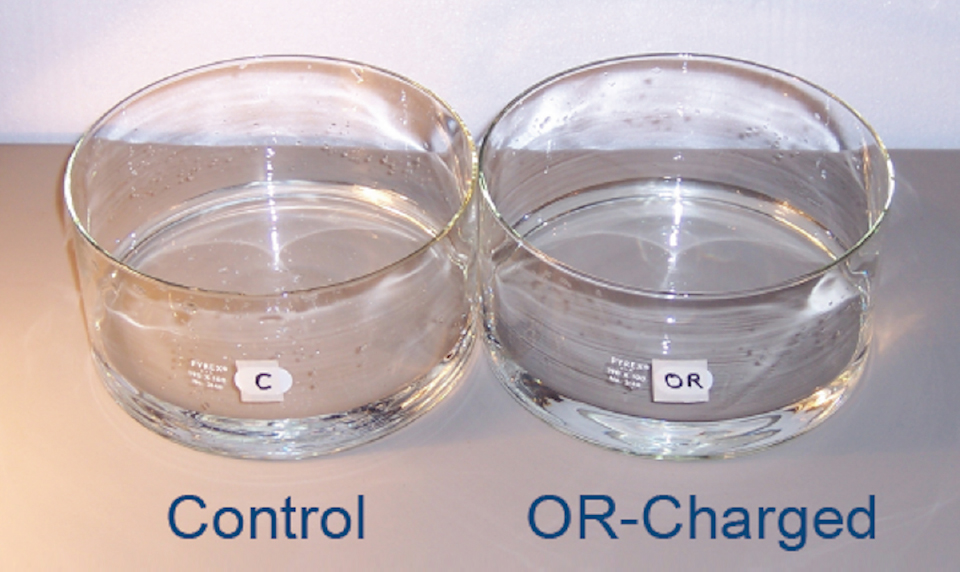
Figure 6. Glass Evaporation Dishes. 190mm diameter x 90mm height, one for experimental ORAC charging, one as a Control, each holding ~400 ml of distilled water, to an identical depth of ~2 cm.
The Orgone Energy Accumulator (ORAC)
For the experiments discussed in this section, a special 10-ply ORAC was constructed on special order from the Orgonics company in California (Web ref. 3), staying close to Reich’s original construction materials and protocols. Shown in Figure 4, it was dubbed the “Pizza Oven ORAC” given its wide and flat shape with fold-down door. Figure 5 shows a typical cardboard box, of nearly identical volume and shape to the interior of the ORAC, used as a Control enclosure.
The table upon which the Control and ORAC enclosures are sitting, and any nearby walls, should never be composed of metal, which creates its own radiant field effects. Likewise, in the case of plastic-coated or plastic-molded tables or wall materials, a thick cardboard sheet covering must always be used at the base of the Control box, to insulate against possible dielectric-radiant influences upon the Control water.
These issues of direct radiant-field induction of spectral changes in water were explored and documented in my early experiments. While the results of those early experiments have been only minimally reported (Web ref. 4) it is clear that such metallic and dielectric radiant fields and influences exist, and sometimes can exert a strong influence upon water’s spectral properties. The use of layered ferromagnetic and dielectric materials by Reich in the construction of the original ORAC device was an empirically-developed special case, whereby such radiant-field properties are optimally combined. In all my experiments with various combinations of metals and dielectric materials, nothing has ever been found which matches or exceeds the energy-charging and biological growth boosting properties of the original Reich ORAC.
Two open-faced evaporation dishes are used to hold the experimental water, one of which is placed inside the ORAC, the other under the inverted cardboard Control box, sitting on a cardboard sheet during a given experiment.
For all such experiments, one wishes to have the sample object – distilled water in this case – to be no more than ~10 cm from the walls, floor and ceiling of the ORAC, as the intensity of the ORAC radiation is diminished by distance from those surfaces. Smaller objects should be charged inside smaller ORACs, larger objects in larger ORACs. Or, a small ORAC can be nested inside a larger one, for greater effect.
Construction of the ORAC Enclosure and Environmental Factors
Full details for construction and optimal use of the authentic Reich ORAC have been described elsewhere. (DeMeo 2010; Web ref. 5) Due to general unfamiliarity with Reich’s authentic research and investigations, the most salient points may be summarized:
The ORAC is generally a box-like enclosure, made from separate wall panels, each of which is constructed using thin wood frames. The interior facing surface of each wall panel is given a layer of galvanized steel sheet of <1 mm (26-27 gauge) thickness. The exterior face of each wall panel is covered with a thin layer of organic or insulating material composed of compacted natural fiber, such as ~6 mm (1/4 inch) thick mason-board. The inside of each wall panel, between the steel and mason board faces, are filled with alternating layers of fiberglass fluff or minimally-processed sheep’s wool fluff, and steel wool; ten interlaced pairs or “plys” of each in this case. The “fluffiness” of the interior materials appears important, beyond the dielectric properties of the fiberglass or sheep’s wool, perhaps due to the dielectric properties of the trapped air.
Stronger ORACs can be made by using thicker wall panels and adding additional ply layers, though the effects are not strictly additive. In my experience with seed-sprouting and electrostatics experiments, a 3-ply or 5-ply ORAC will generate a charge around 70% as strong as a 10-ply ORAC. An exterior coating of natural shellac is generally added to the outward-facing exterior of the mason board, to increase the dielectric absorbance. Cylindrical ORACs can also be constructed, by spiral-layer wrapping of the correct materials, such as thin steel sheet curved into a cylinder, with added layers of sheep’s wool or fiberglass with steel wool; similar-layered flat panels are then added to the cylinder ends, following the same general rules as given above.
It is critical to follow the protocols for good ORAC construction materials, as deviations into untested materials generally reduce or even erase the desired effects. Copper and aluminum, for example, must be strictly avoided as they are known to yield toxic biological effects when used in the ORAC, as do some non-metallic components such as polyester or Styrofoam. (Reich 1951; DeMeo 1975, 2010; Web ref. 4)
One must also sharply distinguish the authentic Reich orgone energy accumulator from the myriad of pendant-trinkets and “orgonite” pyramid-junk sold on eBay or in New Age shops, promoted with fantastic claims. Today these are often being wrongly called “orgone accumulators” with Reich’s name and terms fraudulently attached to them. (Web ref. 6) Neither can the maliciously deceptive and repetitive slanders from the mainstream media, medical societies, “skeptic clubs” and Food and Drug Administration be trusted. (DeMeo 2013; Web ref. 7) They and websites like Wikipedia also incessantly distort Reich’s science and biography, systematically censor out peer-reviewed experimental verifications, and additionally celebrate or rationalize the burning of his books. (DeMeo 2013; Web ref. 8) Reich’s authentic orgone energy and orgone accumulator are sound scientific discoveries as described in his publications and other sources. (DeMeo 2010, 2013; Reich 1951, 1973b, 1973c; Web ref.9)
For the best, most optimal results, the ORAC experiments also should be undertaken in an electromagnetically-quiet environment, away from “electrosmog” wifi, computers, pads, fluorescent tubes (straight or curly), RF-emitting LED light bulbs, power-line fields, and radiofrequencies as from microwave ovens, cell-phones and towers, and “smart” meters. Atomic radiation above background levels also can disturb the ORACs functioning, as noted by Reich and in my own experiments. The ORAC should not be situated anywhere close to an x-ray machine or strong radioactive isotopes, and even a radioactive smoke detector overhead can give problems in ORAC experiments. (DeMeo 2010; Web ref. 5)
Altitude also appears to be an important factor, both height above the ground-surface, and absolute altitude. Miller’s most significant ether-drift experiments were undertaken atop Mt. Wilson. (Miller 1933; Galaev 2001, 2002) Piccardi noted altitude effects in his cosmically-reactive chemical tests. (Piccardi 1957) Reich’s orgone energy observatory was located in a forested mountain region of rural Maine, away from the city, and his work proceeded at a time before so many electromagnetic communications exploded into society. He nevertheless wrote about the disturbing effects from sparking motors, fluorescent lights and atomic radiation as they affected ORAC functions. (Reich 1951) As noted above, my own laboratory is located in a similar high-altitude forested environment, with very low electromagnetic disturbances, for similar reasons. (DeMeo 2010)
Within limits, however, one can compromise on some of these factors and still obtain powerful results. Or one can construct an “oasis effect” of protected environment within a building or laboratory, if care is taken. (DeMeo 2010) The problem is somewhat comparable to the city-bound astronomer who wishes to take the best-quality photographs of a distant object in space. They can make a photograph through the telescope of a deep-space object from a low elevation location, in a bright city environment. However, such an astro-photo would be of limited contrast and resolution, and not be half as good as if obtained from a dark rural location, or from a mountaintop observatory.
I have written elsewhere about such Optimal Orgonotic Conditions (DeMeo 2010, Web ref. 5) as are necessary for the serious experimental scientist who wants the best possible results. A less-than-optimal location may produce good and replicable effects as described here, but if not, then one must default to the stricter protocols. In some respects, the older laboratory environments of the 1950s – with incandescent lights, natural wood materials for the building walls, roof and tables, and no computers or other EMF contamination – were optimal for undertaking these experiments, more so than the modern “high-tech” and often electrosmog-contaminated laboratory of today. The concept of the “old barn in the woods” as developed within the field of bau-biologie, or “healthy-house” investigations, come to mind. (DeMeo 2010)
Once these construction-material and environmental precautions are taken into account, when a sample of distilled water is charged inside the ORAC, specific spectrographic absorbance and fluorescence signatures not originally present will appear, generally within a few days. The effect is substantially reproducible if the protocols are followed, though the ORAC itself has dynamic properties, in how it functions best under sunny and dry, low-humidity conditions. Rainy or overcast conditions with humidities higher than 50% reduce its energy-accumulating capacities. Given the intensive rains and snowfall at my laboratory in the winter months, with the exception of periods of clear sunny days, or when making spectrographic study of rainfall and snow-melt, these experiments were mostly halted, and confined to dry periods of the year.
In my protocol for ORAC-charging of pre-tested distilled water (described below, in the next section) flat-bottomed evaporation dishes measuring 190 mm diameter x 100 mm height were used, one for ORAC charging, one as a Control, each with ~400 ml distilled water added, to an identical depth of ~2 cm. Once the evaporation dish with water is placed inside the ORAC, its door is shut during the experiment. The cardboard Control enclosure, with an identical evaporation dish of water from the same jug of distilled water, was placed on a thick cardboard sheet on a table, then covered with an inverted cardboard box of similar interior dimensions to the ORAC. Both ORAC and Control were located within the same laboratory room, separated apart by several meters. Light was controlled for by draping opaque black plastic sheet (4-mil.) over both the ORAC and the cardboard Control box, to make them identically dark.
Possible air mixing was controlled by making identical narrow gaps in the door closure of the ORAC and under-box space of the Control (wood matchsticks were used as spacers, for uniformity), even though there was no appreciable air movement within the laboratory. Windows were kept shut except for a narrow air gap of ~2 cm to allow for slight natural ventilation, and curtains drawn to create a somewhat darkened space. Only incandescent or halogen light bulbs were used in the laboratory room, turned on only when entering to make the measures. The spectroscope was located in an adjacent room, such that the computer and electronics would not disturb the ORAC or Control. The only material the water came into direct contact with was the glass evaporation dish, and the air within each ORAC and Control enclosure.
Necessary Pre-Testing of Distilled Water Sources
The experiments reported here used only distilled water for experimental testing, in plastic jugs as purchased from local grocery or drug stores, in efforts to acquire a stable uniform source. However, these distilled water sources posed special problems, requiring spectrographic pre-testing of each jug of water, given how some distilled water jugs were found to already possess a weak ~275-280 nm UV-absorption signature. A similar spectral absorption signature was also previously identified in our local well water, and in commercial bottled drinking waters, from clean natural wells or springs, but not reported here. (Web ref. 4)
To ensure a truly “inert” distilled water sample, lacking in any significant pre-existing UV absorption, I recommend the following pre-screening protocol.
1. Obtain around ten different 1-gallon distilled water jugs, from different stores and of different brands. Each must be independently subjected to spectroscopic analysis as calibrated against an empty cuvette. First make your empty-cuvette calibration. Then prepare to make scans of the different distilled water sources. Given how some spectroscopes will return only a zero value for scan data below the empty-cuvette calibration value, the scan milliseconds on your spectroscope may have to be adjusted to a slightly lower setting, such that all of the data from the cuvette with distilled water will be visible. This is because light passing through a glass-air interface is scattered more strongly than through a glass-water interface. This procedure will allow the selection of distilled water jugs with the lowest possible absorption across the UV and visible frequencies. Once identified, that source is used for the full run of the experiment.
2. One may also try reagent-grade, distilled-deionized water from a commercial laboratory supply source, but my experience is they are no better than grocery store distilled water jugs, which must undergo rigorous FDA-sanitation procedures. In two cases, I obtained distilled lab-grade water in special “inert” plastic bottles. (Hanna Instruments #70436, Global Cell Solutions #GSP-0400-506) After testing, I found they were no more or less likely to possess a pre-existing low-level UV-absorption than grocery store distilled water. However, since one gallon of the reagent water cost 50 times as much as a gallon of ordinary distilled water from the local grocery ($50 versus $1), the reagent water was never used aside from my investigation of it. Nevertheless, this procedure provided further evidence that the special UV absorption signature observed in the ORAC-charging experiments (reported below) was not due to mineral or chemical contamination.
3. By trial and error, it was determined the selected low-absorption water had to be kept in its sealed jug thereafter, and stored in a dark corner of the lab on a non-metallic and non-dielectric surface. Placement of that water container on a wooden or wood-carpet floor, away from sunlight, plastics or metals, was optimal. Dielectric and ferromagnetic materials, such as metal or plastic tables, had previously proven able to induce a low intensity UV-absorbance signature into water containers, requiring precautions. In this manner, those jugs lacking the spectral signature can be kept “inert” for months at a time, without inadvertently acquiring such a spectral signature.
4. Once the pre-tested distilled water jug lacking the spectral signature is identified and selected, equal quantities of that water jug are portioned out into the two evaporation dishes, gently with minimal turbulence. Bubbling, shaking or stirring of the distilled water as it goes into or out of the evaporation dish is also a factor to be avoided, given how those may induce weak UV-absorption signatures, as my control experiments and those of others have suggested. The water must be treated gently, with recognition of its excitable qualities, as if dealing with a living organism. Also see Belovolova et al. (2009 and De Ninno (2013) on this point.
5. After all the above procedures, and as a final double-check before the start of each experiment, a water sample is taken from each of the two prepared evaporation dishes – ORAC and Control – using a large-volume pipette able to hold the ~50 ml of water necessary to fill the 10-cm quartz cuvettes, or the smaller quantity 1-cm quartz fluorescence cuvettes. The two water samples are then subjected to a comparative spectral analysis. When properly done at the start of the experiment, a calculated differential of the two spectral curves should show only a flat line, indicating no spectral differences are present.
6. With the above pre-check procedure recording the absence of any significant differences between the two samples, the evaporation dishes with water are then carefully placed into their respective enclosures, the ORAC-charger and Control cardboard box. The enclosures with their water samples inside are then allowed to sit undisturbed for a few days or longer, after which another water sample is taken from the evaporation dishes, and once again subjected to spectral analysis. The same cuvette was used in all the given spectral scans, and always rinsed with additional distilled water after each water evaluation, then tipped over in a cradle without stoppers for drainage and air drying.
It is important to keep in mind that the Reich ORAC does not “generate” nor “create new energy” inside itself that does not already exist. It merely attracts into itself and amplifies within its interior a pre-existing energetic property already present within the atmosphere, and also by inference in cosmic space. Similar ideas were independently arrived at by other investigators (Piccardi 1962, 1965; Piccardi and Capel-Boute 1972) on the question of cosmic forces affecting the outcomes of chemical and water phase-change experiments. Miller (1928, 1933) posed similar arguments about the ubiquitous cosmic ether of space. A discussion has already been given (DeMeo 2004) identifying the correlated cosmic vectors from the Piccardi and Miller experiments to the experiments of Reich (1973c).
One additional factor must be kept in mind for the ORAC experiments. Depending upon the duration of the experiment, the energy charge in the local atmosphere will not only provide the ORAC with its charge, but may also slightly affect the Control water sample as it sits on a table under a cardboard box, even if isolated from nearby dielectric or metal materials. On occasions, I observed the control water sample, after some days, acquired a similar UV wavelength absorption as the ORAC-charged water, but always at a much lower intensity. Examples of this are given below, in Figures 9 and 10. Belovolova et al. (2009) also mentioned similar issues with respect to distilled water spectroscopy.
While I tried different methods over the years for ORAC charging of water, the method described here – precise construction of the ORAC and Control; pre-tested distilled water jugs; water samples placed in open glass evaporation dishes – was my final protocol, and yielded the most reproducible and meaningful results.
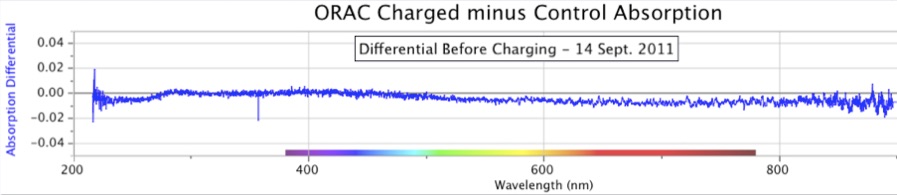
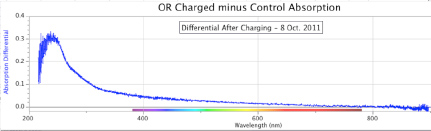
Figure 7. ORAC-Charged Water Absorption Minus Control Water Absorption, at the start of the experiment (top) and after 24 days of charging (bottom). Before the ORAC water was charged, both ORAC and Control water samples yield nearly identical absorption spectra, close to zero across a wide range. After the ORAC water was charged, it acquired a strong absorption in the UV wavelengths, while the Control water did not change significantly. The peak absorption differential is at ~240 nm, with a slight shoulder apparent at ~280 nm.
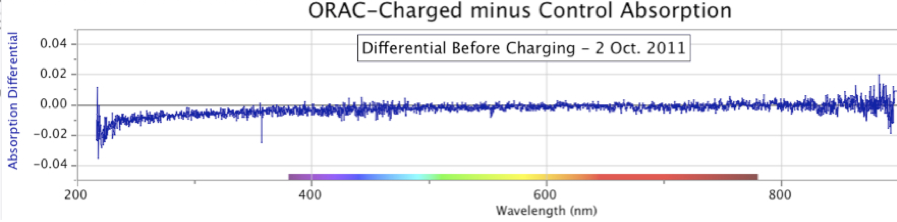
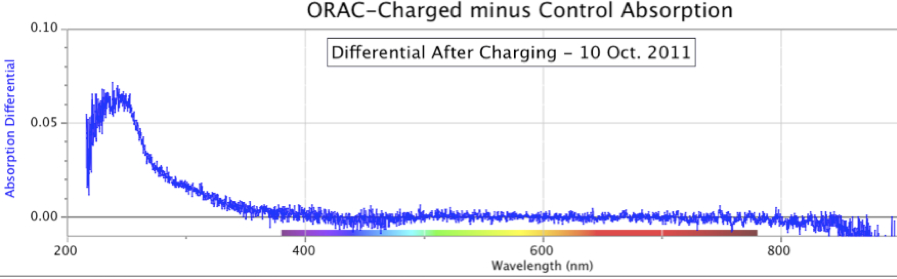
Figure 8. ORAC-Charged Water Absorption Minus Control Water Absorption, at the start of the experiment (top) and after 8 days of charging (bottom). A smaller differential was observed after fewer days of the experimental run, by comparison to Figure 7 above. The peak absorption differential is also ~240 nm, with a slight shoulder apparent at ~280 nm.
Results: ORAC-Charged Water Absorbance
Figures 7 and 8 show two early examples of spectral absorbance increased by the ORAC-charging procedure. In both cases, the flat-line differentials prior to charging are seen in the upper portions of each figure, indicating no differences between the two water samples, ORAC and Control, before the experiment began. The lower portion of each figure shows the result after 24 days and 8 days of ORAC charging, respectively. The peak wavelength of differentials in both figures is ~240 nm, but their intensities are quite different. The Figure 8 experiment ran for only 1/3 as many days as the experiment in Figure 7, and thereby showed an intensity of slightly less than 1/3rd of the values in Figure 7.
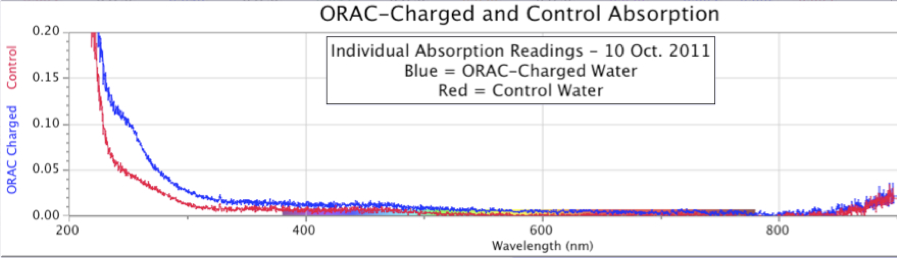
Figure 9. Spectrographic Signatures in Control and Orgone-Charged Distilled Water Samples. This figure reproduces data from Figure 8, but shows individual ORAC-charged (blue) and Control (red) spectral scans. 8 days of charging, October 2011.
An expanded view of Figure 8 provides additional information, as seen in Figure 9, showing the individual spectral absorption graphs for the ORAC group and the Control. In this case, both test scans show a broad UV absorption that soars to higher intensity at shorter wavelengths, stronger in the ORAC-charged water from around 230-300 nm, but both curves coming close together near to 220 nm.
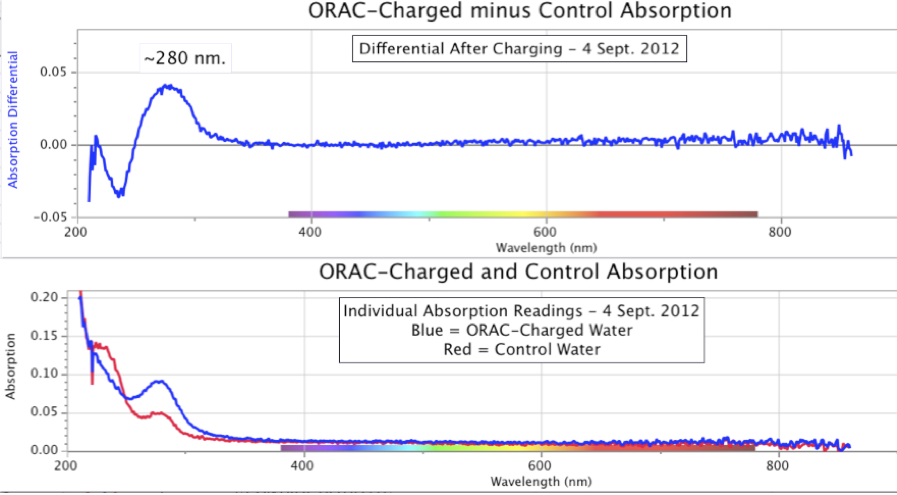
Figure 10. Spectrographic Signatures in Control and Orgone-Charged Distilled Water Samples, with differential, after 2 days of charging, early September 2012.
There are variations to be anticipated. Figure 10, for example, shows an experiment deliberately run over an even shorter time period, of 2 days.
The lower graphic in Figure 10 indicates a peak at the ~280 nm wavelength, for both ORAC-charged and Control, though the ORAC-charged group peaks at about twice the intensity at that wavelength. The differential also maintains the same ~275-280 nm peak, while lower UV wavelengths show a merging of ORAC and Control. Had this experiment run for additional days, it would likely have shown something closer to Figure 9.
In all the ORAC-charging experiments I ran on the clear sunny days of lower humidity, the ORAC-charged water always showed a stronger absorption than the Controls across the far- and mid-UV ranges centered on 275-280 nm. As such, the differential calculation indicates that water is influenced by the ORAC device in a manner not anticipated if that device is considered to be an empty container resting within an atmosphere devoid of any unusual cosmic or energetic properties.
Additionally, the absolute measures must be viewed with appreciation for their dynamic behavior. The length of time the experiments run is a significant factor in the overall shape of the spectral absorption curves, as well as their intensities. In most cases of longer charging periods, the ORAC-Charged water spectra, and the Control to a significantly lesser intensity, show an upwards slope towards increased UV absorption at wavelengths below ~280 nm. Water has a natural but somewhat variable sharp increase in UV absorption at wavelengths below ~190-220 nm. The ORAC charged water measurably shifts this natural cut-off slope into longer wavelengths closer to ~300 nm, increasing in intensity the longer the duration of exposure. Water then absorbs UV wavelengths that usually would pass through it unobstructed. As noted, however, the ORAC always out-performed the Control water in yielding stronger UV absorption intensities.
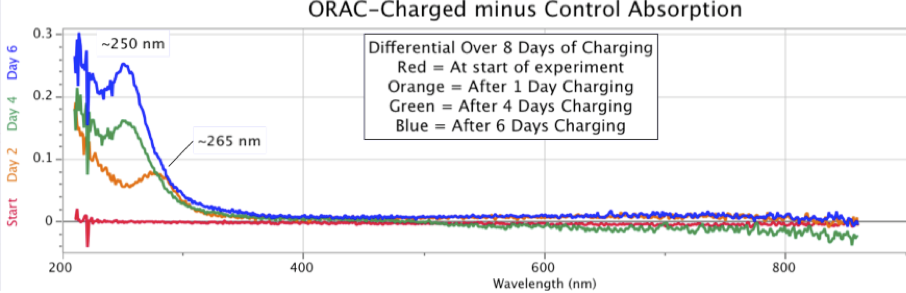
Figure 11. Changing Shapes and Increasing Intensity of ORAC-Charged Distilled Water Spectral Absorption Minus Control Water, over six days in early September 2012.When this experiment was allowed to run for even longer periods, the results continued to show an increase in absorption intensity of the ORAC-charged sample. Figure 12 below is a case in point, showing a dramatic increase in distilled water UV absorption where the water samples were allowed to remain in their respective ORAC-Charger and Control enclosures for 41 days, from August 4 to September 14, 2014.
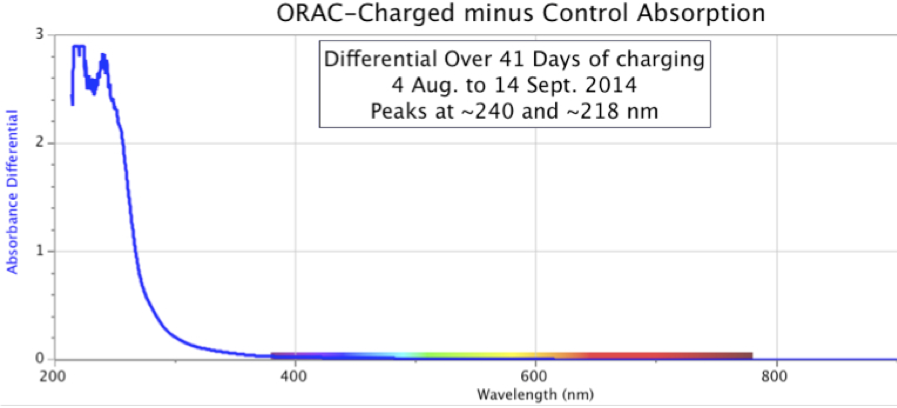
Figure 12. Absorbance Spectra of Orgone-Charged Distilled Water minus Control, over a period of 41 days.
This point is clarified in Figure 11, started on September 2, 2012, with sequential absorption measurements over 6 days. As seen in this figure presenting the differentials, the ORAC-Charged water sample continued to outpace the Control sample, yielding a changing shape of the spectrographic UV absorbance differential.
In Figure 12, the differential between the ORAC-charged water and Control water reached a magnitude of 3.0 absorption units, the upper limit of the spectrometer. By comparison, the spectral graphs in Figure 11, with a shorter charging time, show a maximum intensity of only 0.3 absorption units.
Again it must be emphasized, the distilled water in these experiments was never in direct physical contact with anything other than the glass of the evaporation dish, the atmosphere within each enclosure (ORAC versus Control), and the same distilled-rinsed pipette and quartz-glass cuvette used for placement of the water sample into the spectrometer for measurement.
Results: ORAC-Charged Water Fluorescence
Later in my research, I began making fluorescence measures of ORAC-charged distilled water samples. Control samples of distilled water, pre-screened to insure its absence of UV absorption, and kept under the cardboard box, closely matched the zero-level “fluorescence” of an empty cuvette as used for calibrations, or as with no cuvette at all, often returning only the dark-current background noise of the spectrometer detector. By contrast, the ORAC-Charged water samples developed a clearly identifiable fluorescence across the near-UV and blue frequencies which, like the absorbance measures, intensified and expanded the longer the experiment progressed.
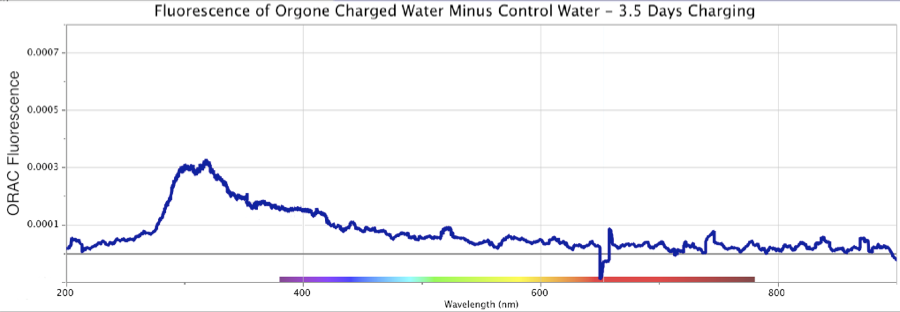
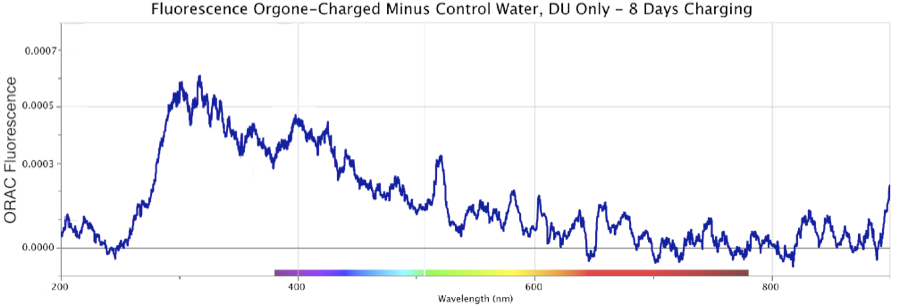
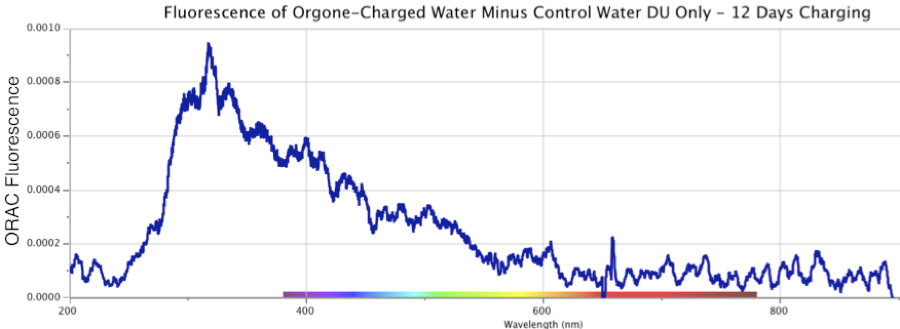
Figure 13. Fluorescence Spectra Differential of Orgone-Charged Distilled Water, minus an identical Control sample, over a 12-day period in August 2013. Top: 3.5 days of ORAC charging. Middle: 8 days of ORAC charging, Bottom: 12 days of ORAC Charging. Deuterium (DU) light source only.
Figure 13 shows three sequential fluorescence measures of ORAC-Charged distilled water, minus the result from a distilled uncharged Control sample, made over a 12-day period in August 2013. The fluorescence was spread across the region from ~260 to ~500 nm, with a primary peak at ~300 nm, and shoulder extending out to ~500 nm. These robust graphics were produced using only a deuterium UV light source for excitation (marked “DU-only” on the figures).
Light-scattering effects are ruled out given how the un-charged Control sample of distilled water, from the same jug, kept in an identical open glass evaporation dish under cardboard cover, never yielded any similar reaction. In fact, neither the distilled ORAC-charged nor distilled Control water samples contained any known contaminants by which such light-scattering might occur. Water samples were also checked microscopically up to several thousand power in a Leitz microscope, which by experience would render any microbial or particulate contamination visible down to around 0.2 micron or smaller. Keep in mind, all these graphics display the calculated differentials, of the ORAC-Charged water fluorescence minus the Control water fluorescence (if any), across the entire band of frequencies.
That orgone-charged water develops visible blue frequencies when excited by UV light, is anticipated from the viewpoint of Reich’s orgonomic theory. He argued along empirical lines, that a strong charge of primary cosmic mass-free orgone energy emitted a bluish lumination when sufficiently excited by secondary atomic, electrical or electromagnetic radiation. (Reich 1951, 1973c) What is new in my findings is how UV frequencies can provide such an excitation, with precise identification of the wavelengths involved. ORAC-charged water strongly absorbs in the ~220-280 nm far-UV range, with a simultaneous fluorescence in the near-UV and blue across the ~280-500 nm range. The intensity of both these effects, of absorbance and fluorescence, increases over time, the longer the water samples are allowed to charge up inside the ORAC enclosure (with un-charged Controls maintained inside the cardboard box).
These findings on far-UV absorbance and near UV and blue color emissions from the distilled ORAC-charged water samples, the latter as an effect of fluorescence or lumination as Reich termed it (Reich 1944, 1945), stands as an alternative to conventional Rayleigh light-scattering and preferential red-absorption theories. If those were the only mechanisms involved, then both the ORAC-charged and Control water samples should show nearly identical optical properties. Clearly, they do not, and the ORAC with its specialized layering of specific materials is something more than “just a box” as the faux “skeptics” like to parrot. These results suggest a new and independent pathway whereby water can be induced into a highly-charged state, thereafter generating its own near-UV and blue fluorescence when sufficiently excited by far-UV light.
Results: Anomalous ORAC Electrostatic Phenomena
Another factor of importance that appeared during my ORAC-charging experiments was an anomalous electrical charging of the water samples. The dielectric constant of water is at ~80, which makes it a respectable substance for acquisition and relinquishing of electrical charge. Anyone observing a powerful lightning storm, or replication of the Kelvin water-drop experiment, will gain a very clear appreciation of that fact. (Thomson W 1868, Israel H 1957, Kolarû P et al. 2012)
At one point in my experiments, a significant spark came off the glass cuvette as I attempted to seat it into the 10-cm cuvette holder, which was then conducted into the spectrometer via the metal-clad fiber-optic cable, damaging the instrument’s electronics. That spectrometer was sent back to the factory where the electronic board had to be replaced. In subsequent experiments, all components of the spectrometer were then wired up to an earth-ground, with a special grounding touch-plate. Similar electrical discharges also occasionally occurred at the ORAC, when transferring water into the cuvettes. Never did they occur when handling the Control water samples, which were situated on the same concrete and rugged floor.
Similar electrically-inducing capacities of the ORAC were determined years ago, in Reich’s original findings about how it could slow the natural-leak discharge of a charged static electroscope. (Reich 1951, 1973b) It takes longer for a pre-charged electroscope to discharge when inside an orgone accumulator, as compared to placement of the same electroscope in the open air, away from the ORAC, or inside a cardboard box of identical dimensions. I personally repeated these experiments many times.
In one run of measurements using a Kolbe-type static electroscope with photogate for precise measurements, from 27-29 September 2010 under low relative humidity (<50%), I recorded an almost five-fold increase in sequential electroscopical discharge times inside a 10-ply ORAC charger. The mean time for the ORAC runs was 596.9 seconds, nearly five times as long as a set of paired cardboard-box Control-run discharge times with a mean of 122.6 seconds (p=0.006). This experiment was undertaken inside a well-ventilated laboratory room with the doors to the ORAC and Control fully open, and the Control location at 1 meter distance from the ORAC. The experiment used the same electroscope under basically identical atmospheric conditions over the same times of day. In one case, not included in the above experimental run, the electroscopical discharge inside the accumulator appeared to halt altogether, with the needle blocking the photogate for more than 3 hours, indicating the ORAC-charging had fully halted its normal “leakage”, sufficient to sustain the electroscope needle against gravitational forces. In other rare cases, I have witnessed a slightly-charged static electroscope being literally “charged up” to a higher voltage when allowed to sit undisturbed inside a strong ORAC. Such effects as these cannot be friction-produced “electrostatics” as currently understood.
That ORAC-charged water could also acquire a slightly higher electrical charge was indirectly confirmed by use of a standard electronic pH meter, which reacts by about 1 pH unit per ~60 millivolts of charge variation in a measured fluid, calibrated to zero at the pH of 7, or neutral value (Sensorex 2017). ORAC-charged water frequently showed slightly higher pH values, as compared to control waters, without addition of any chemical inputs. It remains a double mystery, conventionally-speaking, firstly about how the ORAC might accomplish this frictionless electrical charging of water, and secondly how such a small quantity of a few multiples of ~60 electronegative millivolts, could produce a spark more generally characteristic of hundreds of electrostatic volts. Others, such as De Ninno (2013), have observed similar non-chemical pH variations – when solutions of phenalanine were exposed to weak magnetic fields, pH rose from a value of 2, to a value of 6 or greater. (What are the implications of that to the widespread use of magnetic stirring devices routinely used in laboratories?)
At one point, I exposed a pre-screened distilled water sample to repeated >50kV electrostatic discharges from a Van de Graaff generator, which subsequently showed no alteration in its flat-line near-zero UV water absorption spectra. Exposure of similar water to the ORAC did generate UV absorption, however, as shown in the figures above, suggesting the ORAC induces a charge of only a quasi-electrical nature, even while clearly electrostatic forces may appear as a secondary consequence. I had never experienced electrostatic complications in my early water research until making experiments with ORAC-charged water. These observations nevertheless added substance to the understanding that ORAC-charged water is indeed “charged up” in ways that affect not only its spectral characteristics. As I would learn, similar quasi-electrical charging of water also was present in other cases where these same spectral absorption and fluorescence signatures existed, as reported in the following sections.
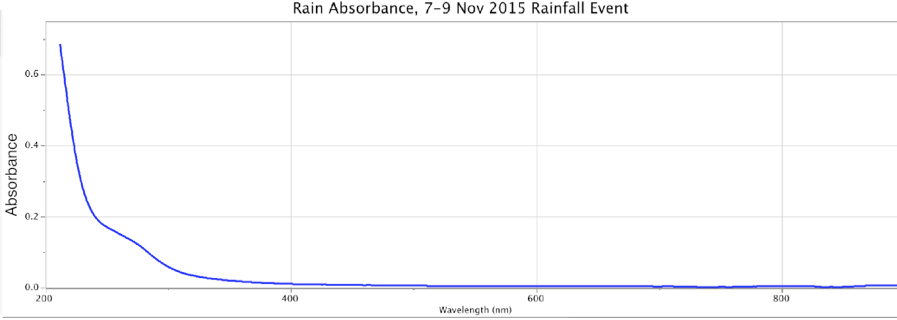
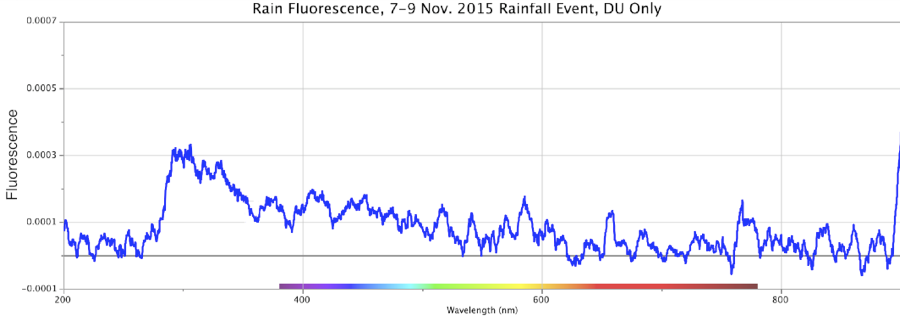
Figure 14. Absorbance (top) and Fluorescence (bottom) of Rainwater, Minus Control Distilled Sample. Storm of 7-9 Nov. 2015. Peaks: Absorbance ~280nm @ 0.2 intensity; Fluorescence ~310nm @ ~0.00032 intensity using DU bulb only.
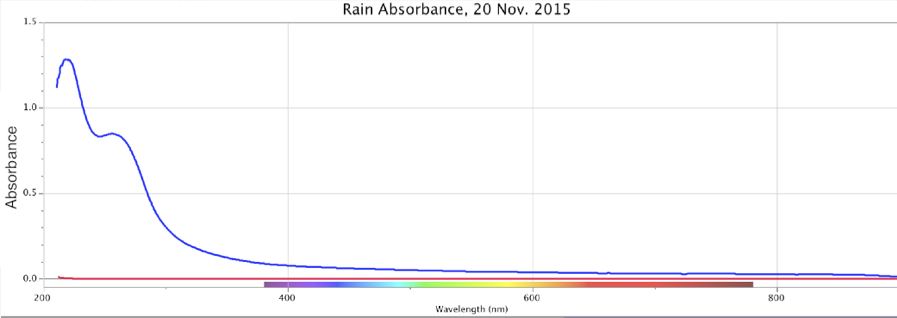
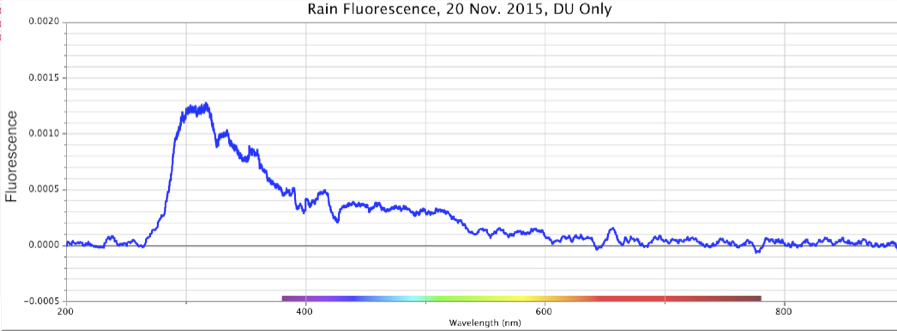
Figure 15. Absorbance (top) and Fluorescence (bottom) of Rainwater, Minus Control Distilled Sample. Storm of 20 Nov. 2015. Peaks: Absorbance ~260nm @ 0.84 intensity; Fluorescence ~320nm @ ~0.0013 intensity using DU bulb only.
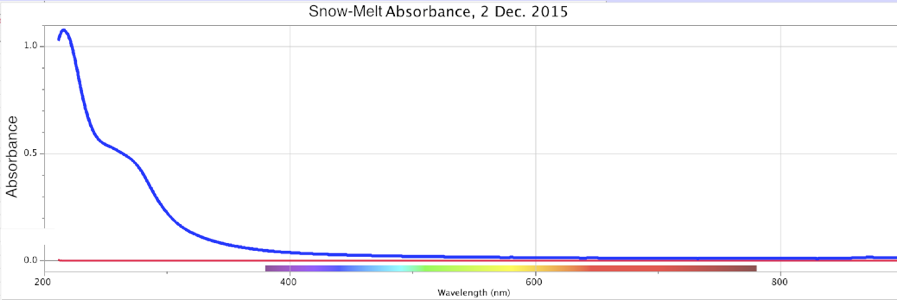
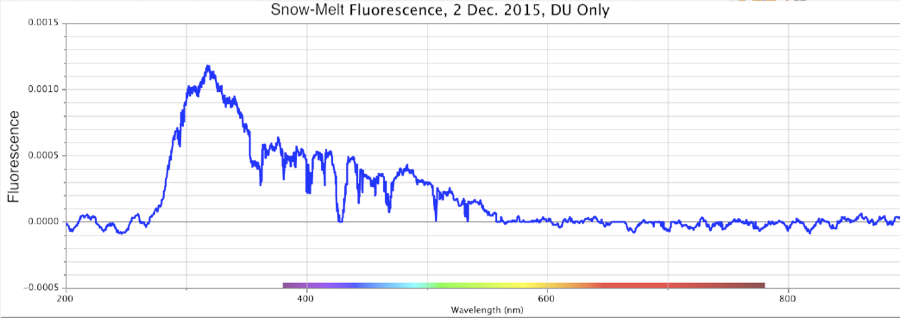
Figure 16. Absorbance (top) and Fluorescence (bottom) of Melted Snow, Minus Control Distilled Sample. Storm of 2 Dec. 2015. Peaks: Absorbance ~270nm @ 0.5 intensity; Fluorescence ~320nm @ ~0.0013 intensity using DU bulb only.
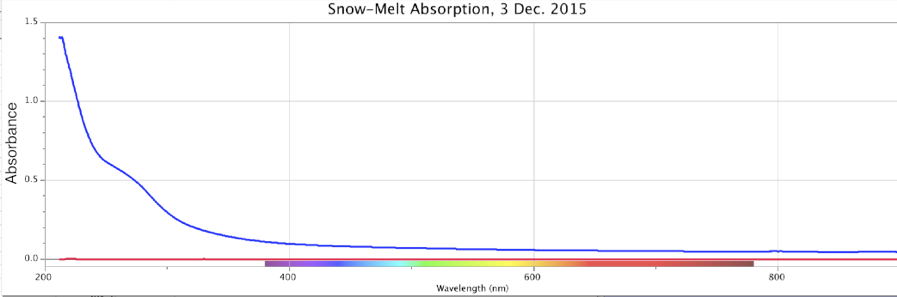
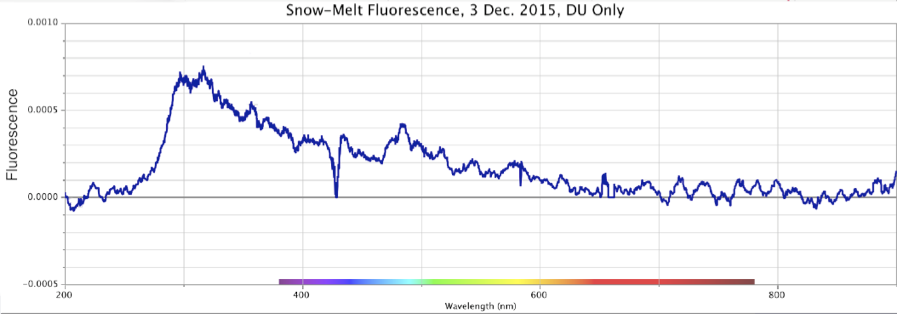
Figure 17. Absorbance (top) and Fluorescence (bottom) of Melted Snow, Minus Control Distilled Sample. Storm of 3 Dec. 2015. Peaks: Absorbance ~270nm @ 0.5 intensity; Fluorescence ~320nm @ ~0.00075 intensity.
From the above, we observe that Nature all by itself can develop spectral signatures suggestive of highly charged-excited, structured water within the powerful dynamic of large cyclonic storms.
In my experiments on precipitation, an open glass evaporation dish, as identified in Figure 6 above, was placed outdoors when such rains or snow began falling, on an elevated pedestal to avoid capturing any splash-water landing outside the dish. After the storm was over, the water or snow sample in the evaporation dish was taken inside the laboratory, the dish placed on a cardboard sheet covering a table, being allowed to reach ambient room temperature of around 50-60 degrees F. Sterile tweezers were used to remove any floating or submerged debris, which was minimal in any case.
A water sample was then carefully pipetted from the dish into the appropriate quartz cuvettes for spectral analysis, avoiding turbulence to the maximum extent possible, with control-comparisons made to a distilled water source pre-checked to not possess the unusual UV-absorption signature. The following general patterns were observed:
1. Strong vigorous cyclonic storms charged with natural atmospheric electricity, produced precipitation almost always showing strong absorption and fluorescence signatures. These wintertime cyclonic storms arrive at my West Coast lab from the Pacific Ocean, and hence move up the rural forested Oregon mountain region passing over our 1350-meter altitude location.
2. In borderline weak-strong rainstorms, absorption signatures might be observed, but in only around half such cases were fluorescence signatures observed.
3. Weak drizzles of low rainfall quantity did not yield significant spectral signatures of any sort.
In these four precipitation events, Figures 14-17, the absorbance is a broad sloping line starting at ~250 nm, headed towards a peak beyond the ~200 nm limits of the instrument, similar to strongly ORAC-charged water. An absorption shoulder is also apparent in the precipitation spectra at the ~280 nm mark. Beyond around 220 nm, rainwater/snowmelt absorption increases to significantly higher intensities.
These same precipitation samples showed a major fluorescence peak at the ~300-350 nm range, with a broader shoulder of fluorescence that extended out to ~500-550 nm, inclusive of the purple, blue and light-blue wavelengths. As noted, during weak rainstorms or snow episodes, it was quite typical for the fluorescence only, or both absorbance and fluorescence reactions to weaken or vanish. Once the Pacific storms began “winding up” in powerful cyclonic spirals, arriving at the coastline and dumping larger amounts of rain and snow, these spectral signatures became more pronounced.
As noted previously for ORAC-charged water, the stronger cyclonic-storm precipitation events also yielded a slightly higher pH value than weaker drizzles of the region. I firstly encountered this phenomenon in a field survey of acid rains in the German Schwartzwald (Black Forest) region, where >80% of trees were classified as sick or dying. (DeMeo 1983) By my own direct measurements, and from interviews with foresters and scientists of that time and region, stronger cyclonic storms which entered into Europe off the North Atlantic always showed a higher pH, of about 5 or 6 pH. The lowest minima I ever recorded was ~4 pH, always from weak drizzles out of stratus clouds, but never as low as the often-reported values of 2 or 3 pH typical of acid rains. Such low pH values were conventionally attributed to the pollutant chemistry, however, and my day-to-day pH measurements in Germany, even while higher than anticipated, appeared to generally confirm it. However, when obtaining similar variations in rainwater pH measures in Florida, with no serious air pollution, the same pattern of storm intensity predicting rainwater pH was observed. The more recent measures undertaken in Oregon at my West-Coast laboratory location, which also has no significant air pollution, presented a similar rain intensity/pH correlation.
In Germany and Florida, high-quality portable electronic pH meters were employed, while in Oregon, a bench-top pH meter was used, all of which were calibrated to standardized solutions and functioned on the basis of electrical potentials. The stronger weather systems in all those cases produced rains or snow with higher electrical charging, which then showed up on the electronic pH meters. However, only in the case of Germany was air pollution a significant factor. The Oregon precipitation was also subjected to spectroscopic examination, revealing similarities to the ORAC-charged water samples, which also showed higher pH values. These higher pH readings, for stronger precipitation events and for ORAC-charged water, of about ~1 to 2 pH units, computes to around 60 to 120 millivolts of additional charge. Low precipitation pH values and associated dying of forests (which in Germany is more accurately termed Waldsterben, or “forest-death”) might in some cases be underlain by a more fundamental energetic parameter, related to the intensity of rainstorms and the coalescent size of raindrops – which is also governed by cloud electrostatics. (Bracewell et al. 1967; DeMeo 1983; Miller 1980; Vermeulen 1980; Waldman 1981) Once again, a suggestion is made similar to what was given above, and supported by Belovolova et al. (2009) and De Ninno (2013), that non-chemical energetic factors may be involved in these pH variations.
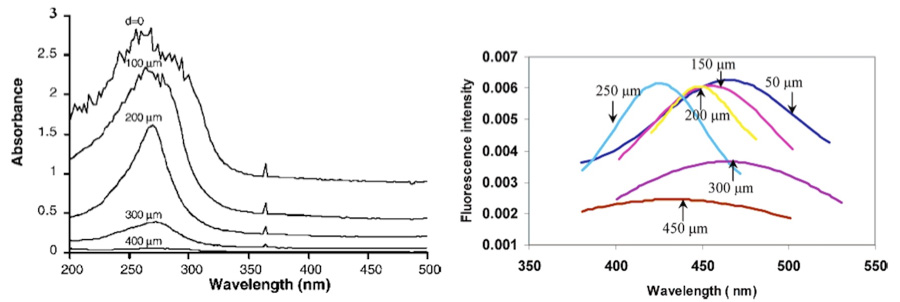
Figure 18. Absorption and Fluorescence Spectra of Pollack’s Exclusion Zone (EZ) Water. (from Pollack 2013) Numbers in the graphics indicate the physical distance from the Nafion material stimulating these spectral reactions. In all cases, the closer the spectrographic measures were made to the Nafion surface, the stronger was the EZ reaction.
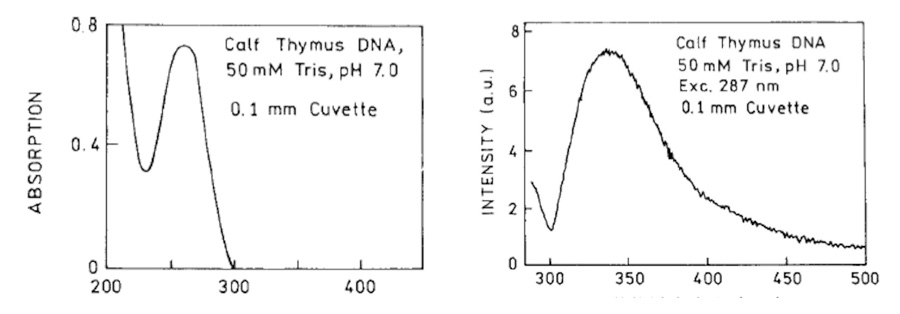
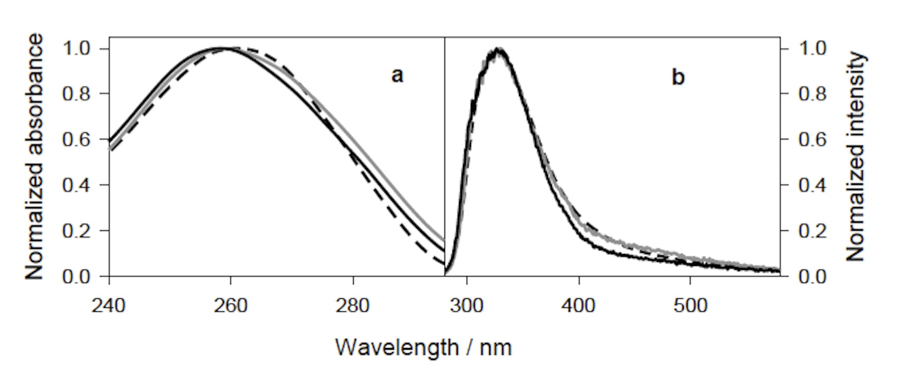
Figure 19. Water Absorption and Fluorescence Signatures from Aqueous Solutions of DNA. Left sides: Absorbance. Right sides: Fluorescence. Top pair from Lakowicz et al. (2001). Bottom pair from Vaya et al. (2010).
Spectroscopy of Gerald Pollack’s EZ Water
Studies undertaken by the Pollack team at the University of Washington indicate a dynamic and growing hydrophilic exclusion zone (EZ) surficial boundary layer of up to 300 microns in depth, adjacent to high-dielectric Nafion material. This finding was a violation of conventional expectations, that “water” (without regard to structural properties) should reside in such a highly-ordered condition of only a few microns depth, directly adjacent to the materials it contacts. Instead, the Pollack team found ordered-structured water molecules in layers several hundred times greater than conventional expectations. Questions arose regarding the mechanism for the appearance of such a phenomenon, which to my knowledge have not yet been resolved by conventional theory.
The role of dielectrics in the production of variable-strength electrical fields is well-known, but such fields generally diffuse away from charged objects and weaken upon immersion in water. Instead, the Nafion material was shown to increase the water-structuring or charging influences in the EZ layer, and retain it over time. Importantly, as discussed below, the EZ layers also carry an electronegative charge with slight bluish fluorescence. (Chai et al. 2008; Chen et al. 2012; Elia et al. 2013; Pollack et al. 2009; Pollack 2013; Zheng et al. 2006)
Figure 18 shows the spectrographic reactions of the exclusion zone within water adjacent to a Nafion surface, up to several hundred micrometers in depth. The EZ absorbance exists across a general UV region of ~240-320 nm, with a peak intensity at ~270-280 nm, and EZ fluorescence over a region of ~400-500 nm, or within the purple and blue wavelengths.
While the wavelengths of measured EZ water spectral reactions do not exactly match what has been given previously for ORAC-charged water, or for rain water and snow melt, they do constitute a part of the broader recorded absorbance and fluorescence spectra found in those two latter examples.
Spectroscopy of Aqueous Solutions of Nucleic Acids and DNA
Spectroscopic signatures have been recorded for aqueous solutions of nucleic acids, the DNA molecule. (Lakowicz et al. 2001; Vaya et al. 2010). The results of these two independent studies are reproduced in Figure 19. DNA dissolved into water produces a broad absorption peak in the far-UV, approximately at the same ~250-275 nm as previously discussed for EZ water. The fluorescence reactions in DNA-water is similar to ORAC-charged and rain/snow waters, between ~300-400 nm.
These spectral signatures of water mixed with the “molecules of life” are therefore reasonably congruent with the other measured examples given previously, as in the Pollack team’s EZ water studies, in my own ORAC-charged water studies, and as found in the spectra of strong natural winter rains and snow as occurring at high altitude close to the Pacific Coast. This general agreement in the spectral signatures does not appear to be coincidental, but instead suggests a common causal factor, or set of factors. DNA is also described as a dielectric material carrying an electronegative charge, which by itself may have more of an influence upon water structuring than is generally appreciated.
An interesting question thereby presents itself, for later determination: Do the DNA water studies measure the absorbance and fluorescence spectra of DNA, or the spectra of water which has been induced into a higher state of charge by the added DNA? This latter postulate is supported in the affirmative by Ho (2012), regarding DNA electrification of water.
Discussion
To better understand these spectrographic similarities, I will expand the discussion into laboratory experiments and direct observations as made out in wild Nature. In both general and special circumstances, water appears able to have an energetic “aliveness” infused or induced into it, whereby it acquires an electrical charge of electronegative polarity, along with spectroscopic changes of higher UV absorption and near-UV/blue fluorescing colors.
The reported experiments above have demonstrated induced changes in water’s spectral-optical properties that are unusual, or identifiable only in uncommon circumstances. ORAC-charged water, vigorous rains, Nafion-charged and DNA-charged water solutions, all show something that is not generally present in other bulk, distilled, uncharged or mundane water samples. All of these examples possess the unusual parameter of activation or structuring, or what we may term energetically charged and excited water. However, this factor of water’s variable charged-excited condition is hardly appreciated by scientists studying water or ice in more conventional contexts, even if spectacular blue colors are fully observed, photographed and accepted by them.
Blue Snow and Ice
It is commonly observed that a good heavy snow cover, either freshly fallen or aged and compacted, will show a blue coloration in its shadows, embankments or holes as made by a ski pole or snow shovel. When subjected to moderate direct or even diffuse sunlight under overcast conditions, the bluish color can be unmistakable, and often with an observed intensity that subjectively appears too strong and out of proportion to the existing diffuse sunlight, from which only a small proportion is conventionally claimed to create the blue color. The blue colors thereby frequently appear as fluorescence reactions. In fact, such blue colors are more readily gauged in lower-light, overcast conditions, as direct sunlight reflecting off white snow surfaces may be too dazzling to the eye, and thereby overwhelm and obscure the blues. Figures 20, 21, 22 and 23 present a few examples of these blue-glowing snow and glacial phenomena, of variable intensities.
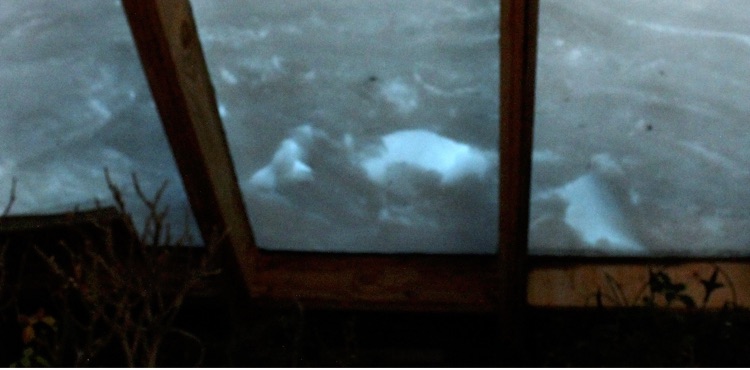
Figure 20. Blue Glow Under a Fresh Snow Pile of ~1 meter depth, as seen from under the author’s laboratory solarium window on an overcast winter afternoon. Light-Scattering, or Blue Fluorescence? (photo by J. DeMeo)
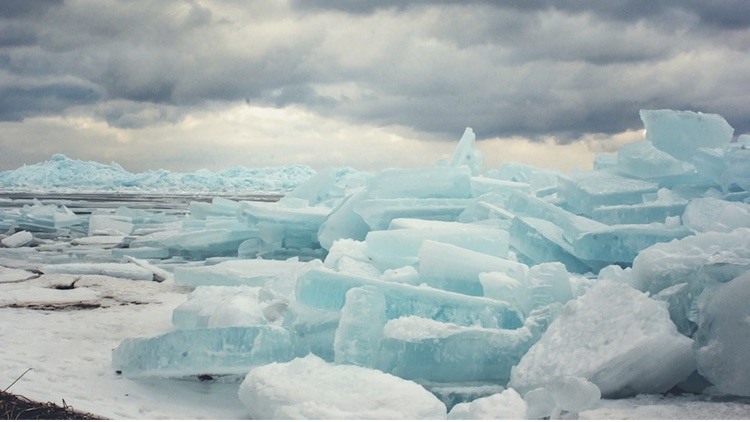
Figure 21. Blue Ice Sheets, driven by wind and waves onto the shores of Lake Michigan. Overcast conditions. Light-Scattering, or Blue Fluorescence? (photo © by Tore Burley, triliumandpine.com)

Figure 22: Blue Glow Within a Glacial Ice Wall. Viewed at ground level. Knik Glacier, Alaska. Foggy conditions. Light-Scattering, or Blue Fluorescence?
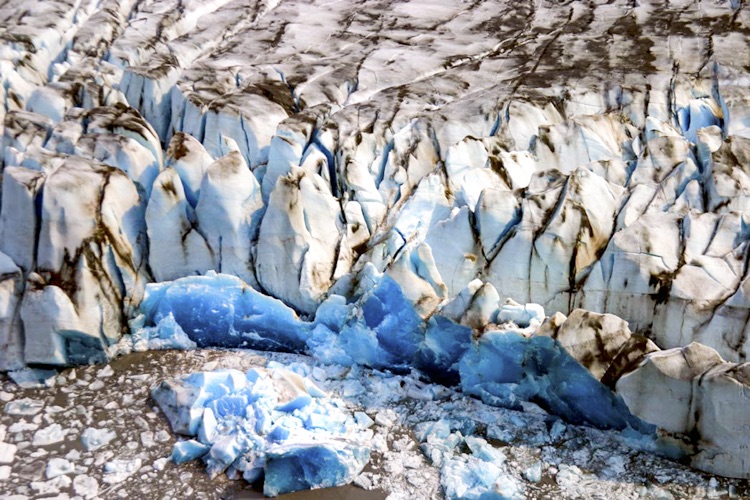
Figure 23. Blue Glows Within Glacial Ice Blocks. Viewed from above. Knik Glacier, Alaska. Low-angle sunny conditions. Light-Scattering, or Blue Fluorescence?
The internet is filled with similar images, some of which appear fully anomalous to conventional theory. However, conventionally-oriented studies on the optical properties of glacial ice and snow do not, by my observation, consider the possibility that these widely-observed but not uniformly-present intense bluish colors might be the product of energetically charged and solar-excited water or ice, in a fluorescence reaction. How much of conventional theory is actually tested out by experiments in the field, versus resting upon widely-held but untested assumptions?
Warren et al. (2006) have reviewed published experiments on the optical characteristics of water and ice, affirming that they share a generally similar spectral pattern from the UV out into the mid-IR range. They both exhibit a very strong UV absorption below wavelengths of <170nm, with a rapidly decreasing absorption and greater transparency at longer wavelengths. A considerable absorbance variation exists in different glacial ice samples in the mid- to near-UV wavelengths, at around this same ~280 nm region that is identified in the above experiments as a general identifier for water structuring. Water is most transparent at ~400 nm, with low absorbance out to ~700 nm. There is a slow increase in absorbance as one moves out into the red frequencies. Absorption is moderate at 1000-3000 nm, in the near Infrared (IR), increasing dramatically into the far IR wavelengths beyond 3000 nm. Warren, et al. state: “Between 300 nm [UV] and 600 nm [orange] the absorption by ice [and water] is so weak that for some geophysical purposes it may as well be set to zero…” This seems contradictory to the usual claim that water and ice are transparent only in the blue frequencies.
With regard to observed colors, Warren et al. (2006) nevertheless repeat the conventional mechanisms of albedo-reflectance, Rayleigh scattering and preferential red-frequency absorption characteristics of water and ice. These theories were arrived at through measurement by passive spectroscopic intensity at ice or water surfaces in situ, or by measurement at a depth, with full-spectrum natural sunlight used as the light source.
However, the range of ~300 through 600 nm, where water and ice are considered to be significantly transparent includes the near-UV, blues, greens and orange colors, which is quite different from the usual convention arguing for preferential blue scattering and red absorbance. With such a broad spectrum of transparency (and subsequent scattering) should not such ice and water show a green color, or blue-green? Further, and more to the point, spectral intensity is also how fluorescence is measured.
From what I could determine, there has been no effort made by any investigators to examine such ice material or related water samples for either water-structuring or fluorescence effects. Fluorescence determinations would require a different analytical procedure, to run a calibration curve using distilled water or distilled ice, of an equal thickness to the ice-block or snow sample being evaluated. And to expose glacial-ice or snow samples to UV-only light sources at night, or in darkened laboratory environments, and then look for the full range of spectrographic reactions. In none of the papers I have reviewed on this subject of optical characteristics of glacial ice or snowpack, claiming to have definitive answers on this subject, were such procedures described, nor was the issue of fluorescence mentioned as a possible alternative explanation. No mention was made of water structure or activation, nor effort made to contrast glacial or snow-ice samples against ice from distilled water as a control. Possible variations in spectral properties of water or ice due to water structure, or possible fluorescence effects, does not appear to have been addressed in any of the conventional studies
Aside from the matter that water structure is something of an orphan child of the modern sciences, the question of a possible blue-fluorescence effect has not been raised previously, to my knowledge, even within the field of water-structure studies, other than by mavericks such as Reich (1951, 1973c) or Pollack (Chai et al. 2008; Pollack 2013) or by myself.
Interestingly, the Warren et al. (2006) paper did mention that, at a certain depth within a bluish sample of glacial ice, the direction of the light was ubiquitous, coming from all directions. This also was interpreted as an effect of light scattering, but could just as well be due to omni-directional fluorescence, close to or within the core of the fluorescing region.
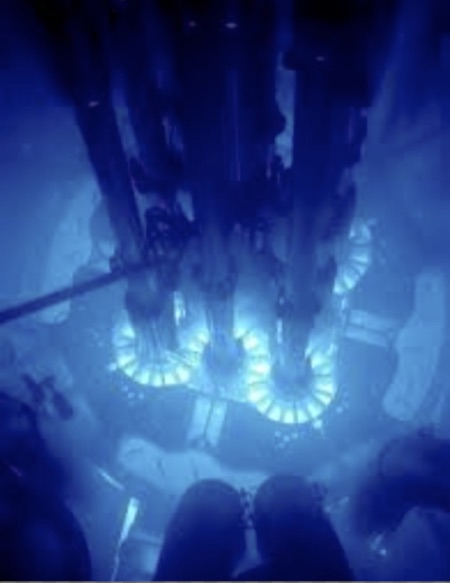
Figure 24. Blue Glowing Water, the Cerenkov Reaction. Definitely not “light scattering” nor “preferential red absorption.” (Advanced Test Reactor, Idaho Nat. Lab)
Atomic Excitation of Water and Ice
The only exception I could find by a conventional literature search on the subject of blue glowing water not dismissed as purely “light scattering” was for another water-fluorescence reaction, notably the Cerenkov radiation. In this case, water is subjected to constant high-level atomic radiation, as in a nuclear reactor core, and thereafter emits light most strongly, though not exclusively in the UV and blue frequencies. The Cerenkov effect is classically described as created by charged particles traveling through a dielectric medium, dependent upon the refractive index of that medium. Water is a substance of relatively high dielectric constant (k=80), as is living tissue, which also produces a weak blue Cerenkov fluorescence under radioactive stimulus. Cerenkov effects are clearly a product of water fluorescence, with emissions in the same sets of frequencies identified above. We may postulate if this is a special case where water receives a structuring charge and excitation at the same time? Radioactive emissions in this case substitutes for the deuterium light of the spectrometer, or for sunlight in the case of exceptional ice packs, glaciers and blue-glowing lakes.
A similar but fleeting spectral fluorescence is seen in ice when exposed to infrequent high-energy atomic particles, as employed for neutrino detectors located several kilometers deep within the Antarctic ice cap, and well below the depth of optical transmission of visible light from the surface. Neutrino-detection also employs large darkened water tanks deep in underground mines or caves, with numerous photomultiplier tubes (PMTs) peering into the darkened water tank, and sensitive within the same near-UV and blue frequencies identified above for our structured-activated or charged-excited water. This is also true of PMTs as used in standard scintillation counters, where they are coupled with NaI(Tl) crystals, or with high-dielectric plastic scintillators, or as used for biophoton research. Gamma-ray astronomy often employs PMT detectors looking into dark night skies for flashes of light, as given off by excited nitrogen, which also emits in the near-UV and blue frequencies. Complicating factors in such night surveys are generalized air-glow, or the black aurora, which also yield similar UV-blue emissions. UV/bluish emissions are quite widespread in nature, and in the laboratory, even while different explanations are often given for each expression. Is there a common factor at work?
Blue Liquid Waters, Lakes and Atmospheric Glows
With the above points in mind, we may consider other examples of blue-glowing natural phenomena, which might also be due to similar charged-excited absorbance/fluorescence mechanisms. There are less-common cases where water emerges from the ground already highly-charged, to the point that natural daylight brings it to the point of exhibiting an observable blue-glow. These are highly-transparent waters, and in the most anomalous cases, relatively shallow.
Examples are various healing waters, often of an observably blue hue, as from natural hot springs across Europe and North America. In the USA, numerous mineral hot-spring healing waters, once used for health and recuperation by Native Americans, later had health-spas erected on their sites in the 1800s. (DeMeo 2010) Starting in the 1920s, the US Food and Drug Administration went on the warpath against natural healing methods, and shut down those health-spas and clinics, often literally at gun-point (DeMeo 1993), much as how they later attacked and destroyed Reich. (DeMeo 2013) Most Americans today have little appreciation for what once was a commonplace natural method of health maintenance and recuperation. Similar health-promoting natural hot-springs spas persist in Europe, however, and the blue-color of their waters, under minimal room-light or sunlight (full or overcast), is a frequent but not constantly-occurring observation. (DeMeo 2010)
Some hot-springs, such as the amazing constant-flowing Morning Glory Pool at Yellowstone Park, show a distinct blue glow at shallow depth, which in many other similar shallow waters is not apparent in the slightest. Only some waters emerge from a depth with such a strong bluish coloration. Not all springs or pools, irrespective of temperature, show this intensity of color. What makes for this difference?
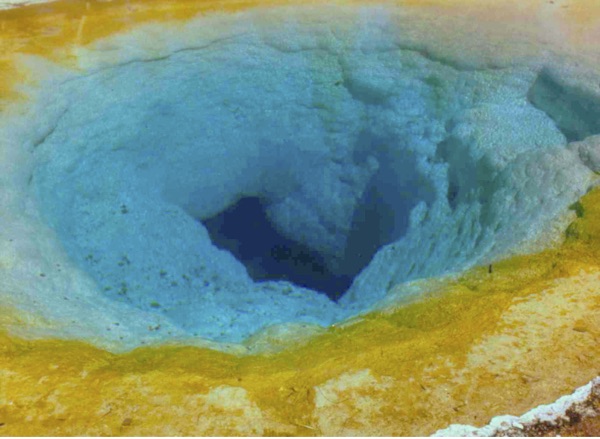
Figure 25. Morning Glory Pool, Hot Spring, Yellowstone Park, 2000. Full sunlight. Light-Scattering, or Blue Fluorescence? (photo by J. DeMeo)

Figure 26. Shallow Blue Ponds on the Surface of Knick Glacier, Alaska, full sunlight. Light-Scattering, or Blue Fluorescence?
In the Morning Glory Pool, which I visited and photographed in 2000, seen in Figure 25, both the inner walls and the open water itself in the core of the spring was a remarkable blue color. Walking around the pool and viewing it from different angles clearly indicated a real fluorescence. A light-blue color was apparent about 2 meters in depth near the edges, blending into a dark blue color down to around 6 meters in the deepest part. The water emerges from the Earth close to the boiling point, with a distinct blue color, observable when the water is subjected to sunlight. “Light scattering” does not appear to be a sufficient explanation, given the intensity of the blues overall and its shallow nature. But nevertheless, nobody to my knowledge has ever examined the waters of this remarkable hot spring using fluorescence methods. The blue colors are lost as the water spills out into the upper edges, where it cools sufficiently for green-yellow and orange algae growth.
Some frigid waters, such as shallow pools on the upper surfaces of glaciers, also show a similar decidedly strong blue color under solar excitation. And once more, no fluorescence measures have been made of these glacial pools, to my knowledge. An example from the Knik Glacier in Alaska is shown in Figure 26.
Then we have other large bodies of water, such as the high-altitude lakes in mountain regions, which often show a radiant blue color so intense, it appears blue dye has been poured into them. These examples of intensively blue-glowing waters are popular with tourists precisely because of their highly-unusual nature, yielding something that is not generally seen in other small or large water bodies. Temperature is highly variable across these different examples, some very cold, others very hot. Some are deep, and some are shallow.
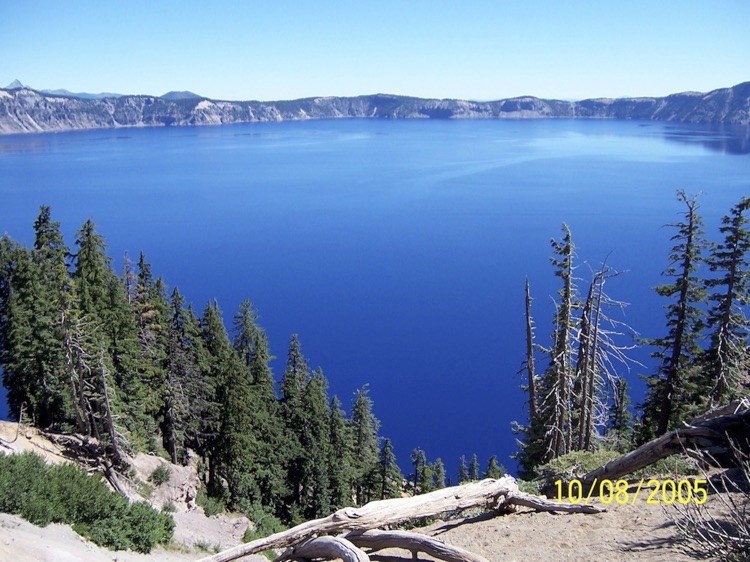
Figure 27. Two Views of Crater Lake, Oregon, 2005. Looking across the lake (top), and looking directly down at the edge (bottom). Full sunlight. Light-Scattering, or Blue Fluorescence? (photos by James DeMeo)
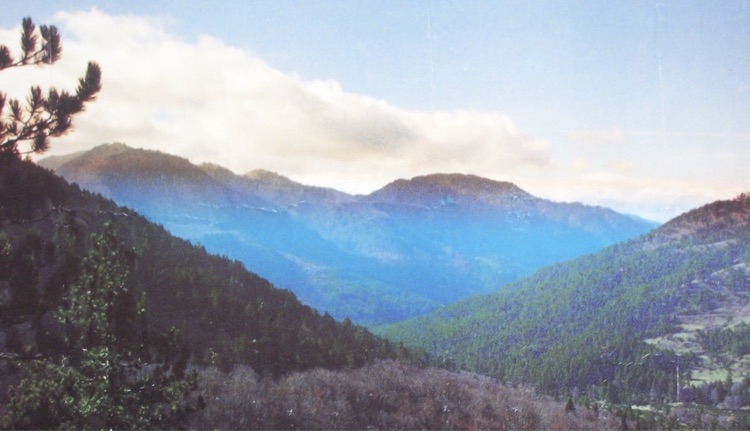
Figure 28. Transparent Blue-Glowing Greek Mountain Atmosphere. From the Valia Calda in the Pindos mountains, reproduced on a tourist poster by the Grevena Perfecture. (photo © by G. Tzatzanis) Light-Scattering, or Blue Fluorescence
My visits to Crater Lake National Park in Oregon, only 100 miles from my laboratory with two examples presented in Figure 27, nearly always gave the visual impression of an intense blue fluorescence. In some circumstances, as when sunlight was partly obscured by heavy aerosols from desert-dust or fire-smoke, the intensity of the blue color was dramatically reduced. In those cases, one could equally argue that scattered blue light had been diminished, or that solar excitation was insufficient to cause an observable fluorescence. At other times, even when somewhat overcast with clouds, the intense blue color remained. Park rangers had a rehearsed narrative for tourists, that the “lake takes its blue from the sky”, and yet in many cases, the sky was a tepid weak blue color due to obscuring aerosols, while the lake remained intensively blue. Crater Lake gets its major water from intensive winter snowstorms, which pile up around 3-4 meters of snow, which melts into the lake during spring and summer. These are the same vigorous cyclonic storm systems that were investigated at my nearby laboratory, shown to have a strong UV-blue fluorescence.
Again, how much of conventional theory is actually tested out with experimental investigations in these variable cases, versus the mere “assumption” the cause was this or that conventional explanation? Admittedly I haven’t made experimental tests for UV/blue fluorescence of Crater Lake waters, nor of ice or meltwaters at Knik glacier, but apparently, neither has anyone else.
Another class of related blue-glowing phenomena is difficult if not impossible to explain by conventional theory, as with certain blue-glowing mountain atmospheres occasionally observed and photographed. A case in point is seen in Figure 28, of a transparent blue atmospheric fluorescence that clings to a rural mountain in Northern Greece. It isn’t fog. It isn’t clouds. If not a real fluorescence of the local atmosphere under solar excitation, then what is it?
This blue-mountain image was being used on a tourist poster by the Greek government, at a time when I was lecturing there in the mid 1990s. A copy was obtained and through a translator the Greek photographer was contacted, who along with several others I met at the time, assured me this is exactly what that specific mountain region occasionally looks like to the naked eye. The photograph shown here was made with standard 35mm Ektachrome slide film, without any color filters on the camera lens.
Atmospheric water vapor may play a critical role in such cases, and so gaseous water may also prove to have the capacity for charge and excitation, a “structuring” of water-gas, much as it has been measured in the precipitation falling from large cyclonic weather systems. Some of these blue reactions can be extreme, as in this one example, subjectively appearing as a fluorescence. And like the blue colors in shallow hot-springs, the bluish atmospheric regions also appear quite transparent, as if natural light gains a coherent property when passing through it, almost as if it is more transparent than the usual atmosphere, not less. These are not constantly-observed phenomena. They are rare, and while widely reported in some cases, photographers are not always around at the time of their most spectacular appearances. And like the examples of the blue glowing hot-springs, glacier lakes, or high mountain Crater Lake, these are not “glows” that persist into the night. They require a clean high-altitude natural atmosphere, plus solar excitation to bring them to the point of lumination, or fluorescence.
One common conventional explanation for the blue atmospheric glows over forest regions is “terpene gas” emitted by conifers. This explanation may be suitable for some locations, such as the Smoky Mountains, or the Blue Ridge Mountains of the Appalachian range in the Eastern USA. Their blues are mostly cloud-like or foggy, and they obscure visibility. They are not transparent blue, more like a bluish-fog as I’ve seen and others have photographed. Terpenes may or may not be at work in those cases, but surely cannot explain the more dramatic and transparent blue fluorescence as shown in the Greek photograph. Terpene gas is also said to be copiously emitted at lumber or pulp mills that process pine trees, but nobody has ever presented a photo of such a pulp factory surrounded by a transparent or foggy blue glow. I also have photos in my files of mountains bare of trees showing somewhat similar transparent blue-hues, which are also seen surrounding rock-barren high mountain tops, above the tree-line. But the above Greek photo is the most spectacular I’ve ever seen.
Blue Bion Vesicles and Blue “Red” Blood Cells
Certain biological phenomena appear as special cases of this same charged-excited condition. I’ve already mentioned Cerenkov fluorescence in living tissues from atomic energy, and also the case of the biophotons. However, there are other cases where blues can be directly observed by the naked eye, in the light microscope, without use of PMTs. One such example is Reich’s bions (Reich 1979), tiny oval vesicles about 1 micron in diameter emergent from disintegrating organic or inorganic matter, and by his arguments were transitional vesicular forms between the non-living and living world. Reich’s bion discovery was the starting point of his investigation of the orgone energy phenomenon. Bions from incandescently-heated Norwegian beach sand, immersed into KCl solutions (0.1 N.), gave a particularly intense blue glow and sensible radiation. (Reich 1973b) Figure 29 shows one such sample of very blue bions, in this case obtained at my laboratory from quartz dust gathered at a rock-crushing quarry. The quartz dust was immersed in distilled water for several months, but not subjected to intense heating. They were viewed and photographed through our true-color Leitz microscope with apochromatic objectives in brightfield. There was no movement, as these bions remained imbedded within the quartz particles. In other places within the microscope field, free blue bions were observed. The microscope Halogen light provides the excitation illumination.
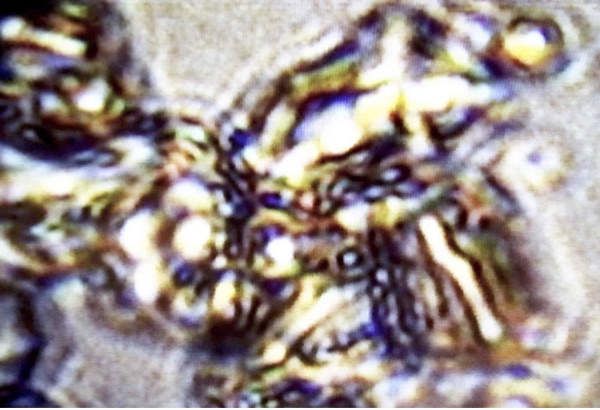
Figure 29. Blue Bions Imbedded in Quartz Dust. Leitz Microscope, halogen brightfield, Apochromatic true-color optics. Light-Scattering, or Blue Fluorescence? (photo by James DeMeo)
In Reich’s Norwegian experiment, this blue glow was more than just a color, it was a radiation emanated from specific sand-bion cultures which, when injected into cancer mice, disintegrated tumors and extended their lifespan. Later, Reich developed the orgone accumulator (ORAC), avoiding the necessity of such bion-injections in his cancer research – and which was of course the beginning of his troubles with the medical societies. (Reich 1973b)
Reich also observed visible blue color fields around and within the margins of living red blood cells, in brightfield conditions. He observed that healthy red cells had a strong visible blue field, and retained their turgor and shape when placed into stressing physiological saline solutions. Healthy red cells also did not clump together in the usual Rolleaux formations, like stacks of coins, which is a factor identified with poor respiration and lower oxygenation of blood cells. From this, he developed a specific Reich Blood Test for identification of degenerative disease tendencies, especially for cancers. (Bauer 1987; Rafael and Macdonald 1952; Reich 1973b, 1979)
Bauer (1987) studied Reich’s method and compared it to standard blood sedimentation tests, finding a strong correlation between the two methods. Healthy blood carries a strong electronegative charge, termed the Zeta Potential by classical hematology, and is known to be a factor correlated to general health and immunity. Healthy cells also repulse each other, opposing Rolleaux, slowing sedimentation, and resisting deterioration under saline stress. In this, the blue electronegative fields around the red cells may be similar to the EZ water effects at Nafion boundaries, which also are electronegative and blue-fluorescing. (Pollack 2009, 2013)
In this case, the Zeta potentials of healthy red blood cells provide a critical bit of evidence on exactly how bioelectrical fields function in states of health and illness. Such fields are measurable, but only on the order of a few hundred millivolts, a voltage generally too low to create significant biochemical effects – but nevertheless, the correlation to health is there. (Bauer 1987; Becker 1998; Burr 1972; Rafael and Macdonald 1952; Reich 1973b, 1979) Such electrical fields also should dissipate into the water-plasma solutions in which they exist, but do not. Like Nafion radiant fields, the electronegative blue fields surrounding red blood cells are radiant and self-sustaining under submerged conditions.
As noted above, the width and intensity of these blue glowing fields indicate both electrical (Zeta-potential) and healing (sand-bion radiation) properties, which would not be the case if they were merely by-products of light-scattering, or merely a “blue color”, or merely “millivolts” for that matter. The millivolt readings on the electrometer appear to correlate with the intensity of blue color, pointing to a more significant biological and cosmic quasi-electric phenomenon at work in both living and non-living water-related contexts.
Also significant, I have personally seen, but never photographed, living blood illuminated by a halogen light source containing near-UV frequencies, from which the entire cell and its energy-field glowed a far more brilliant blue color than as seen in my Figure 30.
I’ve also made photographs of certain dark-blue flowers which when observed in both direct and diffuse sunlight, provided the clear impression of an intense visible dark bluish fluorescence. It is known that many flowers also emit UV frequencies in addition to their visible dark blue colors, something the bees and other pollinators are attracted to. This also is not “light scattering.”
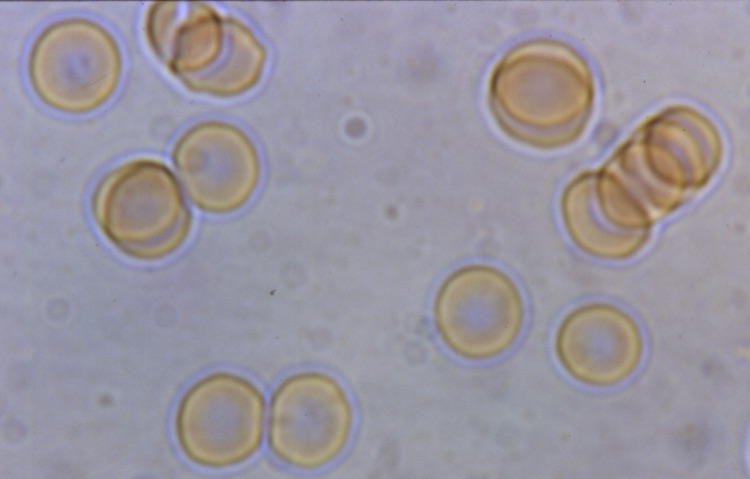
Figure 30. Blue Energy-Field of Living Red Blood Cells. Leitz microscope, halogen brightfield, Apochromatic true-color optics. Light Scattering, or Blue Fluorescence? (photo by James DeMeo)
Do We Live in an Energetic Water Universe?
We may end by taking this discussion into the larger realm of cosmic functions, and cosmic water.
Quasar APM 08279+5255 is found at the extreme edge of known space. Recently this quasar and its halo was reported to possess several clear spectral signatures for abundant water in its proximity. The quasar is “drenched in water vapor” according to a 2011 NASA press release which made the discovery public. (Web ref. 10) By conventional astrophysics, this particular quasar is considered to be one of the brightest objects in the universe, with a luminosity 1014 or 1015 times that of our sun. Bright Quasars have been shown to radiate in a blue color. (Schmidt et al. 2011)
Closer to home, the only galactic halos in close proximity for detailed study are those of the nearby Andromeda M31 Galaxy, and its partner Elliptical Galaxies M32 and M110. In true-color astrophotographs, as seen in Figure 31, these three galaxies and the open space surrounding them display a deep bluish halo which connects them, similar in visible color to the fluorescence reactions under discussion in this article. (Web ref.11) Andromeda’s blue halo extends outwards by around 10,000 light-years or more from its main disk, far enough to identify its presence within starless regions of intergalactic space. Blue energy-bridges extend outwards to embrace Andromeda’s two closest elliptical companions. Arp’s photos of energy bridges connecting “misbehaving” adjacent galaxies of high and low red-shifts come to mind. (Arp 2003).
There are other astrophotos of M31 that display variations of these same blue energy-fields, made by different astronomers such as Law, Mayda or Hallas, who sell beautiful wall posters of Andromeda with her blue veil. (Web ref. 12) However, their photos are of significantly lower resolution than what is available from the Rector Kitt Peak image in Figure 31, which allowed the core of M31 to become over-exposed in favor of a better resolution of its dimmer outer regions. Upon close examination at the highest-resolutions (Web ref. 11), this image reveals outer areas of jet-black open space, which unmistakably contrast against other transparent blue-glowing areas, associated with the energy bridges connecting M31 with its two companions.
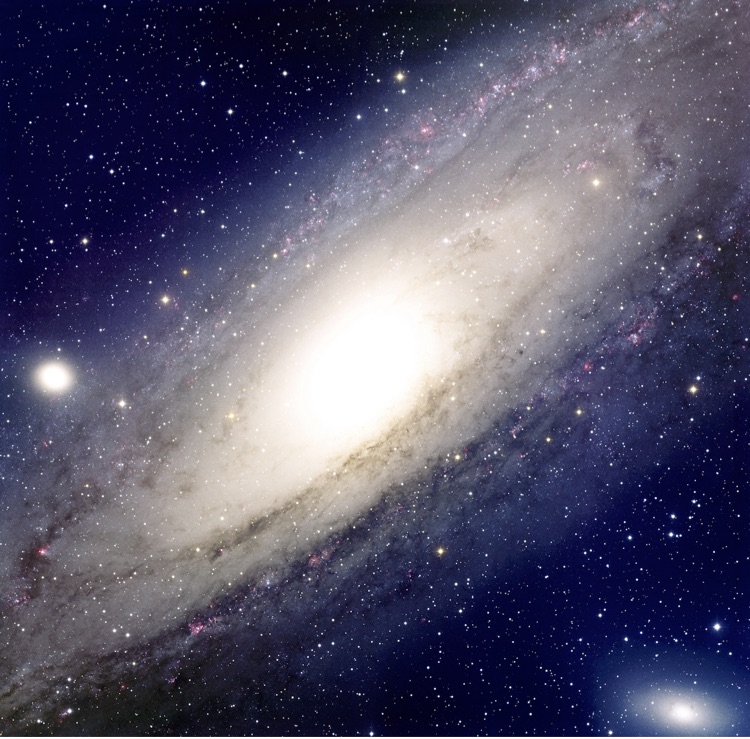
Figure 31. Andromeda M31, revealing a glowing blue halo with subtle blue energy-bridges to its companion galaxies, well beyond its field of stars. True-color image from Kitt Peak Observatory. Dark Matter? Light Scattering (by what)? A Blue Fluorescence? Cosmic Water? (Photo © by Travis Rector, Kitt Peak National Observatory, NOAO/AURA/NSF) (Web ref. 11)
Do we live in an energetic water universe? Besides water-drenched Quasars at the edge of known space, significant water is known to exist within our own solar system. (Web ref. 13) Many of the moons of Jupiter and Saturn are known to be water-ice in surface composition, as are many comets. Mars and other planets show surface drainage or scouring features, along with direct evidence in ice-caps, suggesting they once possessed a much greater quantity of water than today. It appears, the more the scientific community looks for water in the cosmos, the more it is being found.
With growing evidence that water might be one of the most abundant molecules in the universe, an “outrageous hypothesis” forces itself: Is it possible, as with “water drenched” Quasar APM 08279+5255, that cosmic water exists in open space near to Andromeda, and thereby is excited into fluorescence by Andromeda’s own intense stellar radiations? Is the blue glow surrounding M31 yet another expression of “blue-fluorescing cosmic water”? Or alternatively, is this blue color exactly as the heretic Wilhelm Reich described it: a cosmic energy which attracts and infuses into water within the Earth’s atmosphere and crust, concentrating inside the ORAC, into cyclonic storms, into high-dielectric materials and DNA, whereupon it works an influence upon water? And where under proper excitation, we may observe it with our eyes in the visible part of the spectrum, as well as detect it in spectrometers and by other means? Is the blue-glowing “energy-water stuff” the long-sought self-organizing principle, the “galactic glue” or cosmic-creation negative-entropic force which, by conventional empty-space dead-universe theory is termed “dark matter”? And shouldn’t exist? Except, it does exist, and isn’t dark either. It is blue.
I am reminded of the example of a dozen blind scientists in a room with an elephant, each of which is grasping a different part of the beast – the trunk, the tusks, the legs, the body, the tail – and each giving widely divergent descriptions, all of which are 100% accurate, but all of which also suffer from great magnificent error. By focusing upon the differences, they miss the larger pattern of similarities that clarifies just what is being observed and measured. By Occam’s Razor, this cosmic energy-water postulate – for which I credit Reich above all the very significant others – rather forces itself, and commands rational attention, open debate, and new lines of experimental investigation.
Discussion with Reviewers
Reviewer: Could a researcher place the cuvette directly in the ORAC or in cardboard control instead of holding the water in a dish?
Author: This was tried initially, with separate 10-cm cuvettes placed directly inside a small ORAC, which was nested inside a larger ORAC, with Control water in separate cuvettes placed inside the cardboard Control. This method produced similar results, but required a longer charging time to yield the same magnitude of effect. The method using large open evaporation dishes provided a higher surface-area of the water to the influences of the ORAC and Control interiors, and proved to be a more optimal methodology. I found that placing the water samples inside sealed glass bottles would inhibit the effect. I also tried quartz-glass containers, and found they also blocked the effect. By using the evaporation dishes exposing a larger surface area of water to the interior of the ORAC, the water more easily absorbed the ORACs influence, and produced strong spectral reactions starting within a few hours, and maturing after a day or two. The Control water, also exposed to the open air in an identical evaporation dish, under a cardboard box, showed little or no spectral changes, indicating the ORAC enclosure induced the spectral reactions, and that it was not something produced merely by atmospheric gasses. A whole range of stirring, mixing and bubbling experiments was also undertaken, showing variable results, and not reported in my paper, except that such effects require the water samples to not be subjected to significant turbulence. It is my intention to write up a follow-up paper on the issues of water sloshing, stirring and bubbling, as it relates directly to the water experiments of Viktor Schauberger and Jacques Benveniste, and to such issues as homeopathic preparations.
Reviewer: You provide strong additional evidence for (i) the existence of a substantive form of energy, consistent with prior works by Wilhelm Reich; (ii) the effectiveness of Wilhelm Reich’s Orgone Accumulator (ORAC) in affecting water absorption and fluorescence properties. Further work exploring the spectral responses of an Orgone-charged high-vacuum tube (Reich’s VacOR tube) under specific EM excitations would be a natural expansion. Assuming this is feasible.
Author: Yes, it is feasible and worthwhile thing to investigate, also to make comparisons between the same kinds of high vacuum tube, but without charging inside the ORAC. Reich noted that his ORAC-charged vacuum tubes would illuminate at a lower voltage excitation than uncharged ones. My own experiments on this yielded blue illumination by hand-stroking only, which is only a few hundred millivolts at best. His point was, the atmosphere and the vacuum are filled with an excitable “something” – his Orgone energy continuum – which expressed a blue color when sufficiently excited. The VACOR experiment also could be undertaken in vacuum tubes devoid of nitrogen gas, given how nitrogen also glows blue under excitation.
Reviewer: Were there significant thermal gradients measured in the OR-charged water samples?
Author: None that I am aware of, and the issue of thermal influences was addressed. I always allowed the jugs of distilled water to equalize with the room temperature, over days, before they were opened, portioned out and examined spectroscopically. The different parts of the laboratory room where the ORAC and Control enclosures were located were always darkened, only diffuse sunlight entering, no heaters or light bulbs being on constantly, no air conditioning at all, and so they both equalized close to the same ambient air temperature. I also did some control tests of distilled water slowly heated to different temperatures, but no changes of significance were noted until the water was significantly heated, to around 70˚C. I observed, if the water was heated that high, or higher to where convection and some air-bubbles began to appear, chaotic spectral absorbance reactions increasingly occurred, spreading across all visible frequencies. At ordinary room temperatures, no such effects were noted.
A review of published literature on this question indicated Infrared frequencies would be sensitive to lesser thermal influences, but not in the lower ranges below around 550 nm. For example, see Röttgers, et al, Temperature and salinity correction coefficients for light absorption by water in the visible to infrared spectral region, 2014, DOI:10.1364/OE.22.025093
This paper reports that between 15˚ to 60˚, water experiences an absorption change of −0.036% per °C, a very minor lowering of absorption characteristics per degree of temperature increase due to decreasing optical density. Such an influence would hardly be detected.
Of interest is how in all my experiments, no significant variations between the ORAC and Control water samples appeared in frequencies above 550 nm out to 900 nm, the higher-end cut-off sensitivity of my UV-Vis Spectrophotometer. This suggests whatever small thermal variations as existed in my laboratory, between the ORAC and Control water, were too small to produced observable spectroscopic influences.
Reviewer: Does Figure 12 suggest a stronger shift in peak absorption towards lower wavelengths for longer (> 40 days) Orgone charging time or is it an artefact of the fact that the spectrometer was reaching saturation?
Author: If you review my Figure 11, it presents another run of gradually increasing absorption intensities over shorter charging periods than Figure 12, showing a similar shifting pattern towards the far-UV, well before the intensity approached any possible saturation. Overall, ORAC-charging and strong Pacific storm-water (rain or melted snow) both show this increase in the far-UV absorption spectra. It gives the impression that the natural far-UV absorption maximum in water at 180-200 nm gets shifted closer to the mid-UV of ~220 nm, when the water in question gets more highly structured, or more strongly charged with this one-same cosmic factor. Water then absorbs out the far and mid UV more strongly, while radiating in the near-UV and blue frequencies. My impression is, there must be some very interesting things going on in the range out to 180 nm or beyond, and I’d like to obtain equipment that would allow those frequencies to be examined. It is a rather dynamic phenomenon, not anything suggestive of a mechanically- or instrumentally-induced artifact.
Reviewer: For much longer Orgone charging time (> 40 days) should one expect a variable maximum for the absorbance and fluorescence amplitudes? Varying with various geo-cosmic factors.
Author: That is a reasonable hypothesis, but I speculate variations would also appear with shorter charging times, such that a daily 24-hour charging might reveal geo-cosmic variability. But as noted above, I could not sustain doing these experiments on a daily basis, by which to review the results against sunspot number or lunar cycle, weather changes, etc. I have other instrumental methods set up with automatic data recording that show the ORAC does react to sunspots. Notably this is found in the anomalous behavior of a neutron counter constantly charging inside a very strong ORAC. The readings were initially only 1 or 2 cpm, but gradually began to ramp up the longer the instrument was kept inside the ORAC. A few years ago it yielded upwards of 4000 cpm during the height of the last sunspot cycle, but now declines to a variable 100 to 500 or so cpm. This is from an instrument which normally yields 1 or 2 cpm from natural stray thermal neutrons, and there is nothing radioactive in my ORAC devices. The ORAC experiments are indicative of a common energetic-continuum mechanism for such geo-cosmic influences, a natural ubiquitous cosmic energy which is amplified inside of it.
Reviewer: Reich did observe similar fluorescence at work inside sealed high vacuum tubes kept within an ORAC (Reich’s VacOR tubes) and subsequently excited with EM radiation. From the author’s past experiences with the VacOR Tube, what would be the main difficulties in performing a similar spectral characterization on a VacOR tube?
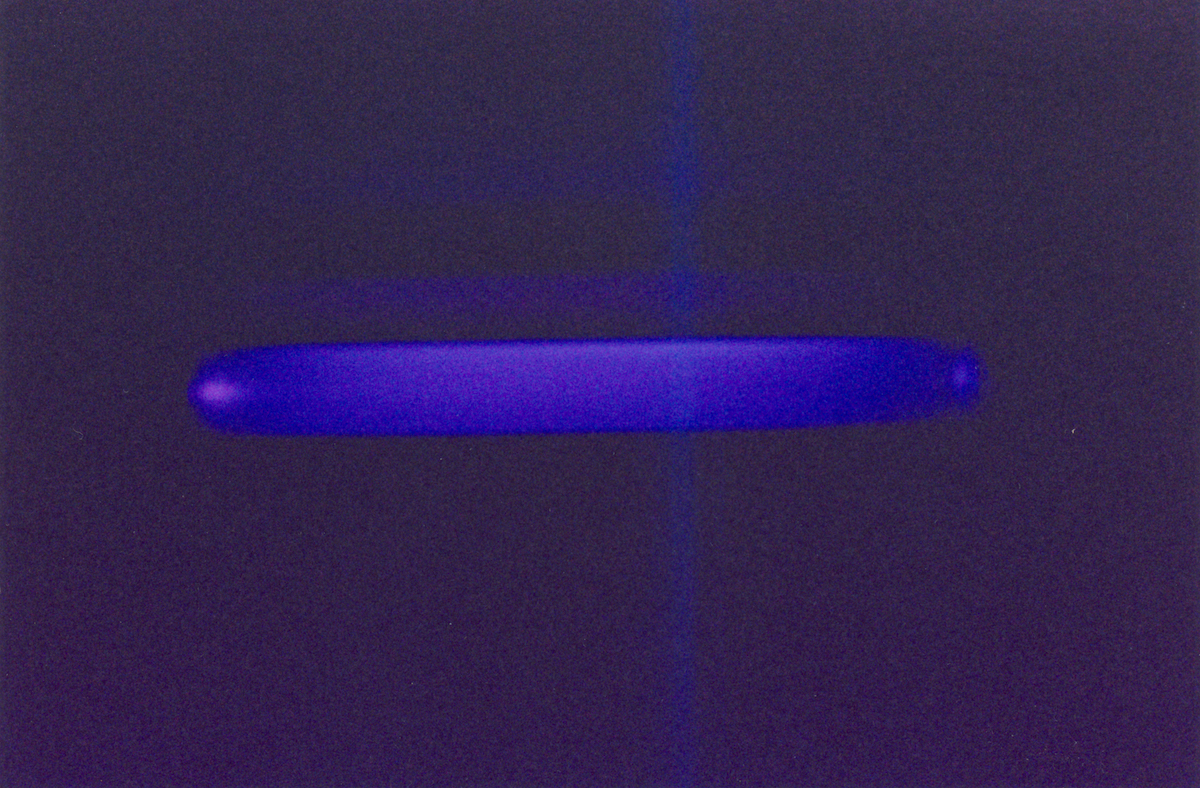
Author: I did make a long-exposure color photograph of a glowing vacor tube, excited by hand-stroking (above). It was captured inside the metal-lined orgone energy darkroom (a small room-sized ORAC) at my laboratory, and required a 20-minute exposure with 3600 asa 35mm color film, during which time it was gently stroked by hand. As you can see, visually is within the spectral range of the blues seen in ORAC-charged water fluorescence. One can easily see individual flashes of this phenomenon in the dark, which occur with each hand-stroke. But the human eye is far more sensitive than most film or digital cameras. I tried to make a spectroscopic evaluation of this, but ran into technical difficulties, in securing the spectrometers’ small-diameter fiber-optic cable to an optimal flash-point inside the tube. There are methods to encompass a larger optical diameter of view, new instruments for making whole sky or forest-canopy spectral readings and similar, but these have not yet been explored. I also wish to get one of the newer Generation 3 image intensifiers, or a PMT “biophoton” device sensitive in the UV and blue frequencies, for further investigations. Our limited budget for research equipment does not allow it, unfortunately.
Reviewer: Water vapor can easily form coherent ensembles [ref 25] — probably even in clouds — could this happen also within the ORAC? Clouds act indeed as special structures — although unpublished, del Giudice speculated about the coherent nature of these ensembles, but more on that further below; yet from that what is known we can say that clouds induce an additional capacitive layer within the atmospheric column whereby charge accumulation is one of several macroscopic phenomena; stacking various layers together sooner or later leads to charge-buildups (see ref [4] Ch.VI, p.62, fig.55); since we can’t consider them as separate electrodynamic entities, the cross-related emf-based interaction must be nothing but coherent; [4] Israel H (1957) Luftelektrizitaet und Radioaktivitaet, Springer, Berlin (DE); [25] Madl P, Del Giudice E, Voeikov VL, Tedeschi A, Kolarž P, Gaisberger M and Hartl A (2013) Evidence of Coherent Dynamics in Water Droplets of Waterfalls. Water, Vol.5: 57-68
Author: I had some interesting discussions with Emilio del Giudice on these matters, given our mutual interests in Reich’s theories, his cloudbuster device (which I have tested out with much success), and the question of how the ORAC functions to heal and elicit anomalous phenomena. The issues of cloud growth and rains, and their opposite of drought retain many mysteries to the typical meteorologist, who might reject either of our viewpoints. What is known from research is how local high humidity reduces the ORAC’s charge, and lower humidity increases it, which in my estimation points to ordinary capacitive-type charging effects, in my analogy of the “hollow capacitor”. Emilio’s ideas were more in line with quantum electrodynamics. It is true, the formative dynamics of the higher charge in the ORAC is similar to that by which clouds appear, and the accumulator’s charge is dependent upon these local variations in weather.
As to air ionization, some years ago, I made preliminary tests on the ORAC with an Alphalab air ion meter, and also with a Trek 156A charged-plate monitor. Both showed generally higher readings inside the ORAC than outside. However, the variability of readings was large and my testing was undertaken only episodically, when I had free time, without any systematic effort. So I never published on it. I concluded that to understand those parameters I would need to purchase a second instrument of each kind (one inside the ORAC, one outside) and run them on data recorders over a period to ascertain the differences. The charged-plate monitor device measures a parameter similar to Reich’s electroscopical discharge rate experiment, which I reported under the heading “Anomalous ORAC Electrostatic Phenomena.”
It would be remarkable, however, if all these effects of the ORAC were the result of small air ions, as by conventional theory the ORAC has no direct means by which to generate or accumulate them preferentially over the Control box. There are similarities, nonetheless. For example, air ion generators have been used to treat people with severe burns, to reduce pain and speed healing, by enclosing them in a tent where the air ion generator is running. The ORAC is also known to have equally or stronger healing effects upon severe burns, to the point that one physician Dr. Med. G. Kavouras once wrote “…every physician who fails to treat medium or severe burns with the orgone energy commits medical malpractice.” (“Jeder Arzt, der Kenntnis und Möglichkeiten zur Anwendung der Orgonenergie hat und der eine mittlere oder schwere Verbrennung nicht mit zusätzlicher Hilfe der Orgonenergie behandelt, begeht einen ärztlichen Kunstfehler” -in Kavouras, J (2005) Heilung mit Orgonenergie: Die medizinische Orgonomie. Turm Verlag, Bietighem, Germany, p.73.) I personally treated a severe burn with an Orgone accumulator after stepping bare-foot on a red-hot soldering device, and was amazed at the speed in which the pain was eliminated, and at which it healed thereafter. During the treatment, I could see the tissues slowly recovering, almost (but not quite) as in the science-fiction movies, where a doctor of the future waves a strange device over a wound. The popular short film “It Can Be Done” shows a dramatic re-creation of this, one of the reasons why Reich remained ferociously committed to his patients, and to defending his research.
Reviewer: Would a mechanically perturbed water sample be a much better source of this UV-fluorescence? For example “vigorous bubbling, shaking or stirring” of liquids as such procedures are known to induce sonoluminescence …. Already in 1700 Johann Bernoulli observed that mercury in a phial well exhausted of air gave a brilliant light whenever the tube was shaken…. (see ref [2], p.338); even though back then Hg was used with flashes of light detectable with the naked eye, nowadays this can be observed with water too when using a PMT. Here, ref [21], fig.4 nicely seems to confirm this thought, showing how vigorous shaking leads to imploding bubbles that are “charged by sono-acoustic luminescence” in the UV-range. [2] Young FR (1999) CAVITATION, Imperial College Press, Watford College, Hertfordshire (UK) / Distributed by World Scientific Publishing (Singapore); [21] Belovolova LV, Glushkov MV, Vinogradov EA, Babintsev VA, Golovanov VI (2009) Ultraviolet Fluorescence of Water and Highly Diluted Aqueous Media. Physics of Wave Phenomena, Vol.17(1): 21-31.
Author: The paper by Belovolova et al, is excellent, not known to me previously. It was most interesting to read their opening statements that the “intensity of UV luminescence decreases with water purification”, and that while humates and other organic compounds in natural water tend to yield a natural UV fluorescence, “…it seems impossible to explain all features of fluorescence of aqueous media only by the presence of impurities”. There is no reason to believe my ORAC-charged distilled water was acquiring any absorbing or fluorescing impurities, as if so the Control distilled water would also show a similar absorbance and fluorescence, which it did not. I have added a few sentences into my paper with reference to the Belovolova et al. findings.
For the record, I am generally familiar with the phenomena of sonoluminiscence and homeopathic succussion effects, which require a significantly larger amount of imparted mechanical energy than what ever existed in the water-handling procedures in my lab. Also the work of Viktor Schauberger on the general effects of water swirling and vortexing are known to me, though he never undertook quantitative experiments to verify the observed macro-scale results of his field applications in the early 1900s. My efforts to induce spectral signatures in water by gentle swirling were not successful, but vigorous swirling of water — as when placed on a beaker shaker for 24 hours — did so. Again, this intensity of motion never existed in my own experimental procedures — one experiment waiting to be made, however, is to swirl the water while inside the ORAC, with another being swirled simultaneously outside of it.
Also I am familiar with the various partial-vacuum “glow tubes” with liquid mercury, since my youth in fact. I’ve studied the works of G. Piccardi on the influences of these shaken-tubes upon water “activation” by such methods. Several such devices are in my lab, in particular the American “Scalebuoy” devices from the 1930s used to de-scale boilers by increasing the solvent properties of water when the device is shaken when immersed in that water. (See my 2011 paper in Water) It yields a dim blue flash of light that can be seen when shaken in the dark. The effect was too dim to measure using my spectroscope, unfortunately, but it appears to be a similar color as the “vacor” phenomenon, of ORAC-charged vacuum tubes excited by hand-stroking, as described with color photograph on the cover of the DeMeo 2009 publication, cited in my submitted paper.
I have only begun to investigate use of luminol in water (at the suggestion of V. Voeikov) to try and elicit more visibly observable and measurable effects in the ORAC-charged water.
From such observations, my spectroscopical protocol always avoided bubbling, shaking, turbulent pouring or swirling of the water samples. And again, both ORAC-charged and Control water samples were treated identically on these mechanical factors, with conscious attention to avoid them. The Control water sources thereby remained relatively inert, showing little or no developments of UV absorption or UV-blue fluorescence. However, the ORAC-charged water did yield these spectral reactions, systematically so.
Reviewer: Distilled water is a good candidate for Konovalov’s theory on nanoassociates (see ref.[22], p.50), could you comment on that, particularly with regard to the ORAC?
On p.58 of that paper it keeps going: 190-300 nm UV spectral features of “serial diluted vigorous shaken aqueous strong electrolyte solution” for ~10-13 M < C <10-7 M are solute independent, differ from bulk water and are similar to those of Exclusion Zone Water and Iterative Nafionized Water … For Exclusion Zone Water and Iterative Nafionized Water, these features were ascribed to the quasi free electrons of CDelec H2O interacting with UV … hence, CDelec H2O formation is mediated by UV-EMF (ref.[23], p.74).
In this regard, the work of prof. Belloussev is noteworthy as he could show that during morphogenesis, the smaller cellular entities autoluminesce rather within the UV-region, whereas larger ones do so rather within the VIS-IR region (see ref.[24], fig.7, p.16) – an observation that may well have relevance for the bions described by Reich. [22] Yinnon TA, Liu ZQ (2015) Domains Formation Mediated by Electromagnetic Fields in Very Dilute Aqueous Solutions: 2. Quantum Electrodynamic Analyses of Experimental Data on Strong Electrolyte Solutions. WATER Vol.7: 48-69; [23] Yinnon TA, Liu ZQ (2015) Domains Formation Mediated by Electromagnetic Fields in Very Dilute Aqueous Solutions: 3. Quantum Electrodynamic Analyses of Experimental Data on Strong Electrolyte Solutions. WATER Vol.7: 70-95; [24] Volodyaev I, Beloussov LV (2015) Revisiting the mitogenetic effect of ultra-weak photon emission. Front. Physiol. 6:241. doi: 10.3389/fphys.2015.00241
Author: The work of Belovolova et al on fluorescence in pure or distilled water sources is excellent. As noted above, I included several sentences into my paper which reference their findings, with citations to their work given in several places. I also added a neglected reference to Gurwitsch at the top of page 2, in the section detailing different science pioneers, with a reference to Beloussov, et al (2000, 2007), which is of similar topic to your ref. 24, but which I could not locate so far.
With respect to Reich’s blue-glowing bions, my discussion makes it clear that they do not spontaneously glow blue, as in luminescence like fire-flys. It is an energetic field that requires excitation by brightfield microscopy in the living state for the blues to appear. And if one uses darkfield with a UV-containing light source, the intensity of blue is all the greater. My Leitz microscope, which made those photos, has the very best apochromatic lenses with compensating eyepieces, and so gives a true-color representation. The usual achromatic lenses show the energy field, but the colors are more prismatic, with as much red as blue. This is another thread deserving of follow-up investigation.
With respect to theoretical models employing QED mechanisms, this is a very interesting set of questions, but in my opinion far too complex for discussion in this paper. As noted, it reminds me of my conversations with Emilio del Giudice. As I argued with him, in a friendly and cooperative spirit, I am not ready to accept that QED mechanisms are at work inside the orgone accumulator, nor in bions or blood, nor in ORAC-charged water, nor in blue-fluorescing lake or hot spring waters, or blue glacial ice. My reluctance on that emerges from a greater appreciation for the older theories of cosmic ether and cosmic life-energy, which pre-date the development of the major physical theories of today — such as Einstein’s relativity, Big Bang creationism, and QED. It could be, a modified view of QED maybe along the lines of Bohm would be reconcilable, a common point of understanding? This I do not know. But from my limited knowledge of QED, it appears to require some kind of interconnecting medium by which quantum influences could be transmitted. Space-time arguments seem lacking in empirical foundations, so I would argue the cosmic-ether/life-energy model, borne from the scholars I cite in my early paragraphs, could provide an empirical bridge of understanding.
Supporting Data
References
Arp H (2003) Catalogue of Discordant Redshift Associations. Aperion, Montreal. See Appendix A and B specifically.
Baker CF (1980) The Orgone Energy Continuum. Journal of Orgonomy, 14(1):37-60.
Baker, CF (1982) The Orgone Energy Continuum: the Ether and Relativity. Journal of Orgonomy, 16(1):41-67.
Becker RO (1998) The Body Electric: Electromagnetism and the Foundation of Life, Wm. Morrow, NY.
Belovolova LV, Glushkov MV, Vinogradov EA, Babintsev VA, Golovanov VI (2009) Ultraviolet Fluorescence of Water and Highly Diluted Aqueous Media, Physics of Wave Phenomena, 17-1, pp 21–31.
Beloussov L, Popp FA, Voeikov V, vanWijk R, Eds. (2000) Biophotonics and Coherent Systems: Proceedings 2nd Alexander Gurwitsch Conference, Moscow U. Press.
Beloussov L, Voeikov V, Martynyuk VS, Eds. (2007) Biophotonics and Coherent Systems in Biology: Proceedings 3rd Alexander Gurwitsch Conference, Springer.
Bracewell JM, Gall D, Junge C, Scheiche G (1967) Proceedings, Symposium on Physico-Chemical Transformation of Sulphur Compounds in the Atmosphere and the Formation of Acid Smog, No.2, OECD, Mainz, Germany, pp.17-26, 31-38, 53-61.
Bradford CM, Bolatto AD, Maloney PR, Aguirre JE, Bock JJ, Glenn J, Kamenetzky J, Lupu R, Matsuhara H, Murphy EJ, Naylor BJ, Nguyen HT, Scott K, Zmuidzinas J (2011) The Water Vapor Spectrum of APM 08279+5255, Astrophys. J. Let. arXiv:1106.4301.
Brown FA (1975) Evidence for External Timing in Biological Clocks, in An Introduction to Biological Rhythms, J. Palmer, Ed. Academic Press, NY, pp.209-279.
Burr, HS (1972) Blueprint for Immortality. C.W. Daniels, Springfield, MO.
Chai B, Zheng J, Zhao Q, Pollack GH (2008) Spectroscopic Studies of Solutes in Aqueous Solution. J. Phys. Chem. A 112:2242-2247.
Chen CS, Chung WJ, Hsu IC, Wu CM, Chin WC (2012) Force Field Measurements Within the Exclusion Zone of Water. J. Biol. Phys. 38:113-120.
DeMeo J (1975) Effect of Fluorescent Lights and Metal Boxes on Growing Plants. J. Orgonomy, 9(1):62-68.
DeMeo J (1983) A New Approach to the Acid Rain Problem, unpublished monograph, Orgone Biophysical Research Laboratory.
DeMeo J (1993) Anti-Constitutional Activities and Abuse of Police Power by the US Food and Drug Administration and Other Governmental Agencies,” On Wilhelm Reich and Orgonomy: Pulse of the Planet 4:106-113.
DeMeo J (2004) A Dynamic and Substantive Cosmic Ether, Proc. Nat. Phil. Alliance, 1(1):15-20. (Reprinted as an Appendix in DeMeo 2010)
DeMeo J (2010) The Orgone Accumulator Handbook. 3rd Revised Updated Edition, Natural Energy Works, Ashland, Oregon. (See Chapters 5, 6, 7, 10, 11, 13 and Part III)
DeMeo J (2011a) Dayton C. Miller Revisited, in Should the Laws of Gravitation Be Reconsidered? Hector A. Munera, Editor, Aperion, Montreal, pp.285-315.
DeMeo J, Ed. (2011b) Heretics Notebook: Emotions, Protocells, Ether-Drift and Cosmic Life-Energy, with New Research Supporting Wilhelm Reich, Natural Energy Works, Oregon. (See Sections on Bions, Orgone Biophysics, and cover photos)
DeMeo J (2011c) Water as a Resonant Medium for Unusual External Environmental Factors, Water, 3:1-47.
DeMeo J (2013) In Defense of Wilhelm Reich, Natural Energy Works, Ashland, Oregon. pp. 89-114. (See Chapter 3)
DeMeo J (2014) Does a Cosmic Ether Exist? Evidence from Dayton Miller and Others. J. Sci. Exploration, 28(4):647-682.
DeMeo J, Ed. (2015) On Wilhelm Reich and Orgonomy, Natural Energy Works, Oregon. (See pp.37-42)
DeMeo J (2018) The Dynamic Ether of Cosmic Space (in press), Natural Energy Works, Ashland, Oregon.
DeMeo J, Senf B, Eds. (1997) Nach Reich: Neue Forschungen zur Orgonomie. Zweitausendeins, Berlin. (See Part II)
De Ninno A (2013) Different Kinds of Water and Coherent Processes in Biology, Conference on the Physics, Chemistry and Biology of Water, Web Ref.15.
Elia V, Ausanio G, De Ninno A, Gentile F, Germano R, Napoli E, Niccoli M (2013) Experimental evidence of stable aggregates of water at room temperature and normal pressure after iterative contact with a Nafion® polymer membrane, Water Vol.5: 16-26.
Galaev YM (2001) Ethereal Wind in Experience of Millimetric Radiowaves Propagation. Spacetime and Substance, 2(5-10):211-225.
Galaev YM (2002) The Measuring of Ether-Drift Velocity and Kinematic Ether Viscosity Within Optical Waves Band. Spacetime and Substance, 3 (5-15):207-224.
Ho MW (2012) Living Rainbow H2O, World Scientific Publishing, Singapore, Ch.11. https://doi.org/10.1142/8418
Israel H (1957) Luftelektrizitaet und Radioaktivitaet, Springer, Berlin.
Kolarž P, Gaisberger M, Madl P, Hofmann W, Ritter M, Hartl A (2012) Characterization of ions at Alpine waterfalls. Atmos. Chem. Phys., 12, 3687-3697.
Lakowicz JR, Shen B, Gryczynski Z, D’Auria S, Gryczynski I (2001) Intrinsic Fluorescence from DNA Can Be Enhanced by Metallic Particles. Biochem. Biophy. Res. Com. 286:875–879.
Miller D (1928) untitled lecture in “Conference on the Michelson-Morley Experiment”, Astrophysical Journal, LXVIII:341-402; also in Contributions From the Mount Wilson Observatory, No.373, Carnegie Institution of Washington.
Miller D (1933) The Ether Drift and Determination of the Absolute Velocity of the Earth, Reviews of Modern Physics 5(2):203-242.
Miller JM (1980) Special Session on Precipitation Chemistry, Bull. Am. Meteorol. Soc., 61:1623.
Munera HA (2002) The effect of solar motion upon the fringe-shifts in a Michelson-Morley interferometer a la Miller. Annales de la Fondation Louis de Broglie, 27 (3):463-484.
Munera HA, Hernandez-Deckers D, Arenas G, Alfonso E (2006) Observation During 2004 of Periodic Fringe-Shifts in an Adialeiptometric Stationary Michelson-Morley Experiment. Electromagnetic Phenomena (Inst Electromag Res, Kharkov, Ukraine), 6(1):70-92.
Ozaki Y, Morisawa Y, Ikehata A, Higashi N (2012) Far-Ultraviolet Spectroscopy in the Solid and Liquid States: A Review, Applied Spectroscopy. 66(1):1-25.
Persinger MA (2014) Quantitative Convergence Between Physical-Chemical Constants of the Proton and the Properties of Water. Int. Let. Chem. Phys, Astron. 2:1-10.
Piccardi G (1962) Chemical Basis of Medical Climatology, Charles Thomas Pub., Springfield, MO. (See Chapters II through IV)
Piccardi G (1965) Intensity of Solar Corona, Wolf Number, Biological and Chemical Tests. Geofisica e Meteorologia 14(3-4):77-78.
Piccardi G, Capel-Boute C (1972) The 22-year Solar Cycle and Chemical Tests. J Interdiscip. Cycle Res. 3(3-4):413-417.
Pollack GJ (2013) The Fourth Phase of Water: Beyond Solid, Liquid and Vapor. Ebner & Sons, Washington.
Pollack GH, Figueroa X, Zhao Q (2009) Molecules, Water, and Radiant Energy: New Clues for the Origin of Life. Int. J. Mol. Sci. 10:1419-1429.
Rafael C, MacDonald HE (1952) Orgonomic Diagnosis of Cancer Biopathy. Wilhelm Reich Foundation, Maine. (Avail. From http://www.wilhelmreichtrust.org bookstore)
Reich W (1944) Orgonotic Pulsation: The Differentiation of the Orgone Energy from Electromagnetism, Presented in Talks With an Electrophysicist. Int. J. Sex-Economy and Orgone Research. Vol.3, p.97-150, Rangeley Maine.
Reich W (1945) Experimental Demonstration of the Physical Orgone Energy, Int. J. Sex-Economy and Orgone Research. Vol.4 p.133-146, Rangeley Maine.
Reich W (1951) The Orgone Energy Accumulator, Its Scientific and Medical Use, Orgone Institute Press, Maine, p.16, 18, 35. (Available from http://www.wilhelmreichtrust.com bookstore)
Reich W (1973a) Function of the Orgasm. Farrar, Straus & Giroux, NY. (See Chapter IX)
Reich W (1973b) The Cancer Biopathy. Farrar, Straus & Giroux, NY. (See Chapters III and IV)
Reich W (1973c) Ether, God and Devil; Cosmic Superimposition, Farrar, Straus & Giroux, NY. (See Chapter VI in E.G.D, and Chapters III and V in C.S.)
Reich W (1973d) Selected Writings: An Introduction to Orgonomy, Farrar, Straus & Giroux, NY. (See Sections I, IV, V, VI)
Reich W (1979) The Bion Experiments. Farrar, Straus & Giroux, NY.
Schmidt KB, Rix HW, Shields JC, Knecht M, Hogg DW, Moaz D, Bovy J (2011) The Color Variability of Quasars, Astrophys. J. 744(2):1-16.
Sensorex (2017) Technical Education pH; also in pH Measurement Electrode Basics, Omega Instruments, see Web Ref.14.
Thomson W (1868) On a self-acting apparatus for multiplying and maintaining electric charges, with applications to illustrate the Voltaic theory. Proc. R. Soc. Vol.XVI: 67-72.
Vaya I, Gustavsson T, Miannay FA, Douki T, Markovitsi D (2010) Fluorescence of Natural DNA. J. Am. Chem. Soc. 132(34):11834–11835.
Vermeulen AJ (1980) The Acidic Precipitation Phenomenon. Netherlands, in Polluted Rain, Toribara TY, et al., Eds, Plenum Press, NY, p.15-21.
Waldman JM (1981) Chemical Composition of Acid Fog. Science, 218:677-680.
Warren SG, Brandt RE, Grenfell TC (2006) Visible and near-ultraviolet absorption spectrum of ice from transmission of solar radiation into snow. Applied Optics, 45(21):5320-5334.
Zheng JM, Chin WC, Khijniak E, Khijniak Jr E, Pollack GH (2006) Surfaces and interfacial water: Evidence that hydrophilic surfaces have long-range impact, Adv. Colloid Interface Sci. 127:19-27.
Web References
1. http://www.orgonelab.org/miller.htm
2. http://www.orgonelab.org/energyinspace.htm
4. https://www.youtube.com/watch?v=JlB-hyqxJVk
http://www.waterconf.org/participants-materials/2014/
5. http://www.orgonelab.org/orgoneaccumulator.htm
6. http://www.orgonelab.org/orgonenonsense.htm
7. http://www.orgonelab.org/bibliogPLAGUE.htm
8. http://www.orgonelab.org/wikipedia.htm
9. http://www.orgonelab.org/bibliog.htm
10. https://www.nasa.gov/topics/universe/features/universe20110722-image.html
https://www.nasa.gov/topics/universe/features/universe20110722.html
11. http://aftar.uaa.alaska.edu/gallery/img-165.html
https://www.noao.edu/image_gallery/html/im0685.html
12. http://www.robincasady.com/Astro/images/M31_FSQ_BRC_GaryLaw.jpg
http://astro.mayda.com/Img/M31_LRGB-03C-1k.jpg
http://www.astrophoto.com/images/M31.jpg
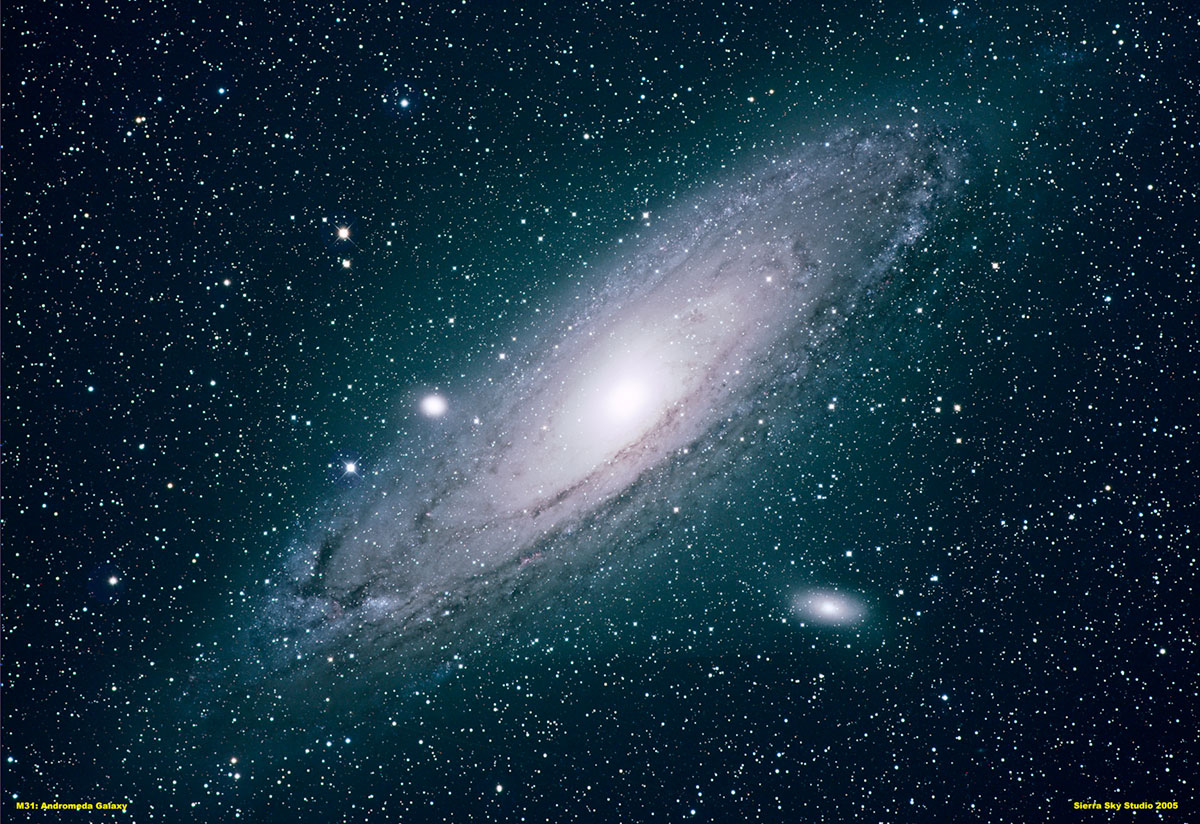
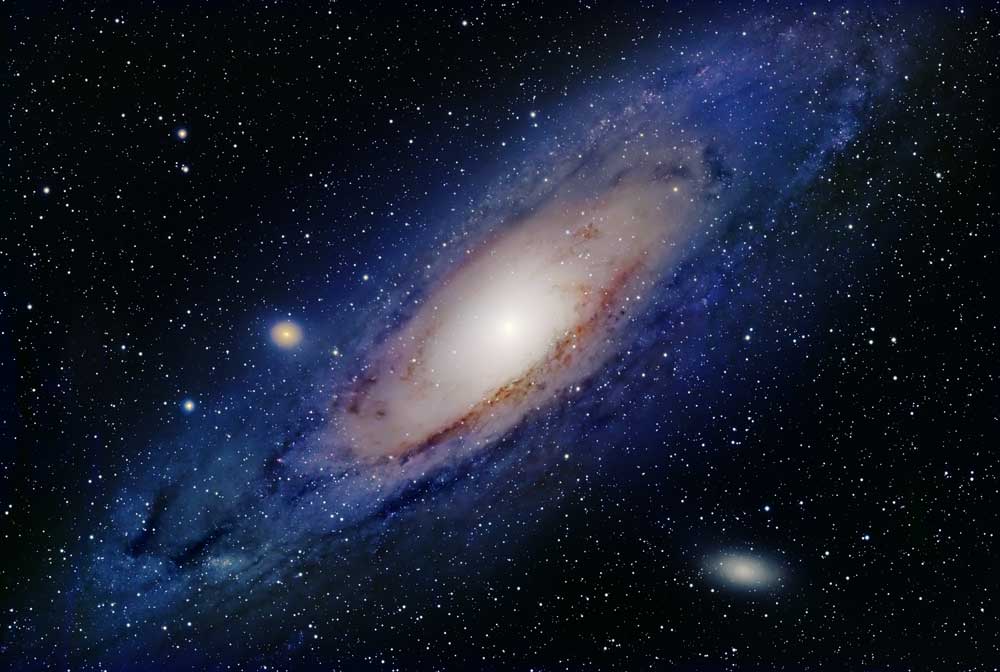
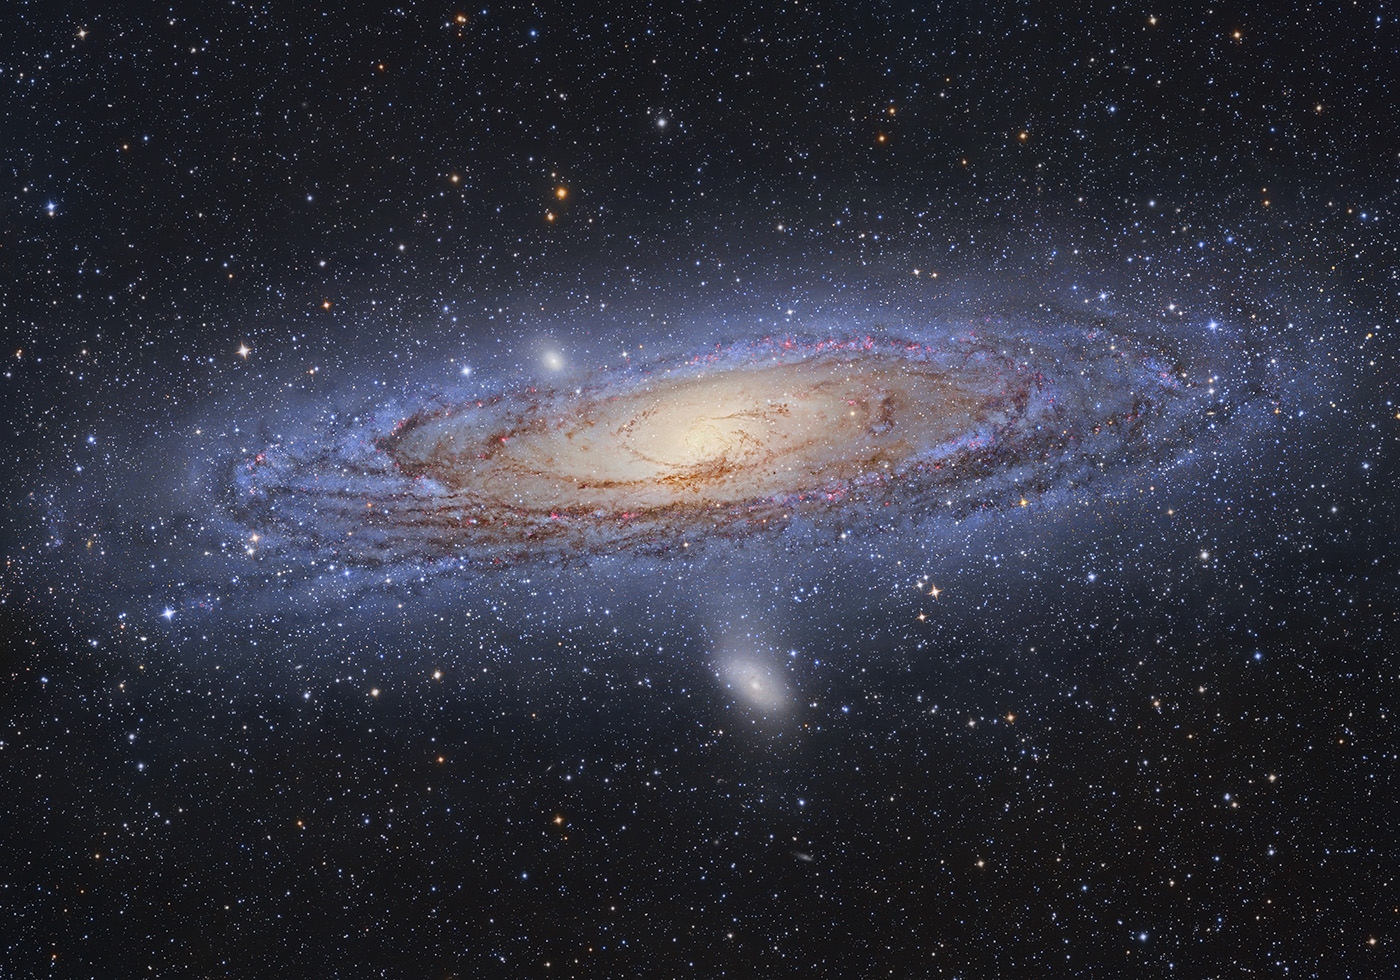
13. https://www.nasa.gov/jpl/the-solar-system-and-beyond-is-awash-in-water
14. https://sensorex.com/technical-education/
https://www.omega.com/Green/pdf/pHbasics_REF.pdf
15. http://www.waterconf.org/participants-materials/presentations/Water_Conference-_De_Ninno.ppt