
![]()
Theory Versus Experiment. What is the Charge at the Surface of Water?
Chaplin, MF1
1Department of Applied Science, London South Bank University, 103 Borough Road, London SE10AA, UK
Correspondence: martin.chaplin@lsbu.ac.uk
Key Words: interfacial water, surface charge, water-gas interface, surface tension, surface spectroscopy
Received 11 November 2008; revised 14 December 2008; accepted 6 February 2009. Published 1 July 2009. Available online 1 July 2009.
Summary
There is considerable disagreement over whether the gas/liquid surface of water is positive due to the presence of surface-active hydrogen ions or negative due to the presence of surface-active hydroxyl ions. Much has been written and many experimental and simulation studies have been undertaken. We critically analyze these studies to establish what is known unambiguously and what assumptions underlie these opposite views. The conclusion reached after this examination is that there is much misunderstanding over the strength of the evidence for hydrogen ions being surface active and less support for the positive surface than generally regarded. The surface of neutral water is negatively charged.
Article Outline
- Introduction
- Discussion
- Zeta Potential
- Image Charge
- Condensation Coefficient
- Sum Frequency Generation and Second Harmonic Generation Spectroscopy
- Surface Tension and Related Thermodynamics
- Simulations
- Autoionization and Dielectric
- Hydrogen and Hydroxide Ions
- Conclusions
- References
- Discussion with Reviewers
Introduction
One of the great debates that currently concerns water science is that of the surface of water with the atmosphere. What, if any, structure does it have? Is it positive or negative? Is it acidic or basic? Modeling studies and some molecular-scale experimental work indicate that it is positive due to the preferential presence of oxonium ions (H 3O+, H5O2+, etc.) on the surface but with no excess surface hydroxide ions. In contrast, many macroscopic experimental studies show the aqueous surface to be negatively charged. Even when similar data is derived using similar experimental methods, this data may often be interpreted differently to agree with one or the other view. Interested scientists belong to one or other of these two factions with both sides sure of their ground and suggesting that the other view is supported by incomplete or faulty models on the one side or contaminated surfaces on the other. Which view is correct? Or are they both, to some extent? The Faraday Discussion 141 (2009) and the themed issue of PCCP (10 (32) 2008) were envisaged as unifying the views on the structure of water at interfaces (McCoustra, 2008), but only served to stir the controversy deeper.
It is clear that the air-water surface, contrary to expectations of some, is a very complex system. It is a complex interfacial system and certainly not as simple as often assumed. We remain undecided over the best description for the bulk structuring of water or water’s interactions with ions and other solutes. Most importantly, our models are poor at predicting water’s properties. The surface of water is even more complex and behaves differently to other liquid surfaces just as bulk water behaves differently to other bulk liquids. Water’s surface appears even more complex than bulk water with its structure changing with temperature, gas molecules binding, ions binding or being excluded, electrical gradients being set up and with its dielectric and chemistry changing with apparent unpredictability.
How far does the surface extend? Certainly, the volume of water considered ‘surface’ should be electrically neutral and this probably best defines the surface thickness for water. The interface must include the outer monolayer, the boundary that gives rise to any zeta potential, any double layer of ions, plus deeper layers where there is surface-influenced anisotropy in either charge or structure. The depth of this surface remains undetermined but it is likely to be somewhat greater than given by most techniques that look only at a restricted range of selected properties. Clearly, such a definition of surface depth cannot encompass a charged surface. Therefore, the charge on the surface may depend upon the surface layer thickness under consideration. It may well vary between methodologies with different probe depths. Also confusing the issue is that the surface is rough rather than planar and is in constant flux. Vrij (1968) discusses how surface capillary waves on water scatter light with low intensity due to its high surface tension and low refractive index. Energetic considerations indicate, however, that these surface capillary waves are unlikely to be more than about a water diameter high due to water’s high surface tension. In addition to this, several million monolayers exchange with the gas phase every second (Shultz et al. 2000) and cause evaporation-dependent temperature gradients, so giving rise to long-lasting surface discontinuities and non-equilibrium (Khizhnyak and Khizhnyak, 2007).
The density, dielectric permittivity (Teschke and de Souza, 2005) and dipole moment of interfacial water change from their bulk water values to those of the gas over a distance generally regarded as less than about a nanometer. Thus, water’s solvation and ionization properties change at the interface, with ions and hydrophilic solutes generally being less evident at the interface but non-polar gasses being more soluble there (Vácha et al. 2004). Ions, including hydrogen and hydroxide ions, and other solutes behave differently at the surface to their behavior in the bulk. An important property of the surface concerns how it affects the local ion distribution. Some ions prefer the surface whereas others avoid it, as shown by their effects on the surface tension (Petersen et al. 2004b) and bubble coalescence (Craig, 2004).
Many papers discuss the results of a combination of simulations and experiments. It is often difficult to determine whether their conclusions are primarily those of the simulations, or those of the experimental work as interpreted using the simulations, or derived solely from the experimental work alone. The resultant discussions may be biased as a number of supporting factors of dubious significance for a point of view will never add up to much more than the best bit of support taken by itself.
In this paper, we attempt to show the conclusions that can be drawn from the different techniques and only then put the totality of the conclusions together, so trying to avoid the trap fallen in by others of selectively picking the results that support their viewpoint.
Discussion
The properties of liquid water are very different from most other liquids, with many anomalies being identified (Web ref. 1). These properties are due partially to water being a very small and highly polar molecule, but mainly due to water’s capacity to form ordered tetrahedrally-placed cooperative intermolecular hydrogen bonding. In liquid water, clusters of water molecules are continually forming and dissociating. Water clusters, when held together primarily by many hydrogen bonds, have lower molecular density and are favored at lower temperatures and pressures, whereas volumes containing poorly hydrogen-bonded water molecules collapse somewhat due to competition from multiple non-directional van der Waals attractions. Hydrogen bonds and van der Waals interactions are both distance sensitive and individually very fleeting. A typical hydrogen bond between two water molecules lasts just a picosecond or so, followed by a period much shorter than this when the two water molecules are not hydrogen-bonded to each other. Hydrogen bonding shows strong cooperativity as a water molecule that accepts a hydrogen bond is more able to donate one to another water molecule. Thus, the strength and directionality of the bonding increases in a cooperative manner with the extent of the formed cluster. However, hydrogen bonding and van der Waals interactions destructively interfere with each other, with stronger hydrogen bonding reducing the prevalence of van der Waals interactions and van der Waals interactions being more in evidence when the hydrogen bonding is weak or absent. These conflicting associations cause heterogeneities within the liquid water, such that volumes of higher and lower densities exist, if only fleetingly. These heterogeneities may be considered as connected by equilibria that shift with the physical conditions, and the presence of solutes and surfaces. How the interface may affect and, in turn, be affected by such equilibria will be discussed later.
The gas-liquid interface of water has been examined by experiment and by simulation using a number of routes. Unfortunately, these do not produce a clear picture as the resultant interpretations often play a major role in the conclusions drawn. Over the next few paragraphs, we discuss these different approaches and the problems involved in understanding these results before coming to some conclusions.
Zeta Potentia l
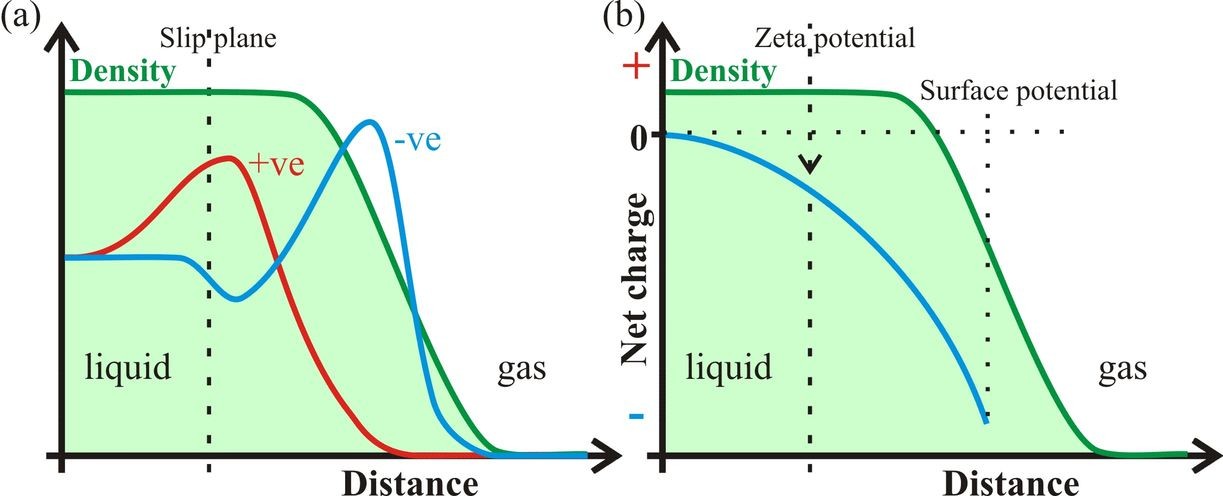
Figure 1: Assuming that the liquid-gas interface preferentially contains negatively charged ions (a), the negative zeta potential and surface potential are shown (b). The density given is for an average through both the liquid and gas phases of the rough surface and cannot be taken as showing a reduction in the density of just the liquid phase.
Zeta potential (ζ, Fig. 1) is exhibited by particles when there is a charge remaining on their surface when they are moved. It reflects the residual charge when counter-charges, within the overall neutral surface, are left behind beyond the slip plane. Zeta potentials are easily determined from the movement of such particles in an electric field and their magnitude depends on a number of factors including the dielectric constant and viscosity.
The surfaces of macroscopic particles of water certainly appear negative when their behavior is examined in an electric field. Beattie (2008) compares the many experiments going back 150 years, all showing a negatively charged aqueous surface and the lack of any experimental evidence for a positively charged aqueous surface. The simplest of experiments shows that air bubbles in neutral water are negatively charged, as they clearly always migrate towards a positive electrode.
Beattie (2007) found conclusive evidence for the presence of negative charges on oil droplets, gas bubbles, thin aqueous films and solid hydrophobic surfaces Experiments by many scientists and over many years have shown that air bubbles (cavities) in water move as though they are negatively charged in response to an external electrical field. In a similar manner, small water droplets in air are found to be negative (the waterfall effect) (Tammet et al. 2008) as are ice particles in water (Drzymala et al. 1999). In all cases, the isoelectric point appears to be about pH 3 with the negative charge apparent in pure neutral water. The consistently similar effects found in diverse fields, by different workers at different times and in different places, cannot be due to the presence of similar adventitious contamination in similar amounts. This is particularly so, as all workers in this field are aware of the possible artifacts introduced by impurities and generally seek to minimize them.
The zeta potential of the air-deionized water bubble has been subject to considerable work and was determined by Graciaa et al. (1995) to be -65 mV; a slightly higher value than as determined by others. However, there is unanimity that the value is negative and about this order of magnitude. The zeta potential appears due to hydroxide ions as it depends on hydroxide concentration but is almost independent of the identity of any other present co-anions or counter ions. The zeta potential reduces with increasing ionic strength as expected from double-layer compression, giving zeta potentials typically varying from -46 mV for 0.1 mM NaCl to -18.8 mV for 0.1 M NaCl (Yang et al. 2001). The negative zeta potential cannot, therefore, be due to other ions binding within the surface. Hydrophobic liquid (e.g. oil) and solid (e.g. Teflon) -water interfaces have similar isoelectric points to these gas-water interfaces, confirming a structural similarity between all these aqueous surfaces.
The surface charge density varies from about an electron per 1000 nm 2 for pure water to about an electron per 10 nm2 in 0.1 M NaCl. This surface charge for deionized water with air is similar to that found on small oil droplets in water. Beattie et al. (2009) found the surface-charge density at oil-water interfaces in mM salt is about an electron per 3 nm2 (at pH 7-9). These charge densities are of similar magnitude to the charge required to establish stable nanobubbles in water; estimated at about an electron per 16 nm2 for a 50 nm diameter nanobubble (Web ref. 2).
Beattie (2006) states that pH-neutral aqueous surfaces are charged due to the presence of surface hydroxide ions subsequent to enhanced autolysis of water and that positive hydroxonium ion adsorption at the surface of water is contrary to the experimental evidence (Beattie et al. 2009). This view is supported by Lützenkirchen et al. (2008) who put forward a model for the charging of hydrophobic electrolyte surfaces based upon enhanced autolysis within the structured interfacial water, with a pK w of about 7 and hence an isoelectric point of about pH 3.5. The negative charge on the surface is further supported by Hänni-Ciunel et al. (2009) who proved that the aqueous wetting film on a negatively charged surface of polystyrene sulfonate is electrostatically stabilized due to negative charges at the air water interface and by Yatsuzuka et al. (1996) who investigated the electrification of PTFE surfaces with ultrapure water. The fact that the zeta potential of strongly acid solutions is positive may be explained in a variety of ways and, as such, fails to specifically support any of the mechanisms here explained.
Zeta potential is different from the surface potential (Fig. 1), which is the potential existing across a deeper interface. In contrast to the zeta potential, the surface potential is conventionally defined such that a negatively charged surface relative to a more positively charged sub-surface is given a positive value for the potential. Studies concerning surface potential give contradictory results varying between positive and negative values of about a volt. Randles (1977) analyzed many experimental findings on real pure water and concluded that the surface potential of water is slightly positive (+80 mV), as conventionally defined, and therefore the surface is negatively charged. More recently, v. Klitzing (2005) reviewed the effect of surface composition within wetting films and also concluded that the interface is negatively charged. This is in contrast to the recent work of Kathman et al. (2008) who found the surface potential to be -18 mV using ab initio molecular dynamics on just H2O at a vacuum interface. The surface potential computed using interaction models for water are consistently about two orders of magnitude more negative than this value (Kathman et al. 2008). The low value of -18 mV for pure H2O would still be expected to attract a small amount of hydroxide ions into the surface layer.
Lastly, we dismiss claims that all these experiments, demonstating that the water surface has a negative charge, contain artifacts due to the presence of impurities or vaguely defined stirring effects. (Vácha et al. 2008b). There is simply no evidence presented in support of such conjectures.
Image Charge
The gas-liquid surfaces of aqueous solutions exclude many ions due to a combination of factors. If the ions are strongly hydrated, the ionic hydration is isotropic. Such ions cannot approach too close to the interface without losing some of this strongly held hydration water; an outcome that is energetically highly unfavorable. Additionally, due to the dielectric boundary at the interface, image charge repulsion opposes the approach of the hydrated ions to the surface (Dill et al. 2003, Fig. 2). Such image charge effects depend on the square of the size of the charge and inversely depend upon both the dielectric of the medium (at higher dielectric) in the remaining surface layer and the distance from the interface. The inverse distance dependency reduces the approach of ions to the interface. Any such effect would, however, not be expected to continue right to the outer surface as here the dielectric (ε) approaches unity and the image charge, which further depends upon the factor (ε – 1)/( ε + 1), disappears. Ions at the interface are not repelled but will tend to form ion pairs or neutral species, if possible, due to the low dielectric. Doubly charged ions, such as calcium and sulfate, avoid the interface due to their strong hydration plus the greater repulsion dependency due to the square of the charge. Image charge increases surface tension at higher ionic strength due to this ion repulsion from the surface.
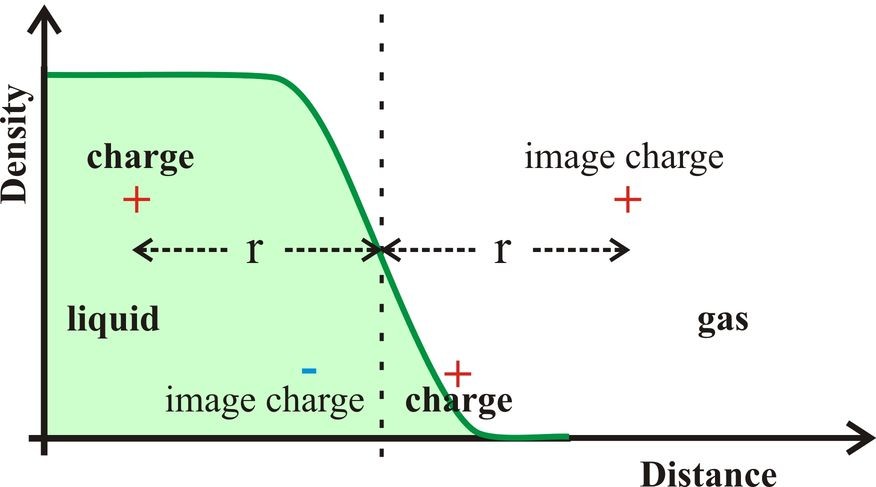
Figure 2: When an ion approaches the gas-liquid interface, it is repelled by the interface as though there was an identical charge (the image charge) equidistant from the interface on the gas side (shown at top). The effective dielectric of the medium separating the charges is that of the liquid side. If the charge lies on the outside of the interface then its image charge is attractive within the liquid phase (shown at bottom).
Image charge effects operate on the water molecules as well as the ions. As any repulsion depends on the square of the charge and as the water molecule’s oxygen atoms have twice the charge of the hydrogen atoms, water molecules are expected to reorient such that their dipoles, and hydrogen atoms, face the interface. However, the need for cooperative hydrogen bonding, the polarizability of the electrons and the low surface dielectric all mitigate any such tendency. The image charge may be negligible towards the gas side of the surface, or even cause attraction rather than repulsion. Thus, the charge distribution due to the image charge effect on unionized water molecules may well tend to oscillate within the reduced density surface layer.
The image charge affects the mobility of both hydroxonium (H 3O+) and hydroxide ions due to the high mobility of their charges in an electric field. An electric field may also occur at the surface due to counter-ions and co-ions within the double layer and their image charges. The movement of the hydroxonium and, to a lesser extent, hydroxide ionic charges are expected to rapidly compensate for fluctuations in this field. In simulations (see later) the oxonium ion ends up at the interface and necessarily equidistant between the paired hydroxide ion and the hydroxide’s image charge. This arrangement is likely to be preferred due to the known more rapid mobility of the positive charge relative to the negative charge.
Image charge effects also help stabilize hydrogen ions at the surface of small clusters, as found in simulations. The surface is the only place where the oxonium ion feels no image charge repulsion but (in contrast to most other ions) sitting at the surface does not significantly reduce its interaction capacity with neighboring water molecules.
Condensation Coefficient
The condensation and evaporation coefficients govern the rate of water vapor entering and leaving the water-vapor interface. The condensation coefficient is the ratio of the condensing mass of molecules to those colliding onto the interface whereas the evaporation coefficient is the ratio of the observed evaporation rate to the theoretical maximum rate. The two coefficients should be equal. As such, both indicate the organization of the molecules at the surface, as well-ordered surfaces should have a low coefficients due to the orientation and activation energy requirements. Unfortunately, although as expected all studies give values less than unity, there have been widely different results reported for these coefficients.
Cappa et al. (2005) showed that the evaporation coefficient is less than unity and decreases with temperature, with the activation energy being about 10 kJ mol -1 greater than the enthalpy of evaporation. This is evidence that there is a considerable barrier to free evaporation and therefore condensation, indicating considerable structuring within this surface water. Also demonstrated is that water molecules at the liquid-air interface have a tendency to form stronger, if fewer, hydrogen bonds than do those in the bulk liquid. Their later work (Smith et al. 2006) found the evaporation coefficient of water to be 0.62 +/- 0.09 and indicated the possible geometric requirements for the evaporation of a water molecule.
Other workers report much lower values for the condensation coefficient. Zagaynov (2000) find the condensation coefficient of water to be 0.001-0.01 for water droplets of radius 0.04 to 0.08 mm respectively. Jakubczyk et al. (2007) report higher values of between 0.054 and 0.12 over the temperature range of 0-25°C with a minimum value of 0.036 coinciding with the temperature of maximum density (4°C) and so agreeing with the thermodynamic evidence for the occurrence of a maximum in the surface structuring (see later). However, Kobayashi (2008) determines the value to be almost unity (0.85). This latter work, however, used a shock tube to achieve non-equilibrium, which may have upset the surface structure of water.
Sum Frequency Generation and Second Harmonic Generation Spectroscopy
Sum frequency generation (SFG) and second harmonic generation (SHG) surface spectra are spectroscopic methods for investigating the surface of water without interference from the bulk liquid. The output spectra derive from a combination of input beams. As both the bulk aqueous solution and the gas phase are isotropic, they are not active in this spectroscopy, leaving just the anisotropic interfacial layer to provide the spectra, due to a net orientation of surface molecular dipoles. The depth of this anisotropy governs the depth probed. As the spectra are acquired over periods of seconds, it is of interest that the surface monolayer may be exchanged millions of time during this period (Shultz, et al. 2000). It is thus surprising that any spectral features remain from within this ever-changing environment. Any surface-active ions must continue with unchanging spectra even though the surface is in continual flux.
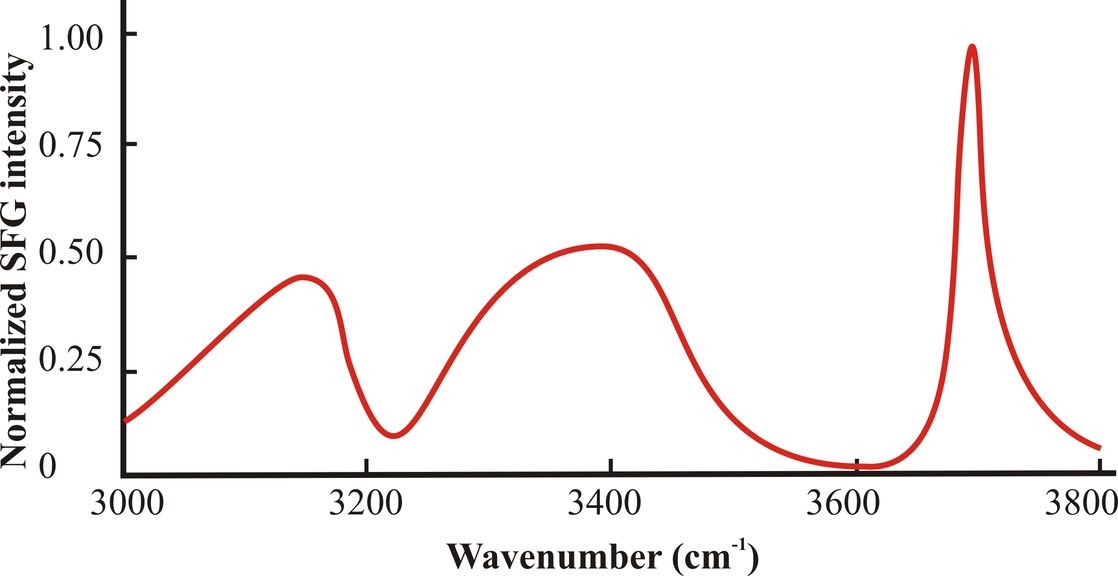
Figure 3: The surface spectrum for pure water O-H stretch vibrations consists of three main peaks centered at about 3150 cm-1, 3400 cm-1 and 3700 cm-1. The spectrum shown is a cartoon of those typically found and has been smoothed and simplified from that of Shultz et al. (2000).
SFG and SHG thus present powerful methodology for investigating the interface. Disappointingly, the data accompanying an increase in bulk concentration of an ion may be open to opposing interpretations and does not provide definitive conclusions. Current methods do not distinguish as to whether a spectroscopic change at the surface is due to the presence of the ion at the surface or due to an effect that the ion has from a distance from the surface, such as a field potential effect from within the double layer. Thus, the fact that acids interfere with the surface structure of water can be taken as support for the hydronium ions preferring the surface. Alternatively, opposing views can be taken whereby the surface effect is due to charging at the double layer and/or the presence of unionized acid at the surface. Unambiguous experimental proof that oxonium ions (e.g. H 3O+) are in excess at the surface is missing. Some researchers link the spectroscopy with molecular dynamics (discussed later) in such a way that the strictly spectroscopic conclusions are overshadowed and possibly biased.
Fig. 3 shows a typical surface spectrum of the O-H stretch vibrations of pure water. By general consensus, these O-H resonances are believed to mostly represent symmetric stretch of anisotropically oriented tetrahedrally hydrogen bonded water molecules (~3150 cm -1, ‘ice-like’), asymmetrically hydrogen bonded water molecules (~3400 cm-1, ‘liquid-like’) and the dangling O-H stretch, free from hydrogen bonding (~3700 cm-1, ‘gas-like’). The assignation of these peaks is probably correct but not assured as Sovago et al (2008a, 2008b, 2009) disagree with these assignments with Tian and Shen (2008, 2009) dissenting from this view. Certainly, the model used by Sovago et al (2008a, 2009), which assumes that liquid HOD behaves no differently from H2O in its hydrogen bonding, is open to question. The dangling O-H stretch may be further explained by making use of the infrared spectra of oxonium ion clusters (Shin et al. 2004). The vibration from the single free O-H in a water molecule held by two or three hydrogen bonds were at ~ 3717 cm-1 and ~3695 cm-1 respectively, whereas the symmetric and asymmetric stretch of the pair of O-H bonds from single water molecules held by donated hydrogen bonds were found at ~3650 cm-1 and 3740 cm-1 respectively. These resonances qualitatively agree with the O-H stretch from gaseous HDO (3707 cm-1), where the O-H stretch is similarly decoupled and the peaks at 3657 cm-1 or 3756 cm-1 from the symmetric and asymmetric stretch vibrations from pairs of free O-H groups in H2O vapor. Thus, similarly sized peaks at ~3650 cm-1 and 3750 cm-1 would represent water molecules held in the surface only by accepted hydrogen bonds from underlying water molecules. Such peaks cannot be seen to any significant extent in water’s surface SFG spectra.
The peak at ~3700 cm -1 shows that about a quarter of the water molecules in the surface each have a ‘dangling’ O-H group (Wilson et al. 2002, Du et al. 1993) pointing at a slight angle out of the water (Kuo and Mundy, 2004; Gan et al. 2006) and creating a slight negative charge on the outer liquid surface. These amounts of dangling O-H groups are identical to those found in the basal plane of ice. In addition, Du et al. (1993) says the dangling O-H angle averages at about 52° to the surface plane, placing its molecular dipole almost exactly parallel to the surface. Using the value of 106° for the bond angle of the water molecule, a randomly oriented water molecule in the outer monolayer would be expected to possess at least one free O-H group 79% of the time (= (180+106)/360) and have both O-H groups free 21% of the time (= (180-106)/360). As the proportion of free O-H vibrations indicates amounts of such water molecules substantially lower than this, it appears that the surface monolayer of water molecules is part of substantially ordered arrangement and the water dipole must probably point towards the bulk liquid, giving a negatively charged surface. Random orientation of these water molecules fitted to this data, less the ~25% that are dipole-neutral, would give them a net dipole of about 40% of the H2O molecular dipole. Goh et al. (1988) also concluded, from the temperature dependence of the SHG, that water molecules are oriented with their dipole moments pointed, on average, into the bulk at the air-water interface. The water molecules hydrogen-bonded to these, lying just under the surface but within the surface monolayer, would tend to reduce this surface polarity. As the water molecule is neutral, any net charge effect can only be carried to the bulk by means of oriented hydrogen bonding and would be much reduced due to thermal randomization.
The free O-H stretch is a good indicator for surface perturbation whereas the symmetric stretch at ~3150 cm -1 indicates a preferred orientation of the tetrahedrally hydrogen bonded water molecules in the immediate sublayer. Clearly, a surface dipole creates ordering in the sublayer extending until the effect peters out. These experimental findings are in contrast to molecular dynamics simulation results on pure H2O that show exterior water dipoles pointing out but with a stronger dipole pointing in due to water molecules deeper in the surface (Sokham and Tildesley, 1997).
Of key importance is the effect of acid, anions and cations on the surface. Even ions that do not reside in the surface, such as strongly hydrated metal cations, perturb the surface layer by their charge effect on the subsurface. Acids generally appear to have a greater effect than salts. However, it is not clear whether this greater effect is due to the presence of surface hydrogen ions or unionized (charge neutral) surface acid molecules. Noticeable effects are the reduction in the free O-H peak due to its replacement in the surface or re-orientation of the surface water molecules, and the increased intensity of the anisotropically oriented tetrahedrally hydrogen bonded water molecules (~3150 cm -1).
Direct recording of the spectra from oxonium ions (e.g. H 3O+) is unlikely due to their much lower concentration and the strength of their donor hydrogen bonding red-shifting the expected O-H vibrations. No such red-shifted vibrations have been seen (Baldelli et al.1998). At a pH of 1 (or 13), the surface would only involve one oxonium ion (or hydroxyl ion) for every 550 surface water molecules, and they are therefore unlikely to contribute much directly to the spectrum. There is some support for oxonium ions lying in the surface of concentrated solutions, but not within the top monolayer, from Tarbuck et al. (2006). They show that the O-H stretching modes are affected by both OH– and H+ ions, albeit more substantially by the latter. Water hydrogen bonded to hydroxide ions would behave similarly to those hydrogen bonded to oxonium ions. However, the resonances of ‘free’ O-H groups, if present, from any surface hydroxide ions would be expected to overlap with those of the dangling O-H groups from H2O molecules.
Mucha et al. (2005) used SFG to probe the O-H stretch vibrations parallel and perpendicular to the surface but found the signal too weak except when concentrated acid or hydroxide was used. 1.2 M acid solutions gave strong increases in the tetrahedral hydrogen bonded O-H stretch (~3150 cm -1) with a smaller changes in the 3450 cm-1 peak and decreases in free O-H stretch (~3700 cm-1), indicating the presence of surface hydronium ions to the authors. The spectra indicate a greater effect caused by HI than HCl, due probably to the highly polarizable and known surface-active iodide ion dragging hydrogen ions into the surface with them. No such effects were found for hydroxide ions, but these appear to give a slightly higher free O-H stretch (~3700 cm-1) that is difficult to distinguish from that of water. However, similar spectra to the above acid spectra have been obtained using neutral salts, such as sodium sulfate, which are known to be absent from the interfacial layer (Gopalakrishnan et al. 2006). Also, sulfuric acid, which is also known not to enter the surface from its affect on surface tension, shows a much enhanced SFG peak at ~3150 cm-1 and reduced SFG peak at ~3700 cm-1 (Gopalakrishnan et al. 2006) and must be achieving this through a double layer effect reorienting the surface water molecules. Isotope dilution experiments, involving the four sodium halides F–, Cl–, Br– and I–, have shown these to only minimally perturb the surface SFG spectra in contrast to that expected from simulations (Raymond and Richmond, 2004). However Bian et al. (2008) show, using non- resonant SHG, that the greater surface presence of the heavier halides increases the thickness of the interfacial water layer but that the electric double layer is much weaker than produced in simulations.
Tian, et al. (2008) also interpret their SFG spectroscopy data as due to hydroxonium ions residing at the surface. Surprisingly, they find that acid solutes do not affect the free O-H vibrations. However, as surface oxonium ions strongly hydrogen bond to other water molecules, so reducing the further acceptor character of such water molecules, they would be expected to affect the ~3400 cm -1 resonances more than the ~3150 cm-1 resonances, which is not seen.
The differences are also discussed by Petersen and Saykally (2008) using resonant UV SHG. This method uses two identical photons directed at the surface and analyzes the emitted photons having double the energy. When the energy of molecular transitions coincides with either incident or emitted photons, resonance enhancement of the second order signal gives rise to the surface spectrum. Several anions exhibit strong charge-transfer-to-solvent (CTTS) transitions that were thought best modeled by surface depletion of hydroxide ions but with surface enhancement of oxonium ions associated with ions such as iodide. The presence of surface hydroxide was dismissed as having no theoretical base.
Levering et al. (2007) also examine the air-liquid interface of aqueous hydrogen-halide solutions using vibrational SFG spectroscopy. These acids caused a significant disruption in the hydrogen-bonding network at the interface, including an increase in interfacial depth and a decrease in the number of dangling O-H bonds. Levering et al. (2007) interpreted the increased resonance at frequencies below 3000 cm -1 to indicate that hydrogen ions exist at the air-aqueous interface, but it is unclear whether this requires an enhancement or is simply a consequence of the high acid concentrations (0.05 mole fraction). They also found a peak at 3748 cm-1 that increases in acid solutions. This is equivalent to the asymmetric stretch of water molecules with two free O-H groups but they did not find the expected ‘twin’ peak at ~3650 cm-1 for the symmetric stretch. Indeed, there was only a slight change in the ~3200 cm-1 peak on increasing the acids from mole fractions of 0.015 to 0.1. This peak increases or decreases slightly dependent on the acid and, therefore, this would seem more simply resulting from forcing the molecules closer to the surface due to the concentration increase rather than a surface excess due to proposed specific surface activity of the hydroxonium ions.
Surface Tension and Related Thermodynamics
In a liquid, molecules within the bulk phase attract each other equally in all directions. However, at a gas-liquid interface, the surface molecules are more attracted to the molecules within the liquid than they are to molecules of the gas, so creating the surface tension. In order to achieve the greatest possible interaction energy, surface tension causes the maximum number of surface molecules to enter the bulk of the liquid and, hence, minimizes the surface area.
Water has an unusually high surface tension with a tightly packed surface. Water molecules at the liquid-gas surface have lost potential hydrogen bonds directed at the gas phase and are pulled towards the underlying bulk liquid water by the remaining stronger hydrogen bonds (Scatena et al. 2001). Energy is required to increase the surface area, by removing a molecule from isotropically hydrogen bonded interior bulk water to the anisotropically hydrogen bonded outer surface. This energy is minimized and the surface is held under tension. As the forces between the water molecules are several and relatively large on a per-mass basis, compared to those between most other molecules, and the water molecules are very small, the surface tension is large. Lowering the temperature greatly increases the hydrogen bonding in the bulk causing increased surface tension.
Surface tension measurements do not give direct information about the aqueous molecular structure of the surface, but unambiguously report the presence of other molecules within the surface layer. Unfortunately, liquid surfaces are easily contaminated and such experiments are prone to error. This not only means that they are difficult to carry out reproducibly and without artifacts but also allows critics to denigrate results they disagree with.
Gas at air-water and other gas-water interfaces behaves like a flattish flexible hydrophobic surface but with the difference that the van der Waals interactions between the liquid and gas are negligible and with the caveat that gas molecules can bind to the surface. It is well known that gas adsorbs preferentially at the water gas interface (Vácha et al. 2004), as proven by the lowering of surface tension with gas pressure (Massoudi and King, 1974). Such adsorption must affect the structure and properties of the surface. In the presence of methane gas, for example, its concentration within the surface layer may be almost a hundred times greater than that in the bulk liquid (Sachs and Meyn, 1995). Similarly, the surface excess of CO 2 may be ten times greater than its bulk concentration (Massoudi and King, 1974).
The aqueous surface is strongly attracted to probes approaching from the gas side at distances of about a micrometer and jumping into contact when still over 100 nm distant (Wu et al. 2007), thus showing the long range nature of the attractive forces and the likeliness an uneven surface. Atomic force microscopy at air-water interfaces has indicated that the surface polarization causes the presence of nano-sized clusters of water within about 250 nm of the interface (Teschke and de Souza, 2005). These clusters are apparently built up from ~100 H 2O molecule clusters; the same size that forms the core clusters in the icosahedral model of water (Chaplin, 2000) and as found by X-ray analysis in Mo-based nanodrops (Müller et al. 2003). Teschke and de Souza (2005) describe the surface as oscillating between greater and lesser organization with sharp boundaries between them. The reduced density and stronger hydrogen bonds within the surface will both contribute to the stabilization of expanded water clusters. Small gas molecules may bind preferably to such surface clusters due to multiple van der Waals interactions, and good fit, between the gas molecules and the clusters without the possibly negative influence caused by the necessary closure of the clusters as must occur within the bulk. This is supported by the known greater solubility of the hydrophobic gasses at the interface. Also, there remains the possibility that the surface forms a different aqueous phase that extends far from the gas interface (Zheng et al. 2006).
Hydrogen bonding in the surface is stronger than in the bulk (Gan et al. 2006) but some hydrogen bonds are lost, giving a more reactive environment at the surface (Kuo and Mundy, 2004) and greater ice nucleation just under the surface (Shaw et al. 2005). The increased strength of water’s hydrogen bonds in the surface is partially due to the reduced competition from neighboring water molecules and partially due to improved cooperativity and lower anticooperativity. Nevertheless, it has little effect on their vibrational lifetime (Smits et al. 2007). This stronger bonding compensates for the increased chemical potential on the loss of some bonds. The diffusion within the surface is increased for some molecules (in the surface) but decreased for others and depends on the number of hydrogen bonds and size of the water clusters (Liu et al. 2005). The refractive index of the surface of water at 22°C has been shown to be higher than that of the bulk and opposite in behavior to other normal and hydrogen-bonding liquids, ethanol for example (Greef and Frey, 2008). Thus, the refractive index reveals the surface of water to be about 1.7 nm thick at 22°C and that it appears to behave like water at a lower temperature. This indicates higher density or greater hydrogen bond strength, at equal density. We know that more structured water has higher specific refraction and refractive index for its density (Cho et al. 2001) but the effect of density changes on the refractive index may outweigh that of the specific refraction differences due to water structuring, as well-structured hexagonal ice has a density of 91.7% of water but a refractive index of just 98.2%. Zasetsky et al. (2007) used molecular dynamics with a SPC/E based model and found enhanced local order at the liquid-gas interface at low temperatures.
The interactions of ions with the interface have been reviewed (Jungwirth and Tobias, 2006). As the surface has low dielectric, ions will not generally be preferred there compared with the high dielectric bulk. However, chaotropic ions with low surface charge density and/or high polarizability (such as Cl –, Br–, I–, HO2– and O2·–) will favor the gas-liquid interfaces (Garrett, 2004; Jungwirth and Winter, 2008) as they only interact weakly with water but are influenced favorably by the highly polarized surface. Aqueous radicals also prefer to reside at such interfaces (Roeselová al, 2004), as do some molecular species that prefer to hydrogen bond on the outside of clathrate-like structures, like superoxide (Shi et al. 2003). Small cations are found away from the interface towards the bulk where their requirement for efficient hydration may be satisfied. Such cations may only approach the interface in response to a surface negative charge. Oxonium ions are an exception to this as they certainly have a much stronger preference for the surface than other small cations (Mucha et al. 2005). Brown et al. (2008) used X-ray photoemission spectroscopy to probe the ion distribution of concentrated KF, comparing it with that of concentrated KBr and KI, to show that fluoride ions stay away from the surface whereas the bromide and iodide ions are more concentrated at the surface, relative to their cation counterions.
It might be expected that much can be discovered concerning the surface of water from consideration of thermodynamics. This may well be true but thermodynamics produces some inconsistent results that require interpretation. At the liquid-gas surface the following thermodynamic relationship holds:
[1] dG = -SdT + VdP + γdA + ∑ ιµιdnι
where G, S, T, V, P, γ, A, μ and n i are the thermodynamic quantities Gibbs (free) energy, entropy, temperature, volume, pressure, surface tension, surface area, chemical potential and number of moles of substance i, respectively, as referring to the whole system (Vavruch, 1995a), From the properties of the differential, the definition of the surface tension may be derived
[2] (∂G/∂A) TPn = γ
As can,
[3] (∂V/∂A) TPn = (∂γ/∂P)TAn
(Vavruch, 1995a; Rice, 1947), which relates the change in surface tension with pressure (∂γ/∂P) TAn to the change in volume associated with forming surface (∂V/∂A)TPn. The influence of pressure on the surface tension of water, as with other liquids, is not straightforward. There are two clear effects, the thermodynamic effect described here and the effect of specific binding described earlier. (∂A/∂V)TPn, the inverse of (∂V/∂A)TPn, may be taken as a measure of the difference in density of the liquid in the bulk compared with that at its surface and is therefore generally positive; that is, the surface tension should increase with pressure about +0.7 mJ m-2 MPa-1 for water at 25°C. (∂γ/∂P)TAn is generally much higher than for other liquids at 0.696 nm (25°C); for example, methanol (0.159 nm), diethyl ether (0.176 nm), benzene (0.178 nm) and even mercury (0.398 nm) (Vavruch, 1995b). This high value for water indicates that the density at the surface of water is more similar to the bulk liquid than occurs in most other liquids.
Also derived from equation 1 are
[4] (∂S/∂A) TPn = -(∂γ/∂T)PAn
where (∂S/∂A) TPn is the surface entropy and
[5] (∂S/∂V) TAn = (∂P/∂T)VAn (Pitzer, 1995).
From these relationships, an equation for the surface enthalpy (∂H/∂A) TPn may be derived,
[6] (∂H/∂A) TPn = γ – T(∂γ/∂T)PAn (Pitzer, 1995).
From inspection of the surface tension changes with temperature, it is clear that this term (the surface enthalpy) is always positive. The greater than expected drop in surface tension with temperature increase (0.155 mJ m -2 K-1 at 25°C) is one of the highest known and similar to that of the liquid metals. It has been quantitatively explained using spherically symmetrical water clustering (Khan et al. 2001).
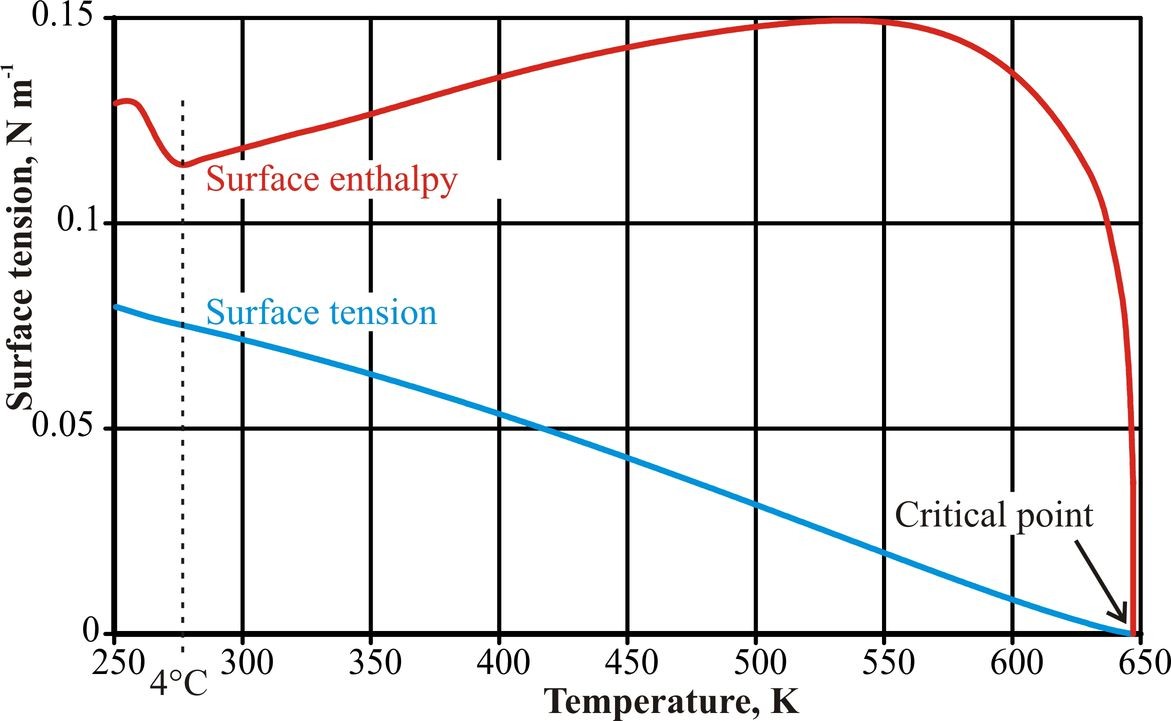
Figure 4: The surface enthalpy/temperature curve was calculated from a combination of sixth power fits to four ranges of surface tension data, (Hacker, 1951; IAPWS, 1994). Due to noise in the data and the lack of data below 250 K, the form of the curve at very low temperatures is error-prone.
Although there is no clear anomaly in the surface tension/temperature behavior (Fig. 4), there are inflection points at about 4°C (Hacker, 1951) and 262°C (Pellicer et al. 2002). The inflection in the data at low temperatures has been explained by use of a two-state mixture model involving low-density and higher density water clusters (Hrubý and Holten, 2004). The surface enthalpy/ temperature behavior is anomalous, however, with a clear minimum at the temperature of maximum density. This is a consequence of the minimum in the surface entropy/ temperature behavior. Surface tension changes differently from bulk water properties due to surface enrichment with water clusters. These appear to be optimal at +4°C, collapsing somewhat at both higher and lower temperatures,
Surface enthalpy, also known as the total surface energy, may be calculated from the binding energy lost per unit surface area (= molecules per surface area times the binding energy lost per molecule). At 4°C, this is equivalent to a surface half occupied with water molecules that have lost no hydrogen bonds with the other half having lost the equivalent of about 30% of their hydrogen bonds. A freshly exposed surface of water, with many more broken hydrogen bonds, would be expected to have much higher surface energy (~180 mJ m -2; Ogawa and Matsuura, 2004) with a relaxation to the experimental value (117.9 mJ m-2, 25°C) taking place in about 3 ms (Kochurova and Rusanov, 1981).
The internal (cohesive) pressure ∏ ι is the work required to increase the volume at constant temperature, external pressure and solute concentrations, having the same units as pressure,
[7] (∂U/∂V) TPn = Πι (Leyendekker, 1983; Vavruch, 1995a).
As H = U + PV,
[8] (∂H/∂A) TPn = (∂U/∂A)TPn + P(∂V/∂A)TPn
and also,
[9] (∂U/∂A) TPn = (∂U/∂V)TPn * (∂V/∂A)TPn
therefore
[10] (∂H/∂A) TPn = (Πι + P) * (∂V/∂A)TPn (Vavruch, 1995a).
As dU = TdS – PdV,
[11] (∂U/∂V) TAn = T(∂S/∂V)TAn – P = Πι
therefore
[12] (∂U/∂V) TAn = T(∂P/∂T)VAn – P = Πι
and as
[13] (∂P/∂T) VAn = -(∂P/∂V)TAn * (∂V/∂T)PAn = α/κT
the internal pressure may be calculated from
[14] (Π i + P) = T(α/κT)
where α is the coefficient of thermal expansion and κ T is the coefficient of isothermal compressibility (Leyendekker, 1983). As T(α/κT) is zero at 3.984°C, so is (∏ι + P) and both are negative below this temperature, as must be (∂A/∂V)TPn. ∏ι is zero at 3.99°C when cohesive and repulsive components of the hydrogen bonding are equal. It follows that the densities of surface and bulk water are equal at 3.984°C as, below this temperature, the surface density increases relative to the bulk density, rather like what happens at the surface of hexagonal ice (Henson et al. 2005). Both above and below this temperature the density of the surface of water appears to change less than the changes in the bulk water density.
It follows that
[15] (∂A/∂V) TPn = (Πι + P) / {literal}{γ – T(∂γ/∂T)PAn}
(Vavruch, 1995a). At constant temperature and pressure, this equation can be written
[16] (Π ι + P)dV = {γ – T(∂γ/∂T)PAn}{/literal}dA
where the left hand side represents the volume work done against the intermolecular forces in bringing molecules from the bulk liquid to the surface and the right hand side represents the energy cost of the extension to the surface (Vavruch, 1995a). Clearly, the work required at 3.984°C is zero (from Eq. 14), which gives rise to an inconsistency, as the right hand side of Eq. 16 is not zero. It may be that the structure of the surface of water is behaving as a different phase and so showing a change in the composition (n). The zero work does however confirm that the surface has the same density to the bulk at this temperature. At lower temperatures, the work is positive again as the bulk density drops with temperature and the thermodynamic expression changes, as here the thermodynamic work equals -pΔV (Stepanov, 2008).
The thermodynamic relationships do not hold for real liquid-vapor-gas systems, however, where the application of pressure will cause water vapor to condense and gas molecules to adsorb on to the liquid-gas interface. The adsorption of gas molecules to the surface of liquid water lowers the surface tension by a greater extent than the thermodynamic effect, outlined above (Eq. 3), raises it except perhaps for helium. Thus, the surface tension of water, in contact with other molecules in the gas phase, drops with increase in pressure due to the surface activity of surface-absorbed gas molecules (Rice, 1947; Massoudi and King, 1974). The extent of this lowering depends upon the gas involved and is much greater for hydrophilic gasses, such as CO 2 (-7.7 mJ m-2 MPa-1), than nonpolar gasses such as N2 and O2 (-0.8 mJ m-2 MPa-1). This effect of pressure does not manifest itself in the modeling simulations.
Changes in the surface tension of water with solute concentration indicate solute presence or absence within the surface layer. Increase in surface tension with salt concentration indicates that ions are depleted in the surface layer as given by the Gibbs adsorption equation.
[17] dγ = -ΣιΓιdµ ι
where Γ ι is the surface excess of solute component i and μι is its chemical potential . Thus, strong hydration of ions in the bulk liquid leads to increases in the surface tension as they are depleted within surface layer. Some acid and basic solutions show the opposite effect. Also, some salts show a reduction in surface tension at low concentrations, followed by an increase at higher concentrations; the Jones-Ray effect (Petersen et al. 2004b; Petersen and Saykally, 2005). Petersen et al. (2004b) showed that iodide saturates at surface at about 1 mM in agreement but this experimental Jones Ray effect has not yet been found in simulations. The Jones-Ray effect is explained by envisaging a limited number of binding sites at the expanded and weakly hydrogen bonded surface, increasing both the interfacial concentration directly and by counterion attraction. Certainly, chaotropic ions prefer this surface environment to the bulk phase where they disrupt the natural water structuring without forming the strong compensatory interactions of kosmotropic ions.
The increase in surface tension with higher concentrations of kosmotropic salts is due to the relative depletion of salt within the surface, which means that when ions do absorb at the surface a depletion layer must be created deeper in. Also, higher concentrations of such salts disproportionately increase the bulk salt concentration so supplementing the attractive forces on the surface water molecules, consequently adding to the increase in the surface tension. Kosmotropic cations and anions prefer to be fully hydrated in the bulk liquid water and so increase the surface tension by the latter mechanism at all concentrations. This partitioning is noticeable in NaCl solutions, such as seawater; the weakly chaotropic chloride ion occupying surface sites whereas the weakly kosmotropic sodium ion only resides deeper within the bulk water (Knipping et al. 2000). The polarizability of large chaotropic anions (such as iodide) is accentuated due to the asymmetric solvent distribution at the surface and increases the strength of chaotrope-solvent interactions when at the surface (Archontis and Leontidis, 2006). Thus, the main driving forces for the entry of such ions into the anisotropic environment of the interface are the stabilizing polarization interactions. Similarly to chaotropic ions, hydroxyl radicals also prefer to reside at air-water interfaces (Roeselová et al. 2004); the radicals donating one hydrogen bond but accepting less than two (VandeVondele and Sprik, 2005).
As some acid solutions (e.g. HCl, HNO 3 and HClO4) have reduced surface tension, this has generally been given as supporting water having an acidic surface. For example, arguments for hydrogen ions being surface active often involve the fact that the surface tensions of HCl solutions go down with increased concentration whereas those of NaCl goes up. However, the anion is also important, as the same effect is not shown by H2SO4 or H3PO4 under similar conditions, where the surface tension increases with concentration even at low concentrations. The claims for it falling at very high concentrations (Mucha et al. 2005), due to the surface-active nature of less-ionized sulfuric acid, are weak as the surface tension only falls below that of water when the solution changes from one of H2SO4 in water to one of water in H2SO4. As the surface tension of pure H2SO4 is substantially lower than that of water, this phenomenon is best considered as the water content raising sulfuric acid’s surface tension due to relatively more water being in the surface layer of H2SO4, with water acting as the surface-active species. Overall, this argument for surface-active oxonium ions is probably fallacious. Moreover, a similar case could be made for OH–
The reduction in surface tension that occurs with some acids and bases may be due to the surface-active nature of their uncharged acid or base forms. Certainly, this allows an easier and more consistent explanation of surface activity by the formation of uncharged species (for example, HCl, NH 3) at the surface. Ammonia appears to behave quite differently at the water-gas interface than the isoelectronic oxonium ion (Simonelli et al. 1998; Gopalakrishnan et al. 2006), due to its weaker donor hydrogen bonding and stronger acceptor hydrogen bonding. The NH3 molecule orients with free N-H upwards away from the liquid. Certainly some of these acids and NH4OH may be smelt (but this should be avoided) from concentrated aqueous solutions showing their volatile nature. Even very strong acids such as nitric acid and perchloric acid may act differently at the low dielectric interfaces (Shamay et al. 2007; Karelin and Tarasenko, 2003). The drop in surface tension of sulfuric acid in low to moderate concentrations at low (< 18°C) to very low temperatures (Myhre et al. 1998) is unusual and needs some explanation. Clearly, a different phenomenon is acting at higher temperatures (> 18°C) where the surface tension always increases with concentration. It is probably due to the preferred presence of the highly polarizable and chaotropic bisulfate ion in the more organized surface layer apparent at low temperatures, as argued under different circumstances by Mucha et al. (2005).
Higher concentrations (often about 0.1M) of many, but not all, salts prevent the coalescence of small gas bubbles, as recently reviewed by Craig (2004), in contrast to the expectation from the raised surface tension and reduced surface charge double layer effects in the DLVO theory. Higher critical concentrations are required for smaller bubble size (Tsang et al. 2004). This is the reason behind the foam found on the seas (salt water) but not on lakes (fresh water). The salts do not directly follow the Hofmeister effects with both the anion and cation being important with one preferentially lying closer to the interface than the other does; for example, excess hydroxonium ions tend to negate the effect of halides (Craig et al. 1993). One explanation for this unexpected phenomenon is that bubble coalescence entails a reduction in the net gas-liquid surface, which otherwise acts as a sufficiently more favorable environment for the pair of ions rather than the bulk when their concentration is higher than a critical value. It has been proposed that anions and cations may be divided into two groups α and β with α cations (Na +, K+, Mg2+) and β anions (ClO4–, CH3CO2–, SCN–) avoiding the surface and α anions (OH–, Cl–, SO42-) and β cations (H+, (CH3)4N+) attracted to the interface; αα and ββ anion-cation pairs then cause inhibition of bubble coalescence whereas αβ and βα pairs do not (Henry et al. 2007). These groupings do not behave as bulk-phase ionic kosmotropes and chaotropes, which indicates the different properties for bulk water and the gas-liquid surface. It is likely that the ions reside in the interfacial region, between the exterior surface layer and interior bulk water molecules, where the hydrogen bonding is naturally most disrupted (Paul and Chandra, 2004). A similar phenomenon is the bubble (cavity) attachment to microscopic salt particles used in microflotation, where chaotropic anions encourage bubble formation (Nickolov and Miller, 2005). Further explanation for coalescence involves the effect of the ions on raising or lowering gas solubility (Weissenborn and Pugh, 1996) and this explanation may be extended to water-gas surfaces, as if some ions increase the solution of gasses at the interface, they will reduce the surface tension by this effect alone.
It has been proposed that the lesser hydration energy of OH – (ΔG° hydration = -437.6 kJ mol-1, Camaioni and Schwerdtfeger, 2005), relative to H3O+ (ΔG° hydration = -461.1 kJ mol-1, Camaioni and Schwerdtfeger, 2005), results in hydroxide ions, rather than the hydroxonium ions, preferring the surface (Boström et al. 2005). This phenomena, even if correct, cannot be the whole story as ions with lower hydration energies do not seem to readily replace hydroxide ions at the interface (Beattie, 2007).
Simulations
Due to memory and computational restraints, simulations involving H + and OH– ions effectively concern concentrated acidic or basic solutions but with few interacting ions. It is technically impossible to simulate pH 7 water or even acidic water above the proposed isoelectric point (~pH 3-3.5) and so all simulation results have lower pH and, as such, their results would be expected to depend but weakly on the acid concentration. Rarely do simulations involve or allow either the ionization of water molecules or the recombination of the ions. Additionally, the methods used have not been shown to be good predictors of the known physical chemistry of bulk liquid water. Particularly misleading may be methods based on the results for small clusters as it is known that the stability of such clusters is due to maximizing the number of hydrogen bonds and van der Waals interactions and minimizing putative links out from the cluster. Water clusters within bulk liquid water, however, are strongly influenced by the surrounding water molecules and similar effects (if anisotropic) are expected at interfaces. Overall, the results of such simulations should not be interpreted recklessly but with a caution that is not always apparent.
Simulations generally show lower structuring in water than reality. They may use models that give a much lower melting point for water, consequent upon their formation of less structured liquid water and hence a higher entropy change on freezing (DS), or even the wrong structure for the ice formed. It is surprising how much trust has been placed on the results of water surface simulations, when the errors encountered using current models in predicting the properties of bulk water are considered. Simulations of hydrogen ions within the surface present problems due to the high effective concentration necessarily involved and the thinness of the surface examined; both factors necessitated by the need to avoid excessive calculation time. Also, the diffusion of these ions is often dealt with in a way that is not realistic. Both ions translate preferentially through the Grotthuss mechanism when affected by electric fields and such fields are very important at interfaces. However, within many simulations they move around by conventional diffusion, which should strongly depend on what ions are used, e.g. H 3O+, H5O2+, H9O4+, OH– , H7O4–, etc. Also, image charges would place and hold a surface hydrogen ion equidistant between the two equal attractors of the hydroxide ion and its image charge. The greater mobility of hydrogen ions would ensure that it would respond to the field first and preferentially seek out the surface.
Ab initio studies are particularly limited by high computational cost and cannot include more than a very few molecules. Although early Monte Carlo studies on isolated clusters indicated that the hydroxonium ion prefers the interior of the clusters (Svanberg and Pettersson, 1998), later studies, including density functional analysis, suggest that they prefer the exterior of the cluster (Buch et al. 2007; Vácha et al. 2007). Note however that such clusters contain mainly surface molecules, are charged particles and not neutral and are acidic with a pH equivalent to less than zero; with hydrogen ion concentration at least three orders of magnitude higher than those present at the lowest isoelectric points proposed. The preference of hydrogen ions for the surface of small clusters seems mainly due to their inability to form isotropic hydrogen bonding links (see later). Buch et al. (2007) also used slab simulations with empirical potentials based on their, possibly biased and misleading, results for small clusters. They claimed that the 3 kcal mol-1 stabilization of the proton at the surface, that they found, is equivalent to 150-fold increase in H+ at the surface compared with the bulk and claimed a surface pH of about 4.8, with lower bound of about 1.9. Similar calculation for hydroxide showed a weak (~1-2 kcal) preference for the bulk giving a pOH in the range 7.7-8.4 at the surface. Clearly, a combination of these values would give a pKw of about 12-13 or lower rather than the bulk pKw of 14. However, this calculation takes no notice of the restricted sites available within the model for surface H+ or the depth of the surface layer. Also, repeats of this simulation were reported to more often than not produce recombined water molecules and only certain unlikely high-energy initial configurations allowed the simulation to proceed (Buch et al. 2007).
The structuring of the interface at simulated solid hydrophobic walls derives, to some extent, from the prevention of the surface waves that otherwise tend to destructure time-averaged liquid-gas interfaces. Additionally, the van der Waals attraction for the surface increases the interface density, when compared to the liquid-gas interface. Kudin and Car (2008) used ab initio– and H+ are surface active with OH–(H2O)45O2+(H2O)4 sitting on surface with the lone pair on one, but not the other, of the O-atoms (Fig. 7b) pointing away from the bulk water. The hydrophobic surface attracts the hydroxide ions apparently in contrast to the situation supposed at the water-air hydrophobic surface. Also, the hydrogen ion delocalizes from the surface more readily due to the Grotthuss shuttle
(Fig. 8b) sitting on the surface with its O-H pointing away from the bulk water and H
Vácha et al. (2008c) investigated the behavior of hydronium and hydroxide at water/hydrophobic medium and water-vapor interfaces using molecular dynamics simulations. The rigid wall interface strongly structures water and weakly adsorbs hydroxide ions. In pure water, their calculations show surface enhancement of hydronium but not hydroxide, by one or two orders of magnitude. Vácha et al. (2008b) later state that the mechanism for the adsorption of hydroxide ions next to hard attractive walls may not be applicable to the water-air interface. The reasoning behind this conclusion is not clear however.
The charge on the surface of just theoretical water (H 2O, modeled without dissociation), gives a change in the charge across the surface dependent on the depth of the surface examined (Vrbka and Jungwirth, 2006). Thus overall it is negative (relative to a positive bulk) but where the very outer layer of the interface (next to the gas) is more positive (Goh et al. 1988). They report the probability that this outer (gas-facing) positive contribution is due to the almost-free singly-linked water molecules compensating for the negative quadrupole and dipole contributions in the denser part of the surface layer (Kuz’min, 2000). This effect, however, is not seen in the surface spectroscopy, where such water molecules would be expected to be seen but their expected resonances are very low or absent. Mucha et al. (2005) shows that there is little preference of H+ over Cl– in the surface of HCl solutions, but that the hydroxonium ion is preferred more than the sodium ion in NaCl solutions. Perhaps, the hydroxonium ion can more easily exist all around surface chaotropic ions such as Br– in HBr whereas Na+ ions only sit on the bulk side in NaBr. Hydroxide ions are found on surface side of Na+ ions in NaOH. Petersen et al. (2004a) studied the hydrated proton at the water liquid-vapor interface using the multistate empirical valence bond (MS-EVB) methodology, which enables its migration via the Grotthuss shuttle mechanism. They found that the hydrated proton behaved as an amphiphile and displays a marked preference for water liquid-vapor interfaces. Their model included a chloride counterion but no hydroxide ions.
Autoionization and Dielectric
One of the unusual properties of water is its ability to self-ionize. Dissociation is a rare endothermic event normally followed by the ions recombining within a few femtoseconds. Separation of the ions is a rarer event, occurring only about twice a day for each molecule; that is, only once for every 10 16 times the hydrogen bond breaks. In these cases the localized hydrogen bonding arrangement breaks before allowing the separated ions to return (Geissler, 2001) and the pair of ions (H+, OH–) hydrate independently and translate away or exchange with other water molecules.
2 H 2O(aq) ↔ (H3O+ + OH–)(aq) ↔ H3O+(aq) + OH–(aq)
The ions stay separated for about 70 ms before finding a partner to recombine with, but as the extra proton exchanges on the same timescale as hydrogen bond breakage, the excess proton visits up to over a million molecules of water during its travels. The ions tend to recombine when separated by only one or two water molecules, but the greater strength and extent of hydrogen bonding that is found at lower temperatures facilitates this process.
In pure bulk liquid water, the concentrations of these ions are equal and about 10 -7 M, giving a pH of close to seven. There is no good reason to presuppose that the same will hold at the gas-liquid interface. Higher density within the surface causes the ionization to increase (Bandura and Lvova, 2006), but this can only have a very small effect by itself.

Figure 5: The H2O with ‘free’ dangling O-H (a1) held by two donor and one acceptor H2O at the surface is more easily ionized in response to surface charge fluctuations including image charge repulsion. The ionization is even more preferred if a further third water donates its hydrogen bond. Once ionized (b1) it is difficult for the hydroxide to move inwards by normal diffusion rather than by the Grotthuss mechanism.
Beattie (2007) puts forward the case for the autoionization of water increasing by about six orders of magnitude because of surface effects. Such a shift would result in [H+] = [OH–] = 10-4 M at the pure water surface. The reason for this large change is proposed to be due to a number of favorable phenomena. There is likely to be large potential drop across the interface of the order of about 109 V m-1 (Beattie, 2007), although the figure from Randles (1977) and Kathmann et al. (2008), although large, would be about an order of magnitude lower. Water molecules with ‘free’ dangling O-H groups pointing out and away from the interface are more easily ionized than those isotropically situated, as can be determined from the change in the charge distribution using ab initio simulations. This effect is more marked if the surface water molecule has accepted three hydrogen bonds plus donating one to the water molecule that accepts the proton on ionization (Fig. 5). Autoionization should, therefore, be different within the surface from in the bulk, promoted by these surface electric fields and the anisotropic surface but reduced by the lower dielectric.
Consider a surface with a fluctuating charge causing irregular potential gradients. Hydrogen ions will respond faster than hydroxide ions to such changeable electric fields. Also, movement of the hydrogen ion charge is less disruptive of a tetrahedral hydrogen bonding arrangement than hydroxide ion due to the latter’s need for tetra-hydrogen bond acceptance (Tuckerman et al. 2006). As the surface structuring of water involves stronger hydrogen bonding, this is likely to further accentuate the difference in response between the two ions. Thus, it seems most likely that hydrogen ions rather than hydroxyl ions will enter the bulk, via proton hopping, from any excess ionization at the surface, so leaving the surface more negative. Once connecting proton wires due to extensive hydrogen bonding are broken, hydrogen or hydroxyl ion charges leave the surface. They may only return through the much slower process of molecular diffusion until such hydrogen-bonded proton wires reconnect.
Image charge effects may also help the ionization, as a hydrogen ion once formed necessarily beneath the surface will be repelled away from the surface. Once displaced, such hydrogen ions are affected by their image charge and cannot so easily return. Also at the surface, the loss of water by evaporation would tend to break up hydrogen-bonded wires connecting the hydroxide with the hydrogen ion. A hydroxide that tends to leave the surface, on the vapor side, will be held to the surface by an attractive image charge. Also if the hydroxide is about to evaporate, the charge will be held at the surface while the hydroxide grabs a proton from below to evaporate leaving a resultant hydroxide ion to remain on the surface. This cannot occur with some ions but can for H +, Cl– and NH4+.
The high fields created within the interface increase such autolysis. Surface facing hydrogen-donating water molecules, lying close to the interface would also encourage, and be encouraged by, the ionization. These water molecules could hydrogen-bond to surface hydroxide to form HO –(H2O)4 and so encourage the interfacial hydroxide. Both the oxonium ions and hydroxide ions have highly anisotropic hydrogen bonding that should increase their surface activity and relatively discourage bulk hydration compared with other ions.
Beattie et al. (2009) reported that the concentration of hydroxide present in homogenised oil in water is much greater than in neutral water, proving that there is increased autolysis driven by the adsorption of hydroxide ions at the oil-water interface in emulsions formed in oil-water (1.1 mm diameter, with surface 1.1 x 10 6 cm2 L-1). Lützenkirchen et al. (2008) put forward a model for the charging of hydrophobic electrolyte surfaces based upon enhanced autolysis within the structured interfacial water, with a pKw of about 7 and hence an isoelectric point of about pH 3.5.
Beaglehole (1987) noted that surface heating caused a rapid change in the sign of the coefficient of ellipticity followed by a slower relaxation back, but only in the presence of dissolved gas. He attributed this to surface structural changes involving surface gas replenishment. An interesting effect of gas on ionization is shown by degassing experiments whereby degassing allows colloidal suspensions of oils to be more easily formed (Francis et al. 2006). Degassing also causes an increase in conductivity from 0.07 mS cm -1 at 25°C to about 1.2 mS cm-1w (Pashley et al. 2005). This is equivalent to a decrease in the pKw to 12.8. It would seem, however, that this effect may work against the greater ionization of water within the interface as this water will have greater gas content than the bulk water. However, the effect may be different at the surface where the bound gas molecules do not need to be isotropically surrounded by water molecules as they do in the bulk, with the greater energy cost so entailed.
Hydrogen and Hydroxide Ions
Buch et al. (2007) present a number of studies showing that the surface of neutral water is acidic. Their work has received a wide distribution but some counter-argument (Beattie, 2008). The rationale for this acidic behavior is easily understood. The hydroxonium ion only hydrogen bonds to three water molecules, which necessarily are placed to one side of the molecule. These preferentially hydrogen bond to the bulk of the liquid water whereas the non-hydrogen bonded lone-pair side points outwards into the gas phase and so interferes (disrupts) least with the normal hydrogen-bonding network found in liquid water. The anisotropic interaction of hydronium ions with the surrounding water molecules is in contrast to the isotropic behavior of other cations. Indeed, other small cations much prefer the bulk environment rather than the surface. This simple concept, which necessitates the hydronium ion being placed at the very outside of the liquid-gas interface, is backed by a number of studies. However, very similar arguments can be put forward to support the hydroxide ion also preferentially lying at the water-gas interface due to its equally anisotropic hydrogen bonding.
A preferred orientation of water molecules at the surface may cause a charged surface and help adsorb hydroxonium or hydroxide ions, dependent on the charge. Both OH – (Boström et al. 2005; Schechter et al. 1998) and H3O+ (Petersen et al. 2004a) can sit at gas-water interfaces, although clearly not at the same time due to their rapid recombination to form H2O within this lower dielectric interface. Both ions are ionic kosmotropes, creating order and forming stronger hydrogen bonds with surrounding water molecules. The hydrogen ion donates to three strong hydrogen bonds but is a very much weaker hydrogen bond acceptor than a water molecule whereas the hydroxide ion accepts three or four strong hydrogen bonds but is a very much weaker hydrogen bond donor than a water molecule. In both cases, if the number of interacting water molecules is reduced the remaining hydrogen bonds are stronger and more linear.
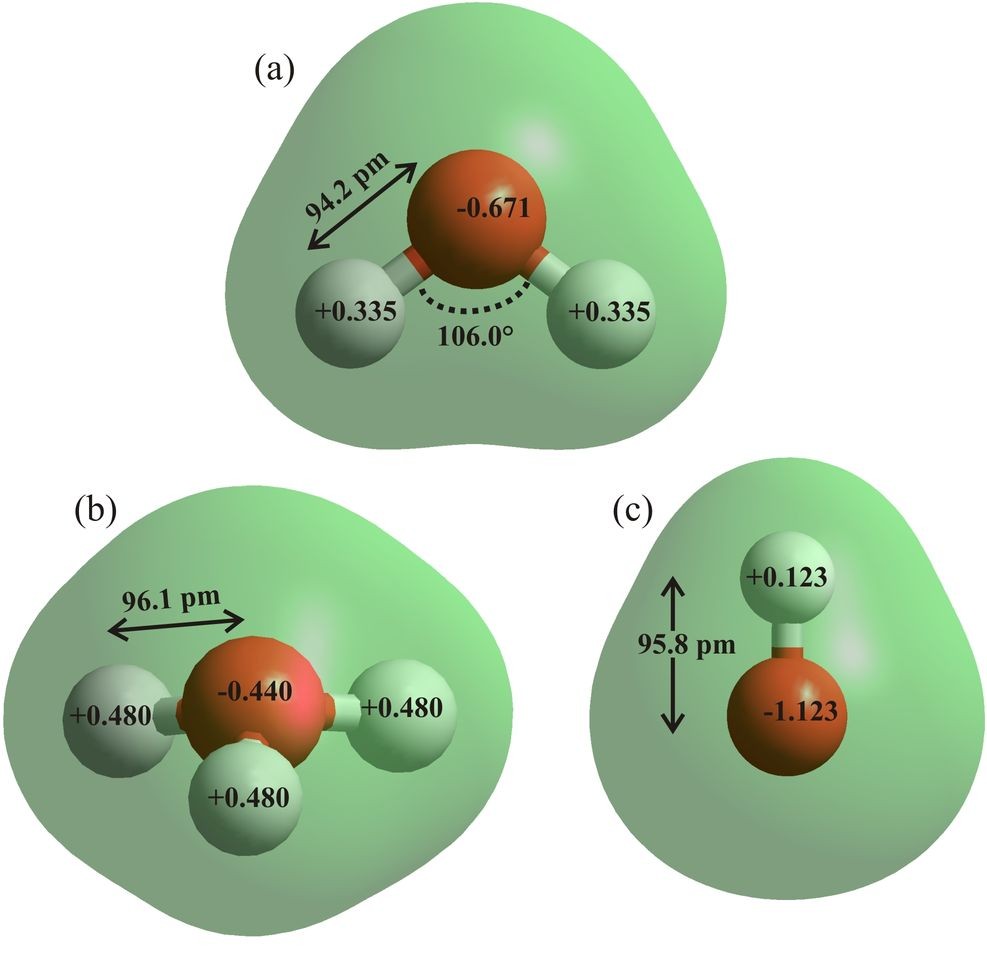
Figure 6: The water (a), hydroxonium ion (b) and hydroxide ion (c) are drawn using ab initio calculations using the 6-31G** basis set and HyperChem 8 Professional. Bond distances, angles and atomic charges are derived from these effectively gas phase calculations. On ionization, the charge on the oxygen atom in the hydroxonium ion is reduced by 34% and the charge on the hydrogen atom in the hydroxyl ion is reduced by 63%.
The oxonium ion (H3O+) has a flattened trigonal pyramidal structure (Fig. 6b). It forms the core of the ‘Eigen’ cation (H9O4+, Fig. 7c). The strength of the donated hydrogen bonds are over twice as strong as those between H2O molecules in bulk water (Markovitch and Agmon, 2007), such that the H3O+ cation can be considered as H9O4+ in solution. The polarization causes these first shell water molecules to each donate two further hydrogen bonds, but poorly accept, with strengths still somewhat higher than bulk water (Markovitch and Agmon, 2007). Second shell water molecules also donate two hydrogen bonds, but accept only one with a rather weak hydrogen bond, with strengths still fractionally higher than bulk water (Markovitch and Agmon, 2007). The bias towards donated rather than accepted hydrogen bonds, within the two-shell H21O10+ ion cluster, requires that this hydrated ion must be surrounded by a zone of broken hydrogen bonds. This is confirmed by infrared spectra that show that the presence of an H3O+ ion extends to affect the hydrogen bonding of at least 100 surrounding water molecules (Mizuse et al. 2007).

Figure 7: The asymmetric (a) and symmetric (b) Zundel dihydronium ions (H5O2+) and the Eigen cation (c, H9O4+) are drawn using ab initio calculations using the 6-31G** basis set and HyperChem 8 Professional. Bond distances, angles and atomic charges are derived from these effectively gas phase calculations. The charges on the oxygen atoms are almost back to their values (95-98%) in the water molecule (Fig. 6a).
The hydroxonium ion exchanges its excess proton by binding strongly to another water molecule to form exchanging H 5O2+. The presence of these three minima for the proton, of similar energy, lying so close between the two H2O oxygen atoms, eases the transfer of protons between water molecules. The proton moves very quickly (< 100 fs, Woutersen and Bakker , 2006) between the extremes of triply-hydrogen bonded H3O+ (H9O4+, the Eigen cation, Fig. 7c) ions through symmetrical H5O2+ ions (the Zundel cation, Fig. 7b) (Marx et al. 1999), with the low potential energy barriers washed out by the zero-point motion of the proton (Woutersen and Bakker , 2006). Certainly, hydrogen ions at the surface of water cannot be considered as permanent features as their charges are expected to move between water molecules on a picosecond timescale. Note that the tiny movement of the proton gives rise to a much greater movement of the center of positive charge and consequent electric field shifts. Preference for the Zundel cation structure occurs when its outer hydrogen bonding is approximately isotropic as in the tetrahedral H13O6+ (Headrick et al. 2005) and is, therefore thought less likely than the anisotropic Eigen cation to be naturally found at the gas-liquid interface.
The Eigen cation (H 9O4+) is the most stable hydrated proton species in liquid water, and the most likely hydrated protonated water cluster to be found at the gas-liquid interface. As shown (Fig. 7c), it may support the presence of ‘free’ dangling O-H groups on its pendant hydrogen-bonded neighboring water molecules. However, such structuring would restrict the movement of charge via the Grotthuss mechanism.
The hydration of the hydroxide ion (Fig. 6c) is neither as well-known nor simply described as the hydrogen ion. Most experimental structural work on this hydrated ion involves concentrated or very concentrated solutions, containing structure-controlling cations, compared with the study of acids that generally involves less-disruptive anions. Within such experimental environments, the basic tetrahedral structuring of water is destroyed and the specific effects of solvent-separated and contact ion pairs confuse any results. The hydroxide ion strongly interacts with other water molecules to give clusters and is essentially absent, as such, in aqueous solution. The extent of this hydration is, however, less clear.
Although many recent studies have attempted to determine the preferred hydration of the hydroxide ion in solution, there is no consensus. In particular, the hydrogen bonding capacity utilizing the donated OH– proton, remains in serious doubt. No local minima is found in ab initio calculations for a water hydrogen-bonded to the OH– proton unless held by an extensive, and intrinsically somewhat unlikely, network of bridging hydrogen bonds from sixteen other water molecules (Novoa et al. 1997). The nearest aqueous oxygen atom to the hydroxide proton appears to average about 0.25 nm, almost twice the distance of the hydroxide ions accepting hydrogen bonds (~0.14 nm), well outside the normal hydrogen-bond signature distance of 0.15- 0.21 nm (Botti et al. 2004b) and at a distance often considered as showing the absence of a bond (Khan, 2000). The O-H stretch vibration behaves as the free hydroxyl group in small gas-phase clusters (Robertson et al. 2003) and both concentrated and more dilute hydroxide solutions (Corridoni et al. 2007). In confirmation, Fourier transform infrared (FTIR) spectroscopy of HDO isotopically diluted in H2O finds the free hydroxide O-H stretch at higher frequency indicative of very weak or absent hydrogen bonding (Smiechowski and Stangret, 2007).
It is probable, however, that a fleeting very weak hydrogen bond may facilitate the OH– transport mechanism (Botti et al. 2004a). The lack of such a weak hydrogen bond may be of importance in stabilizing such ions at the water-gas interface, as surface oriented hydroxide ions would not have any water molecules in this position. In contrast with the movement of hydrogen ions, which does not require a donor hydrogen bond to the oxonium ion, this may cause a much slower diffusion of surface hydroxide ions to the bulk relative to hydrogen ions. However, this difficulty is contra-indicated by the finding of a low energy barrier for proton transfer (~0.9 kJ mol-1) in H3O2–, so allowing easy equilibration of the proton’s position (Samson and Klopper, 2002) as occurs with H5O2+.
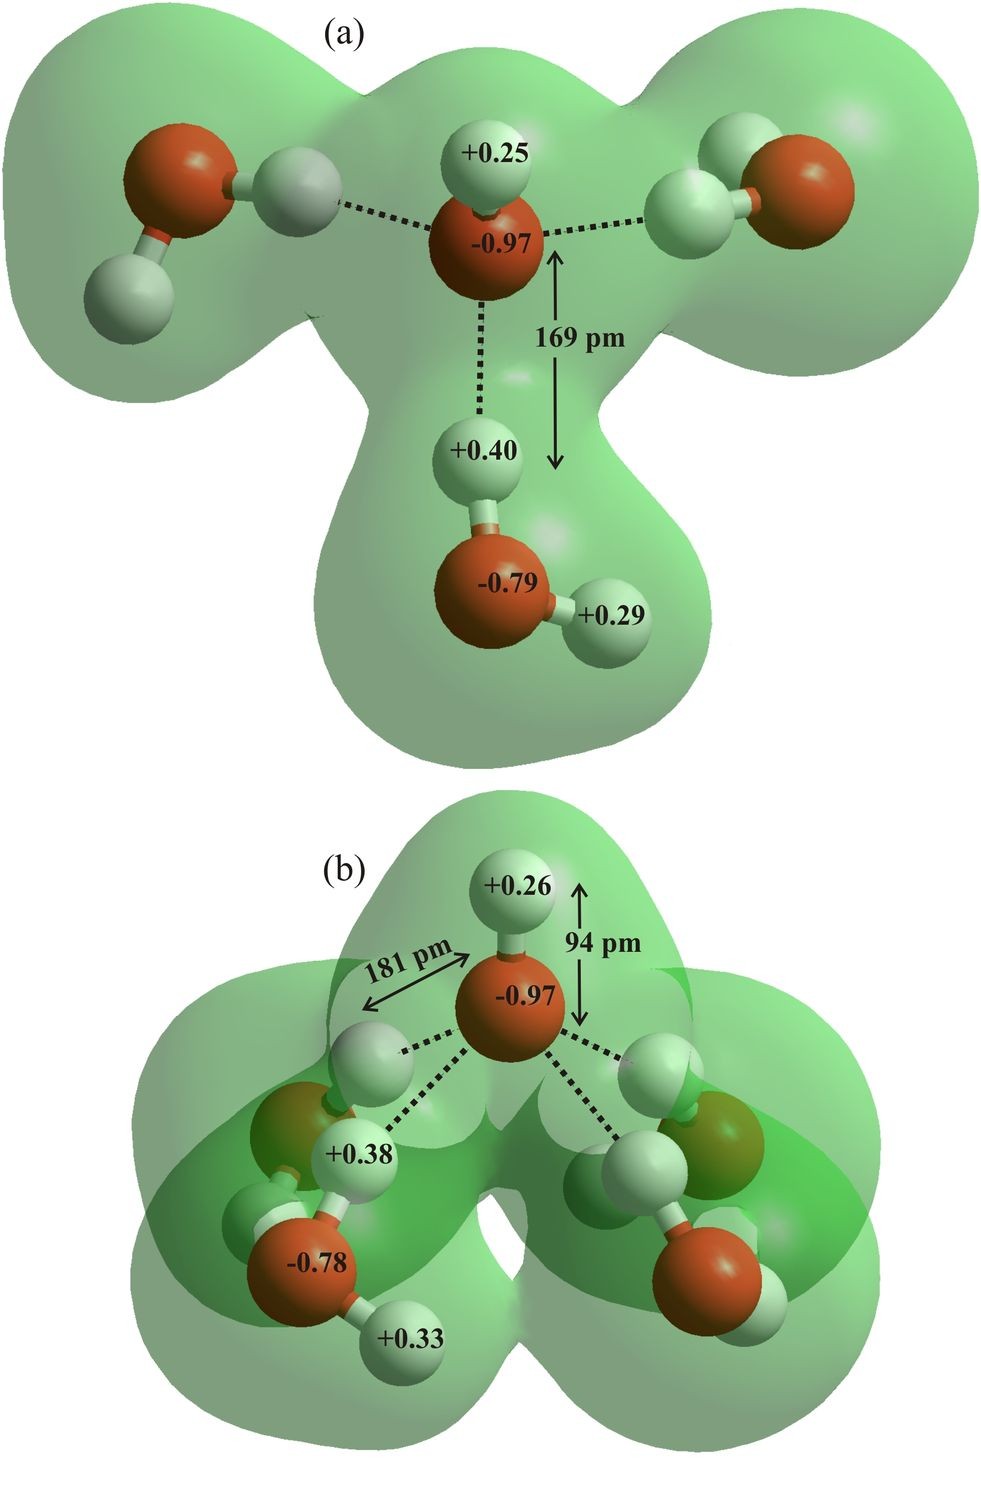
Figure 8: The hydroxyl ion, hydrated by three (a) and four (b) water molecules are drawn using ab initio calculations using the 6-31G** basis set and HyperChem 8 Professional. Bond distances, angles and atomic charges are derived from these effectively gas phase calculations. The charge on the hydrogen atom of the hydroxyl ions is well below (~75%) its value in the water molecule (Fig. 6a).
The hydroxide ion (OH–, Fig 6b) is a very good acceptor of hydrogen bonds, with three to four water molecules binding strongly to form H7O4– (Fig 8a) and H9O5– (Fig 8b), as its lone-pair electron distribution around the hydroxide ion is smeared out and not tetrahedrally situated (Tuckerman et al. 2006). As the hydration increases, the hydroxide O-H bond becomes shorter, its hydrogen atom more positive and its oxygen atom less negative. The hydrogen bonds become longer and individually weaker whereas the hydrogen bonded water molecules become less polarized. The tetrahedral ion H7O4– (Fig. 8a) is probably the most stable hydrated hydroxide ion (Asthagiri et al. 2003) being slightly energetically favored over H3O2– (Agmon, 2000). It hydrogen bonds well at the surface of small clusters and even in the gas phase (Meot-Ner and Speller, 1986). Hydroxide hydrogen bonded to four water molecules have been recently reported using neutron diffraction, with empirical structure refinement, (Botti et al. 2004b), and X-ray absorption spectroscopy (Cappa et al. 2007), with both studies utilizing concentrated hydroxide solutions. It should be noted, however, that at such high concentrations most, if not all, water molecules must be within the first shell of at least one ion (Botti et al. 2004a) and the normal tetrahedral clustering of water, as found in more dilute solutions, has been destroyed. Certainly the Raman spectra of hydroxide solutions changes when the solution is diluted below OH–:H2O 1:20 (Corridoni et al. 2007). Also, HO–(··HOH)4was found to be energetically unfavorable using quasi-chemical theory (Asthagiri et al. 2003) and spectroscopic studies indicate the 4th H2O in HO–(··HOH)4 to be preferably hydrogen bonded to the other three forming a second shell (Robertson et al. 2003).
The strong hydrogen bonding between the hydroxide ion (OH–) and its first shell water molecules is thought responsible for the very large temperature dependence of the hydroxide reorientation, with three-fold increase in activation energy at low temperatures (< 290 K, Thøgersen et al. 2008). Although thought possibly due to the presence of hyper-coordinated HO–··(HOH)4 clusters (Thøgersen et al. 2008), such an effect could equally well be due to dominant tetrahedral HO–··(HOH)3–(··HOH)4 ion (Fig. 8b) has importance in dilute solutions beyond its, perhaps transient, formation during diffusion. It is worth noting, perhaps, that Eigen cations H9O4+, but not hydrogen bonded hydroxyl ions (e.g. H7O4–), can simply reorient by inversion (like a wind-blown umbrella) with an activation energy far less than that of a hydrogen bond and this may occur as an alternative, or even preferred, pathway to rotation within dynamic hydrogen bonded clusters. Fixing the hydroxonium ion on the surface would tend to prevent this inversion and reduce its presence there.
Conclusions
The structure of the surface of water is not completely understood but some information has been determined. It is well-structured and contains clusters of water molecules held by strong hydrogen bonds As such it interacts better with polarizable and low surface charge density chaotropic ions but poorly with kosmotropic ions, except for hydrogen or hydroxyl ions. The ‘natural’ state of such interfaces appears to be negative (Schechter et al.1998; Tammet et al.2008) as at hydrophobic surfaces (Tandon et al. 2008; Zangi and Engberts, 2005). This view is greatly influenced by the undisputedly negative zeta potential of such interfaces, which remains the only unambiguous experimental conclusion.
The inference that the surface of pH-neutral water is positive cannot be fairly made from current modeling studies. The pH values of the modeled systems appear to be well below the experimentally determined isoelectric point. For example, if just one hydronium ion to 71 water molecules (as Buch et al. 2007), the pH would be 0.1 and even if there were 1000 water molecules the pH (1.3) is still far below the expected isoelectric point of at least pH 3. Therefore, such modeling does not predict the effects under neutral conditions. Note that the presence of non-combining hydroxide ions, within the simulation, does not change this argument. In addition, the effects of the gas phase are not included in the modeled surface nor are the poor predictions, otherwise made using these models, generally stated. The counter-argument that all the experimental zeta potential evidence by many researchers over many years in many places (and which is self-consistent) is faulty due to adventitious negatively charged adsorbents (all coincidently apparently possessing the same properties and concentrations) has no obvious foundation apart from the wishfulness of some.
In acid solutions, it is likely that some oxonium ions (e.g. H 3O+) are present at the surface where they preferentially orient. Their dipoles point away from the surface as they only poorly accept hydrogen bonds, but strongly donate three, with their oxygen atom pointing at the surface (Petersen et al. 2004a). This would certainly be expected to encourage these ions to sit at the interface in the absence of competing hydroxyl anions. However, there is no evidence for their excess elsewhere within the surface layer and it remains unproven whether they ever produce a net surface excess without the presence of surface-active counterions, such as iodide. At neutral pH, there is the experimental zeta potential evidence for a lower concentration of hydrogen ions than hydroxide ions at the surface.
Vácha et al. (2008b) has suggested that techniques scrutinizing the water-gas interface from the vapor side can see it as acidic, while those examining it from the aqueous bulk side it will appear as basic. However, there seems little evidence in support as no experimental method has unambiguously shown that the surface is positive but several show it unambiguously as being negative (Hänni-Ciunel et al. 2009; Beattie et al. 2009). As hydroxide ions seem to be preferred over hydrogen ions, above a pH of about three, this generally reinforces the interface’s negative charge compared with the bulk.
References
Agmon N (2000). Mechanism of hydroxide mobility. Chem Phys Lett 319: 247-252.
Archontis G, Leontidis E (2006). Dissecting the stabilization of iodide at the air-water interface into components: A free energy analysis. Chem Phys Lett 420: 199-203.
Asthagiri D, Pratt LR, Kress JD, Gomez MA (2003). The hydration state of OH –(aq). Chem Phys Lett 380: 530-535.
Baldelli S, Schnitzer C, Shultz MJ (1998). First spectroscopic evidence for molecular HCl on a liquid surface with sum frequency generation. J Chem Phys 108: 9817-9820.
Bandura AV, Lvova SN (2006). The ionization constant of water over wide ranges of temperature and density. J Phys Chem Ref Data 35: 15-30.
Beaglehole D (1987). Structural changes in the surface of water. J Phys Chem 91: 5091-5092.
Beattie JK (2006). The intrinsic charge on hydrophobic microfluidics substrates. Lab Chip 6: 1409-1411.
Beattie JK (2007). The Intrinsic Charge at the Hydrophobe/Water Interface. In Colloid Stability The Role of Surface Forces, Part II, Tadros T ed. Wiley-VCH:Weinheim Vol 2. 153-64.
Beattie JK (2008). Comment on Autoionization at the surface of neat water: is the top layer pH neutral, basic, or acidic? by R. Vácha, V. Buch, A. Milet, J. P. Devlin and P. Jungwirth, Phys. Chem. Chem. Phys., 2007, 9, 4736. Phys Chem Chem Phys 10: 330-331.
Beattie JK, Djerdjev AM, Warr GG (2009). The surface of water is basic. Faraday Discuss 141: 31-39.
Bian H, Feng R, Xu Y, Guo Y, Wang H (2008). Increased interfacial thickness of the NaF, NaCl and NaBr salt aqueous solutions probed with non-resonant surface second harmonic generation (SHG). Phys Chem Chem Phys 10: 4920-4931.
Boström M, Kunz W, Ninham BW (2005). Hofmeister effects in surface tension of aqueous electrolyte solution. Langmuir 21: 2619-2623.
Botti A, Bruni F, Imberti S, Ricci MA, Soper AK (2004a). Ions in water: the microscopic structure of concentrated NaOH solutions. J Chem Phys 120: 10154-10162.
Botti A, Bruni F, Imberti S, Ricci MA, Soper AK (2004b). Solvation shell of OH – ions in water. J Mol Liq 117: 81-84.
Brown MA, DAuria R, Kuo IW, Krisch MJ, Starr DE, Bluhm H, Tobias DJ,. Hemminger JC (2008). Ion spatial distributions at the liquid-vapor interface of aqueous potassium fluoride solutions. Phys Chem Chem Phys 10: 4778-4784.
Buch V, Milet A, Vácha R, Jungwirth PI, Devlin JP (2007). Water surface is acidic. Proc Nat Acad Sci 104: 7342-7347.
Camaioni DM, Schwerdtfeger CA (2005) Comment on “Accurate experimental values for the free energies of hydration of H +, OH–, and H3O+“. J Phys Chem A 109: 10795-10797.
Cappa CD, Drisdell WS, Smith JD, Saykally RJ, Cohen RC (2005). Isotope fractionation of water during evaporation without condensation. J Phys Chem B 109: 24391-24400
Cappa CD, Smith JD, Messer BM, Cohen RC Saykally RJ (2007). Nature of the aqueous hydroxide ion probed by X-ray absorption spectroscopy. J Phys Chem A 111: 4776-4785.
Chaplin MF (2000). A proposal for the structuring of water. Biophys Chemist 83: 211-221.
Chaplin M (2008a). Anomalous properties of water, http://www.lsbu.ac.uk/water/anmlies.html [12-12-2008].
Chaplin M (2008b). Nanobubbles, http://www.lsbu.ac.uk/water/nanobubble.html [12-12-2008].
Cho CH, Urquidi J, Gellene GI, Robinson GW (2001). Mixture model description of the T-, P dependence of the refractive index of water. J Chem Phys 114: 3157-3162;
Harvey AH (2001). Comment. J Chem Phys 115: 7795;
Cho CH, Urquidi J, Gellene GI (2001). Reply. J Chem Phys 115: 7796-7797.
Corridoni T, Sodo A, Bruni F, Ricci M-A, Nardone M (2007). Probing water dynamics with OH –. Chem Phys 336: 183-187.
Craig VSL, Ninham BW, Pashley RM (1993). Effect of electrolytes on bubble coalescence. Nature 364: 317-319.
Craig VSL (2004). Bubble coalescence and specific ion effects. Curr Opin Colloid Interface Sci 9: 178-184.
Dill KA, Bromberg S (2003). Molecular Driving Forces: Statistical Thermodynamics in Chemistry and Biology, Taylor & Francis, London: 399-403.
Drzymala J, Sadowski Z, Holysz L, Chibowski E (1999). Ice/water interface: zeta potential, point of zero charge, and hydrophobicity. J Colloid Interface Sci 220: 229-234.
Du Q, Superfine R, Freysz E, Shen YR (1993). Hydrogen bonding at the pure water liquid/vapor interface. Phys Rev Lett 70: 2313-2316.
Francis MJ, Gulati N R. Pashley RM (2006). The dispersion of natural oils in de-gassed water. J Colloid Interface Sci 299: 673-677.
Gan W, Wu D, Zhang Z, Guo Y, Wan H (2006). Orientation and motion of water molecules at air/water interface. Chinese J Chem Phys 19: 20-24.
Garrett BC (2004). Ions at the air/water interface. Science 303: 1146-1147.
Geissler PL, Dellago C, Chandler D, Hutter J, Parrinello M (2001). Autoionization in liquid water. Science 291: 2121-2124.
Goh MC, Hicks JM, Hemnitz K, Pinto GR, Bhattacharyya K, Eisenthal KB, Heinz TF (1988). Absolute orientation of water molecules at the neat water surface. J Phys Chem 92: 5074-5075.
Gopalakrishnan S, Liu D, Allen HC (2006). Vibrational spectroscopic studies of aqueous interfaces: salts, acids, bases, and nanodrops. Chem Rev 106: 1155-1175.
Graciaa A, Morel G, Saulner P, Lachaise L, Schechter RS (1995). The ζ-potential of gas bubbles. J Colloid Interface Sci 172: 131-136.
Greef R, Frey JG (2008). The water-like film on water. Physica Status Solidi 5: 1184-1186.
Hacker PT (1951). Experimental values of the surface tension of supercooled water. Technical note 2510, National Advisory Committee for Aeronautics, Washington.
Hänni-Ciunel K, Natascha Schelero N, von Klitzing R (2009). Negative charges at the air/water interface and their consequences for aqueous wetting films containing surfactants. Faraday Discus. 141: 41-53.
Headrick JM, Diken EG, Walters RS, Hammer NI, Christie RA, Cui J, Myshakin EM, Duncan MA, Johnson MA, Jordon KD (2005). Spectral signatures of hydrated proton vibrations in water clusters. Science 308: 1765-1769.
Henry CL, Dalton CN, Scruton L, Craig VSL (2007). Ion-specific coalescence of bubbles in mixed electrolyte solutions. J Phys Chem C 111: 1015-1023.
Henson BF, Voss LF, Wilson KR, Robinson JM (2005). Thermodynamic model of quasiliquid formation on H 2O ice: Comparison with experiment. J Chem Phys 123: 144707.
Hrubý J, Holten V (2004). A two-structure model of thermodynamic properties and surface tension of supercooled water. 14 th Int Conf Properties Water Steam, Kyoto.
IAPWS (1994). Release on surface tension of ordinary water substance, International Association for the Properties of Water and Steam. URL http://www.iapws.org/relguide/surf.pdf
Jakubczyk D, Zientara M, Kolwas K, Kolwas M (2007). Temperature dependence of evaporation coefficient for water measured in droplets in nitrogen under atmospheric pressure. J Atm Sc 64: 996-1004.
Jungwirth, P, Tobias, DJ (2006). Specific ion effects at the air/water interface (Review). & Introduction to the Special Issue. Chem Rev 106: 1259-1258.
Jungwirth P, Winter B (2008). Ions at aqueous interfaces: From water surface to hydrated proteins. Ann Rev Phys Chem 59: 343-366.
Karelin AI, Tarasenko VA (2003). Determination of the degree of electrolytic dissociation of perchloric acid by vapor pressure. Russ Chem Bull Int Ed 52: 1959-1965.
Kathmann SM, Kuo I-FW Mundy CJ (2008). Electronic effects on the surface potential at the vapor-liquid interface of water. J Am Chem 130 (49): 16556–16561.
Khan A (2000). A liquid water model: Density variation from supercooled to superheated states, prediction of H-bonds, and temperature limits. J Phys Chem 104: 11268-11274.
Khan A, Khan MR, Khan MF, Khanam F (2001). A liquid water model that explains the variation of surface tension of water with temperature. Jpn J Appl Phys 40: 1467-1471.
Khizhnyak EP, Khizhnyak EE (2007). Self-structuring processes in superficial layers of water studied using method of high resolution infrared thermography. Abstracts of Second Annual Conference on the Physics and Chemistry of Water, Vermont. URL http://www.vermontphotonics.net/water_2007/abstracts/Khizhnyak_Abstract_2007.pdf [12-12-2008].
Klitzing R (2005) Effect of interface modification on forces in foam films and wetting films. Adv Colloid Interface Sci 114–115: 253– 266.
Knipping EM, Lakin MJ, Foster KL, Jungwirth P, Tobias DJ, Gerber RB, Dabdub D, Finlayson-Pitts BJ (2000). Experiments and simulations of ion-enhanced interfacial chemistry on aqueous NaCl aerosols. Science 288: 301-306.
Kobayashi K, Watanabe S, Yamano D, Yano T, Fujikawa S (2008). Condensation coefficient of water in a weak condensation state. Fluid Dynamics Res 40: 585-596.
Kochurova NN, Rusanov AI (1981). Dynamic surface properties of water: Surface tension and surface potential. J Coll Interface Sci 81: 297-303.
Kudin KN, Car R, (2008). Why are water-hydrophobic interfaces charged? J Am Chem Soc 130: 3915-3919.
Kuo I-FW, Mundy CJ (2004). An ab initio molecular dynamics study of the aqueous liquid-vapor interface. Science 303: 658-660.
Kuz’min VL (2000). Surface polarization in a highly polar liquid. Colloid J 62: 152-158.
Levering LM, Sierra-Hernández MR, Allen HC (2007). Observation of hydronium ions at the air-aqueous acid interface: vibrational spectroscopic studies of aqueous HCl, HBr, and HI. J Phys Chem C 111: 8814-8826.
Leyendekkers JV (1983). Aqueous solutions. 1. Structural thermodynamic internal pressure of water. J Phys Chem 87: 3327-3333.
Liu P, Harder E, Berne BJ (2005). Hydrogen-bond dynamics in the air-water interface. J Phys Chem B 109: 2949-2955.
Lützenkirchen J, Preoanin T, Kallay N (2008). A macroscopic water structure based model for describing charging phenomena at inert hydrophobic surfaces in aqueous electrolyte solutions. Phys Chem Chem Phys 10: 4946-4955.
Markovitch O, Agmon A (2007). Structure and energetics of the hydronium hydration shells. J Phys Chem A 111: 2253-2256.
Marx D, Tuckerman ME, Hutter J, Parrinello M (1999). The nature of the hydrated excess proton in water. Nature 397: 601-604.
Massoudi R, King AD (1974). Effect of pressure on the surface tension of water. Adsorption of low molecular weight gasses on water at 25°. J Phys Chem 78: 2262-2266.
McCoustra MRS (2008). Water at interfaces. Phys Chem Chem Phys 10: 4676-4677.
Meot-Ner M, Speller CV (1986). Filling of solvent shells about ions. 1. Thermochemical criteria and the effects of isomeric clusters. J Phys Chem 90: 6616-6624.
Mizuse K, Fujii A, Mikami N (2007). Long range influence of an excess proton on the architecture of the hydrogen bond network in large-sized water clusters. J Chem Phys 126: 231101.
Mucha M, Frigato T, Levering LM, Allen HC, Tobias DJ, Dang LX, Jungwirth P (2005). Unified molecular picture of the surfaces of aqueous acid, base, and salt solutions. J Phys Chem B 109: 7617-7623.
Müller A, Bögge H, Diemann E (2003). Structure of a cavity-encapsulated nanodrop of water. Inorg Chem Commun 6: 52-53; Corrigendum: Müller A, Bögge H, Diemann E (2003). Structure of a cavity-encapsulated nanodrop of water. Inorg Chem Commun 6: 329.
Myhre CEL, Nielsen CJ, Saastad OW (1998) Density and surface tension of aqueous H 2SO4 at low temperature. J Chem Eng Data 43: 617-622.
Nickolov ZS, Miller JD (2005). Water structure in aqueous solutions of alkali halide salts: FTIR spectroscopy of the OD stretching band. J Colloid Interface Sci 287: 572-580.
Novoa JJ, Mota F, Perez del Valle C, Planas M (1997). Structure of the first solvation shell of the hydroxide anion. A model study using OH –(H2O)n (n = 4, 5, 6, 7, 11, 17) clusters. J Phys Chem A 101: 7842-7853.
Ogawa N, Matsuura Y (2004). Theoretical calculation of the surface energy of water, arXiv:physics/0411077v3 [physics.chem-ph].
Pashley RM, Rzechowicz M, L. Pashley LR, Francis MJ (2005). De-gassed water is a better cleaning agent. J Phys Chem B 109: 1231-1238.
Paul S. Chandra A (2004). Hydrogen bond dynamics at vapor-water and metal-water interfaces. Chem Phys Lett 386: 218-224.
Pellicer J, García-Morales V, Guanter L, Hernández MJ, Dolz M, (2002). On the experimental values of the water surface tension used in some textbooks. Am J Phys 79: 705-709.
Petersen MK, Iyengar SS, Day TJF, Voth GA (2004a). The hydrated proton at the water liquid/vapor interface. J Phys Chem B108: 14804-14806.
Petersen PB, Johnson JC, Knutsen KP, Saykally RJ (2004b). Direct experimental validation of the Jones-Ray effect. Chem Phys Lett 397: 46-50.
Petersen PB, Saykally RJ (2005). Adsorption of ions to the surface of dilute electrolyte solutions: The Jones-Ray effect revisited. J Am Chem Soc 127: 15446-15452.
Petersen PB, Saykally RJ (2008). Is the liquid water surface basic or acidic? Macroscopic vs. molecular-scale investigations. Chem Phys Lett458: 255-261.
Pitzer KS (1995). Thermodynamics, 3rd Ed. McGraw-Hill, Inc, New York pp 400-419.
Randles JEB (1977). Structure at the free surface of water and aqueous electrolyte solutions. Phys Chem Liq 7: 107-179.
Raymond EA, Richmond GL (2004). Probing the molecular structure and bonding of the surface of aqueous salt solutions. J Phys Chem B108: 5051-5059.
Rice OK (1947). The effect of pressure on surface tension. J Chem Phys 15: 333-335.
Robertson WH, Diken EG, Price EA, Shin J-W, Johnson MA (2003). Spectroscopic determination of the HO – solvation shell in the HO–(··HOH)nScience 299: 1367-1372.
clusters.
Roeselová M, Vieceli J, Dang LX, Garrett BC, Tobias DJ (2004). Hydroxyl radical at the air-water interface. J Am Chem Soc 126: 16308-16309.
Sachs W1, Meyn V (1995). Pressure and temperature dependence of the surface tension in the system natural gas/water principles of investigation and the first precise experimental data for pure methane/water at 25°C up to 46.8 MPa. Colloids Surfaces A 94: 291-301.
Samson CCM, Klopper W (2002). Ab initio calculation of proton barrier and binding energy of the (H 2O)OH– complex. J Mol Structr (Theochem) 586: 201-208.
Scatena LF, Brown MG, Richmond GL (2001). Water at hydrophobic surfaces: weak hydrogen bonding and strong orientation effects. Science 292: 908-912.
Schechter RS, Graciaa A, Lachaise J (1998). The electrical state of a gas/water interface. J Colloid Interface Sci 204: 398-399.
Shamay ES, Buch V, Parrinello M, Richmond GL (2007). At the water’s edge: nitric acid as a weak acid. J Am Chem Soc 129: 12910-12911.
Shaw RA, Durant AJ, Mi Y (2005). Heterogeneous surface crystallization observed in undercooled water. J Phys Chem B 109: 9865-9868.
Shi Q, Belair SD, Francisco JS, Kais S (2003). On the interactions between atmospheric radicals and cloud droplets: A molecular picture of the interface. Proc Nat Acad Sci 100: 9686-9690.
Shin JW, Hammer NI, Diken EG, Johnson MA, Walters RS, Jaeger TD, Duncan MA, Christie RA, Jordan KD (2004). Infrared signature of structures associated with the H +(H2O)n (n = 6 to 27) clusters. Science 304:1137-1140.
Shultz MJ, Schnitzer C, Simonelli D, Baldelli S (2000 ). Sum frequency generation spectroscopy of the aqueous interface: ionic and soluble molecular solutions. Int Rev Phys Chem 19: 123-153.
Simonelli D, Baldelli S, Shultz MJ (1998). Ammonia-water complexes on the surface of aqueous solutions observed with sum frequency generation. Chem Phys Lett 298: 400-404.
Smiechowski M, Stangret J (2007). Hydroxide ion hydration in aqueous solutions. J Phys Chem A 111: 2889-2897.
Smith JD, Cappa CD, Drisdell WS, Cohen RC, Saykally RJ (2006). Raman thermometry measurements of free evaporation from liquid water droplets. J Am Chem Soc 128: 12892-12898.
Smits M, Ghosh A, Sterrer M, Müller M, Bonn M (2007). Ultrafast vibrational energy transfer between surface and bulk water at the air-water interface. Phys Rev Lett 98: 098302.
Sokham VP, Tildesley DJ (1997). The free surface of water: molecular orientation, surface potential and nonlinear susceptibility. Mol Phys 92: 625-640.
Sovago M, Campen RK, Wurpel GWH, Müller M, Bakker HJ, Bonn M (2008a). Vibrational response of hydrogen-bonded interfacial water is dominated by intramolecular coupling. Phys. Rev. Lett. 100:173901.
Sovago M, Campen RK, Wurpel GWH, Müller M, Bakker HJ, Bonn M (2008b). Sovago et al. Reply. Phys. Rev. Lett.101:139402.
Sovago M, Campen RK, Bakker HJ, Bonn M (2009). Hydrogen bonding strength of interfacial water determined with surface sum-frequency generation. Chem. Phys. Lett. 470: 7-12.
Stepanov IA (2008). First law of thermodynamics for materials with negative thermal expansion. Materials Res Innovations 12: 28-29.
Svanberg M, Pettersson JBC (1998). Structure and thermodynamics of H +(H2O)n (n = 9, 21, 40) clusters between 0 and 300 K. A Monte Carlo study. J Phys Chem A 102: 1865-1872.
Tammet H, Hõrrak U, Kulmala M (2008). Negatively charged nanoparticles produced by splashing of water. Atmos Chem Phys Discuss 8: 16609-16641.
Tandon V, Bhagavatula SK, Nelson WC, Kirby BJ (2008) Zeta potential and electroosmotic mobility in microfluidic devices fabricated from hydrophobic polymers: 1. The origins of charge. Electrophoresis 29: 1092-1101.
Tarbuck TL, Ota ST, Richmond GL (2006). Spectroscopic studies of solvated hydrogen and hydroxide ions at aqueous surfaces. J Am Chem Soc 128: 14519-14527.
Teschke O, de Souza EF (2005). Water molecule clusters measured at water/air interfaces using atomic force microscopy . Phys Chem Chem Phys 7: 3856-3865.
Thøgersen J, Jensen SK, Petersen C, Keiding SR (2008). Reorientation of hydroxide ions in water. Chem Phys Lett 466: 1-5.
Tian CS, Shen YR (2008). Comment on “Vibrational response of hydrogen-bonded interfacial water is dominated by intramolecular coupling”. Phys. Rev. Lett. 101: 139401.
Tian CS, Shen YR (2009). Sum-frequency vibrational spectroscopic studies of water/vapor interfaces. Chem. Phys. Lett. 470: 1-6.
Tian C, Ji N, Waychunas GA, Shen YR (2008). Interfacial structures of acidic and basic aqueous solutions. J Am Chem Soc 130: 13033-13039.
Tsang YH, Koh Y-H, Koch DL (2004). Bubble-size dependence of the critical electrolyte concentration for inhibition of coalescence. J Colloid Interface Sci 275: 290-297.
Tuckerman ME, Chandra A, Marx D (2006). Structure and dynamics of OH – (aq). Acc Chem Res 39: 151-158.
Vácha R, Slavíek P, Mucha M, Finlayson-Pitts BJ, Jungwirth, P (2004). Adsorption of atmospherically relevant gases at the air/water interface: free energy profiles of aqueous solvation of N 2, O2, O3, OH, H2O, HO2, and H2O2. J Phys Chem A 108: 11573-11579.
Vácha R, Buch V, Milet A, Devlin JP, Jungwirth P (2007). Autoionization at the surface of neat water: is the top layer pH neutral, basic, or acidic? Phys Chem Chem Phys 9: 4736-4747.
Vácha R, Horinek D, Berkowitz ML, Jungwirth P (2008a). Hydronium and hydroxide at the interface between water and hydrophobic media. Phys Chem Chem Phys 10: 4975-4980.
Vácha R, Buch V, Milet A, Devlin JP, Jungwirth P (2008b). Response to comment on Autoionization at the surface of neat water: is the top layer pH neutral, basic, or acidic? by J. K. Beattie. Phys Chem Chem Phys 10: 332-333.
Vácha R, Zangi R, Engberts JBFN, Jungwirth P (2008c). Water structuring and hydroxide ion binding at the interface between water and hydrophobic walls of varying rigidity and van der Waals interactions. J Phys Chem C 112: 7689-7692.
VandeVondele J, Sprik M, (2005). A molecular dynamics study of the hydroxyl radical in solution applying self-interaction-corrected density functional methods. Phys Chem Chem Phys 7: 1363-1367.
Vavruch I (1995a). Thermodynamic method for the evaluation of the pressure coefficient of a liquid-gas interface. Langmuir 11: 2843-2844.
Vavruch I (1995b). On the evaluation of the surface tension-pressure coefficient for pure liquids. J Colloid Interface Sci 169: 249-250.
Vrbka L, Jungwirth P (2006). Homogeneous freezing of water starts in the subsurface. J Phys Chem B 110: 18126-18129.
Vrij A (1968). Light scattering from liquid interfaces. Advan Colloid Interface Sci 2: 39-64.
Weissenborn PK, Pugh, RJ (1996). Surface tension of aqueous solutions of electrolytes: relationship with ion hydration, oxygen solubility, and bubble coalescence. J Colloid Interface Sci 184: 550-563.
Wilson KR, Schaller RD, Co DT, Saykally RJ, Rude BS, Catalano T, Bozek JD, (2002 ). Surface relaxation in liquid water and methanol studied by x-ray absorption spectroscopy . J Chem Phys 117: 7738-7744.
Woutersen S, Bakker HJ (2006). Ultrafast vibrational and structural dynamics of the proton in liquid water. Phys Rev Lett 96: 138305.
Wu D, Wang Y-Z, Zhang J-X (2007). Contact to contact transition: Direct measurement of interaction between a solid probe and a planar air-water interface. Chin Phys Lett 24: 2914-2917.
Yang C, Dabros T, Li D, Czarnecki J, Masliyah JH (2001). Measurement of the zeta potential of gas bubbles in aqueous solutions by microelectrophoresis method. J Colloid Interface Sci 243: 128-135.
Yatsuzuka K, Higashiyama Y, Asano K (1996). Electrification of polymer surface caused by sliding ultrapure water. IEEE Trans Ind Appl 32: 825-831.
Zagaynov VA, Nuzhny VM, Cheusova TA, Lushnikov AA (2000). Evaporation of water droplet and condensation coefficient: theory and experiment. J Aerosol Sci 31(Suppl 1): S795-S796.
Zangi R, Engberts JBFN (2005) Physisorption of hydroxide ions from aqueous solution to a hydrophobic surface. J Am Chem Soc 127:2272-2276.
Zasetsky AY, Remorov R, Svichshev IM (2007). Evidence of enhanced local order and clustering in supercooled water near liquid-vapor interface: Molecular dynamic simulations. Chem Phys Lett 435: 50-53.
Zheng J-M, Chin W-C, Khijniak E, Khijniak Jr E, Pollack GH (2006). Surfaces and interfacial water: Evidence that hydrophilic surfaces have long-range impact. Adv Colloid Interface Sci127: 19-27.
Web References
1. Chaplin M (2008a). Anomalous properties of water, http://www.lsbu.ac.uk/water/anmlies.html [12-12-2008].
2. Chaplin M (2008b). Nanobubbles, http://www.lsbu.ac.uk/water/nanobubble.html [12-12-2008].
Discussion with Reviewers
James K. Beattie1: I have just one question for Dr. Chaplin, but it is a large and generic one. He concludes that the surface of neutral water is negative. How then is all of the evidence presented in the bulk of his article to be interpreted, or reinterpreted? Perhaps it would take another article of similar length to address this question comprehensively, but some selected and significant aspects could be considered now.
For examples:
1. How are the negative balloelectric particles generated by the splashing of rain drops consistent with a negative surface but an electrically neutral double layer within the drop?
2. What alternative explanation of the results of Petersen and Saykally would be consistent with the conclusion that the surface is negative due to hydroxide ions, an interpretation that they reject?
3. How would the hydroxide ions affect the refractive index of the surface?
4. How does the presence of hydroxide ions affect the surface tension of water, and how does it modify the effect of other ions on the surface tension?’
Martin Chaplin: This question is certainly ‘large.’ In my paper I present a variety of evidence concerning the surface of water. I felt that the subject required me to come to a firm conclusion, rather than to ‘opt out’ and leave that up to the reader. Having come to my own conclusion that the surface of neutral water is negative, Dr. Beattie wishes me to go further and present more proof. However, if there were further proof, I would have given it. Certainly, there is room for further debate. Below, I attempt to answer the particular points raised.
1. The key fact concerning the balloelectric effect (H. Tammet, U. Hõrrak and M. Kulmala, Negatively charged nanoparticles produced by splashing of water, Atmos. Chem. Phys. Discuss. 8 (2008) 16609-16641) is that smaller water droplets are naturally negatively charged rather than positive. These small particles possess a net charge and are not neutral; so they do not possess an electrically neutral double layer. Small droplets have a larger surface area for their mass than larger droplets such that any surface stabilization of positive or negative ions is expected to be reflected in the charge of the smaller particles. As the particles are found by experiment to be negatively charged, the stabilization offered to negatively charged ions at the surface must be greater that that for positively charged ions. Consequently, larger water droplets, produced simultaneous with the small particles, possess the residual positive charge. There remains the possibility with this phenomenon that the charges are due to other species rather than hydroxide and hydrogen ions. However the absence of positively charged nanoparticles does strongly indicate the hydrogen ions are not as surface active as others suggest.
2. Petersen and Saykally hit the nail on the head when they state “Our experiments are not able to directly probe the hydronium concentration at the water surface, …” (Petersen PB, Saykally RJ (2008). Is the liquid water surface basic or acidic? Macroscopic vs. molecular-scale investigations. Chem Phys Lett 458 (2008) 255-261). Their conclusions are based on interpretations rather than being directly given by experiment. Some experimental data Petersen and Saykally discuss involves the behavior of the surface active iodides. Hydrogen ions and associated iodide ions are drawn more into the surface than sodium or potassium iodide. However, as we know that sodium ions (and to a lesser extent potassium ions) are certainly expelled from the surface, it is perfectly reasonable to expect their associated iodide ions to be less prevalent there. The hydroxide data presented is only significant at high hydroxide ion concentration when, naturally, the cation concentration is equally high and when there is effectively only a single shell, or less, of water around the ions. This is grossly inappropriate for the likely site concentration at the surface of neutral water. It is extremely likely that any putative adsorption sites would be totally swamped by this excess and then the (near zero) free energy of adsorption reported merely reflects the difficulty over cramming so many ions (both cations and anions) near to the surface.
3. Little work seems to have been done on the refractive index of solutions or their surfaces. The refractive index would be expected to rise whether there is an increase in hydrogen bond strength or an increase in solute (accompanied by broken hydrogen bonds) at the surface, so refractive index measurements may be poor discriminators for the surface structure.
4. I discuss surface tension at length in my paper. Surface tension is affected by both the cations and anions present and the total effect is not simply additive. Ammonium hydroxide and hydrogen chloride both lower the surface tension, but ammonium chloride, sodium hydroxide and sulphuric acid all raise it. Thus surface tension has difficulty in discriminating individual effects. The surface tension lowering effects seem to be mainly due to the surface active neutral species known to be present in the solutions where surface tension lowering is noted. Also worthy of comment is that the modeling studies do not generally allow the formation of the neutral species such as water (from the recombination of hydrogen and hydroxide ions), hydrogen chloride or ammonia.’
Regine von Klitzing2:
1 . The main conclusion of your article is that the air-water interface is negatively charged. Concerning the adsorption of ions at the air-water interface the question arises: “What is the driving force for the accumulation of negatively charged ions at a negatively charged interface?” This is contrary of what one would expect from the electrostatic point of view.
2. Due to the fact, that in theory only the first few layers of the interface are considered, whereas in practical experiment a bigger scale of the interface is measured, can it be, that theory and experiments are not excluding each other? Are theory and experiments compatible, if the same dimensions are considered during the analysis?’
Chaplin:
1. It is clear that like charges do not attract, but such a view wrongly attributes cause and effect. The reasons why the surface accumulates a negative charge are the same reasons why they may accumulate further negative charges. The actual concentration of negative charges is always quite low compared with the number of water molecules present. There will be an attraction to positively charged ions that do not enter the surface layer but will cause shrinkage of the double layer.
2. It would be satisfying if the theoretical and experimental approaches were to be so easily thought compatible. However, this is not the case. Theoretical approaches are basically flawed and these flaws should be more widely recognized. Until our water models can be shown to behave well in the bulk phase diagram, less reliance on them should be made at the more complex gas-liquid interface. It is true, however, that theory and experiments have vastly different scales and these differences should be additionally accommodated within the resultant discussions.’
1 Associate Professor, School of Chemistry, University of Sydney, Australia.
2 Professor, Technical University Berlin, Germany.