
 Dye Exclusion and Other Physical Properties of Hen Egg White
Cameron, I1,*
1 University of Texas Health Science Center, Department of Cellular and Structural Biology, San Antonio, Texas 78229
* Correspondence: Tel.: (210) 567-3817; E-mail: cameron@uthscsa.edu;
Key Words: Egg white, albumen, solute exclusion, vital dye, methylene blue, gel-sol
Received 10 May 2010; revised 22 July; accepted 24 July. Published 19 August 2010; available online 19 August 2010
Summary
As reported here hen egg white can be separated by sieve filtration into thin and thick albumen fractions that remain as separate non-miscible fractions. Thick albumen but not thin albumen behaves as a gel and was found to have vital dye excluding properties. Thick albumen also demonstrates swelling and shrinking under osmotic conditions and the ability to transform from a dye excluding gel to a non-dye excluding more fluid sol under the influence of pressure or agitation. Thick albumen gel that had been agitated to a sol state was observed to transform from the non-dye-excluding sol state back to a dye excluding gel state when allowed to rest without agitation. These findings may help explain vital dye exclusion by most but not all cells.
Article Outline
- Introduction
- Experimental Observations: Methods and Results
- Discussion
- Conclusions
- References
- Discussion with Reviewers
Introduction
The research focus of this laboratory has been on the physical properties of water in cells and on proteins. These physical properties of water include: motion, osmotic activity, flow, sorption and the size of the bulk and the different non-bulk water fractions (Cameron and Fullerton 2006, 2008, Fullerton et al. 2006, 2007 and Cameron et al.1988, 1997, 2007, 2008). One of the physical properties of water in cells and on proteins left to explore was solute (dye) exclusion. While preparing concentrated solutions of proteins like bovine serum albumen, egg white albumen and egg white lysozyme for physical measures, an alternate natural source of concentrated globular protein solution came to mind. The natural source is hen egg white albumen. Note that the name of the specific protein type is spelled albumin, while albumen is a generalized word referring to egg white. Egg white is readily available and an inexpensive source of a concentrated globular protein solution and was therefore chosen for study. This report deals with dye exclusion from the thick vs. the thin albumen fraction of hen egg white, but the report also deals with other physical properties of thin and thick albumen.
It is commonly held that exposure of living cells to a vital dye, like methylene blue, does not dye the living cell interior but dead cells do dye blue. There are however, reports that viable normal cells (Harris and Peters 1953), Brooks and Brooks 1941), cells adjacent to wounds (Marconi and Quintian 1998), Upile et al. 2007) and pre-malignant epithelial cells adjacent to the normal epithelial cells all do take in methylene blue as evidenced by the fact that at least their nucleus turns blue (Gordon et al. 2007, Chen et al. 2007). Two possible cellular dye excluding mechanisms are: the semi-permeability of the cell’s plasma membrane and the dye excluding properties of cell’s cytoplasm.
A question arises from the observations reported above. Does the dye excluding properties of cytoplasm/protoplasm, even without an intact cell membrane, have the ability to exclude vital dye solutes like methylene blue or other vital dyes? In at least one case, the answer is yes. This case is illustrated in Fig. 1 from Cameron et al. (1988). None of the decapsulated and membrane disruptive detergent exposed treatments resulted in dye uptake by the lens cells. It was concluded that the lens cell cytoplasm, rather than an intact cell membrane was responsible for the dye exclusion in the lens cells.
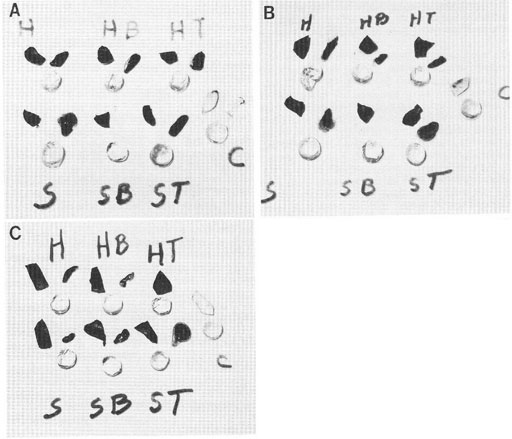
Figure 1: Photographs illustrating the result of dye exclusion tests on the lens body, lens capsule, and sclera of pig eyes with and without treatment in nonionic detergents. The round-shaped specimens are decapsulated lens. Above and to the right of each lens is the removed capsule of that lens, and above and to the left is a piece of the sclera. The letters “H” and “S” refer to the bathing solutions used (“H” = Hanks and “S” = isotonic sucrose). The letters “B” and “T” refer to cell membrane disruptive detergents (“B” = brig 58 and “T” = triton x 100). The letter “C” refers to the unstrained control. Specimens in A (top paragraph), except the unstained controls were exposed to 0.1% nigrosin. Specimens in B (middle photograph was exposed to 0.1% trypan blue, and in C (bottom photograph, were exposed to 0.1% methylene blue. After one hour in the dye solutions, the intact lenses were removed and their stained capsule removed. The lens body (less the capsules) was returned to the dye solution for 2 additional hours, then removed and placed on a glass plate along with its lens capsule and a piece of sclera. As shown here, none of the treatments resulted in dye uptake or staining of the lens body, whereas all of the lens capsule and sclera specimens took up the dye. Figure reproduced from Cameron et al. 1988 with permission of John Wiley and Sons, Inc.
Experimental Observations: Methods and Results
Observations on the distribution and on the dye exclusion properties of thin and of thick egg white albumen fractions
When an egg is cracked open and dropped on to the surface of a dark hot frying pan the egg white farthest from the yolk turns white before the thicker more viscous egg white, around the yolk, turns white. This observation reveals egg white to be composed of at least two major fractions.
An egg was cracked open and the egg white was separated from the yolk and poured gently into a beaker. The egg white did not appear to be homogeneous. Some of the more viscous egg white tended to move towards the bottom. However the more viscous egg white did not form a separate layer at the bottom of the beaker, thus simple sedimentation in a beaker by one times gravity could not be used as a means of separating egg white into two or more fractions. These observations raised questions: First, where are the different fractions of egg white located in an intact egg, and second, can the different fractions of egg white albumen be separated so that the properties of the fractions can be separately measured and analyzed? These questions are addressed next.
Published hen egg structure gives information on the spatial distribution of the more viscous thick albumen and of the less viscous thin albumen. Fig. 2 illustrates a cross section through the long axis of a hen egg and reveals the clear albumen (egg white) to consist of layers (Fig. 2 Kiple and Ornelas). Fig. 2. Just under the shell’s mammilary layer is found an outer less viscous or thin albumen layer. Next inward is a thick viscous albumen layer, then an inner thin albumen layer and finally, another very small chalaziferous layer located immediately over the yolk surface. An air cell is located at the blunt end of the egg.
Based on the layered distribution of thin and of thick albumen an experiment was done to determine the possible solute (methylene blue dye) excluding properties of the outer thin and the thick layer of albumen. A half cm hole was made in the egg shell halfway between the blunt and the sharp pole of the egg shell. Through the hole 0.1 ml of 0.5% methylene blue solution made up in phosphate buffered saline was injected about 1 mm into the outer thin layer of albumen located just under the shell surface. The hole in the egg shell was sealed with Scotch brand magic tape, and the eggs were revolved for 15 seconds at about one revolution per two seconds and were then allowed to rest for 4-6 hours. The eggs were then placed in a freezer at minus 20 degrees centigrade for an overnight period. The frozen eggs were transected through the site of dye injection with the use of a thin knife blade and the blow of a hammer.
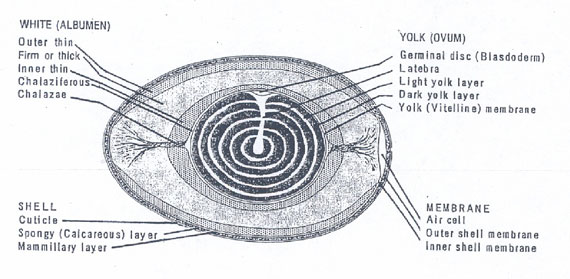
Figure 2: Drawing of a midsagital section of a hen egg. The layers of albumen are indicated. The layers between thin and thick are not known to be separated by membranes but still have distinct boundaries (modified from Kiple and Ornelas 2000).
Blue dye was observed at the site of dye injection but was also observed laterally through the outer layer of thin albumen for a radial distance of about a cm. The blue dye did not move into the underlying thick albumen layer. The blue dye was not detected in the inner layer of thin albumen or in the chalaziferous layer. These findings indicate that the outer thin layer of albumen is solvent to the blue dye and that the thick albumen layer excluded the blue dye. Given difference in the methylene blue properties of the thin and the thick albumen layer, it was decided to attempt a separation of the thick from the thin albumen so that their physical properties could be independently studied and analyzed.
The method used to separate the thick and the thin albumen was to carefully place fresh whole egg white on a plastic filter with a pore size of 2 mm diameter (Fig. 3a). Fig. 3b is a photograph of whole egg white with 5 drops of methylene blue then poured into a 15 cm Petri dish that was positioned over a lined grid paper. Thin albumen dyes blue and thick albumen remained unstained. Thin albumen passed through the pores in about 15 minutes and was collected in an underlying beaker while the thick albumen and the two white chalazae remained on the filter surface. The two white chalazae were then removed with forceps. To further confirm the ability of the filter method to separate thin and thick albumen fractions, methylene blue was added to the whole egg white and then subjected to the filter separation procedure. The results showed that the dyed albumen passed through the filter and that the thick albumen remained almost colorless (Fig. 4).
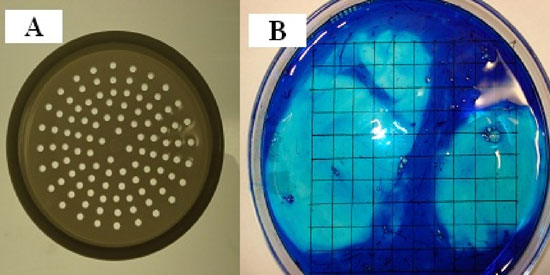
Figure 3: A and B, photographs of a plastic sieve used to separate thin from thick egg white. A, White albumen fractions. B, photograph of whole egg white dyed with five drops omethylene blue then poured into a 15 cm diameter Petri dish positioned over a grid.
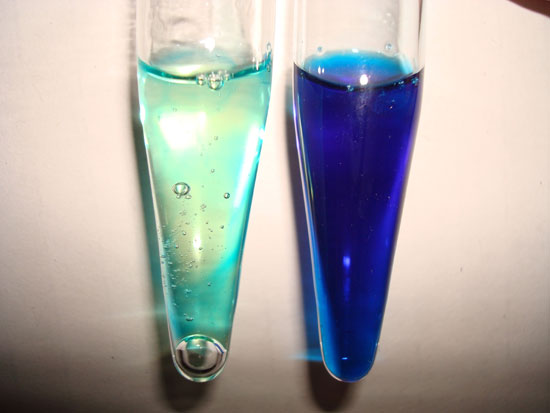
Figure 4: Photographs of thin and thick egg white fractions separated by filtration. Two mls of methylene blue were added to the egg white of a single egg which was then added to the filter surface. The fraction that passed through the filter was dark blue (Fig. 4 right) while the fraction on the filter surface was almost colorless (Fig. 4 left).
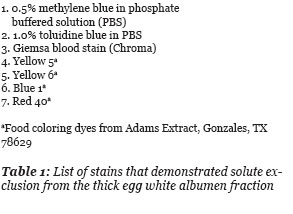
To determine the volume fraction of thin and of thick albumen each of these two separated fractions was poured into a graduate cylinder and the volume measured. A bit less than half of the total egg white volume was found to be thin albumen (46%) while a bit more than half, (54%) of the total egg white volume was thick albumen. The whole white of an egg was exposed to several drops of the various dyes listed in Table 1. All of the listed dyes were selectively excluded by the thick albumen.
The above finding that only about half of the egg white had dye excluding properties has lead to development of another method for assessment of the volume fraction of dye excluding egg white. The test of this method was to add a few drops of dye to whole egg white and then gently mix and pour the egg white from a single egg into a 15 cm diameter Petri dish. The height of the egg white in the Petri dish was about 1.5 mm. The Petri dish was placed over a white sheet of paper with thin black perpendicular grid lines. Counting the number of grid intercept points under the non-dark blue areas over the total number of intercept points allows determination of the volume density fraction of dark blue and non-dark blue areas (Fig. 3B). As shown in Fig. 3B there are two areas lacking the dark-colored dye. When the whole egg white is stirred or agitated, there was an increase in the number of smaller non-blue areas. Repeated use of a Porter-Elvehjem tissue grinder on the dye and the whole egg white resulted in a homogenous blue dye area. The mean volume density fraction of the fresh blue dyed albumen fraction was found to be 50.7 ≥ 2.2% which agrees with the 54% of methylene blue in phosphate buffered saline was added to the top of each sample. Therefore this intercept point counting method was used to determine the dye excluding volume fraction of samples as reported further on in this report.
Physical measures of thick and of thin albumen and of deionized water at 22ºC
Table 2 summarizes data on six physical measures made on thick and on thin albumen fractions in comparison to deionized water. The method used to get each measure and the results are presented in the same order listed in Table 2.
The water content was determined by adding thick or thin albumen or deionized water into a pre-weighed aluminum weighing pan and then weighing. The pans were then placed in a vacuum drying oven at 90ºC. The dry weight remained constant by day six in the oven and the g water/g dry mass was then calculated. No solids were detected in the deionized water sample. The water content of thick albumen is 24% less than the water content of the thin albumen (Table 2). Thus, the thick albumen is less watery than the thin albumen.
Density of thick and of thin albumen was determined by first measuring their volume in a graduate cylinder then weighing the mass of the volume in pre-weighed aluminum weighing pans. Data in Table 2 indicate that the density of thin albumen to be significantly greater than the density of deionized water and significantly less dense than thick albumen.
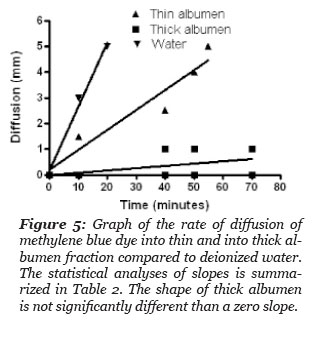
The rate of methylene blue dye diffusion into test samples of: deionized water, thick and thin albumen was done by placing the samples in a tube of uniform diameter, 50 mm. A drop of the dye solution composed of methylene blue buffered saline was added to the top of each sample. The distance the blue dye diffused from the surface top was measured as a function of time. The results are presented in Fig. 5 and the statistical results of the dye diffusion rate in the thin albumen was two times slower than the dye diffusion rate in deionized water (Table 2). Linear regression analysis of the dye diffusion in the thick albumen indicates the dye diffusion did not give a slope value that differed significantly from a diffusion rate of zero. This study indicates that significant diffusion of the dye into the thick albumen did not occur during the course of the study.
Flow rate was measured by use of a glass funnel. The funnel contents exited the funnel through a 170 mm long tube with an inside bore diameter of 3 mm. The tube exit was sealed with Scotch brand magic tape and 20 ml of sample was then added to the funnel. None of the sample entered the exit tube mouth until the tape was removed. The tape was then removed from the funnel tube exit and the time for all of the funnel contents to flow out of the tube was measured with a stop watch. The flow rate of thin albumen was about 3.5 times slower than the flow rate of deionized water. Unexpectedly, the thick albumin did not flow. The thick albumen was made to flow by rotating a 3.5 mm wide spatula at one revolution per second at the mouth of the funnel tube. These findings indicate that thick albumen has the property of a thixotropic gel.
The rate of fall of a 50 μm diameter glass sphere from the top of a 10 cm column of specimen was measured with a stop watch. The results are summarized in Table 2. The fall rate of a 50 μm diameter glass sphere with a density of 2.8 agrees with the flow rate data in Table 2 and provides additional evidence that the fresh non-agitated (non-stirred) albumen acts as a gel. The rate of fall of the glass sphere through the thin albumen was about 3-4 times slower than through deionized water. The glass sphere did not fall through the thick albumen. Although the glass sphere did not fall through the thick albumen a 4 mm diameter lead sphere fell through the thin albumen. Here again thick albumen demonstrates the properties of a thixotropic gel.
The pH of thick and thin albumen fractions and of fresh deionized water were measured with a Beckman pH meter. The pH of thick and thin albumen fractions were both in the alkaline range and were not significantly different. The mean pH of freshly deionized water was 7.36, which was significantly lower than the pH of the thick and the thin albumen fractions (Table 2).
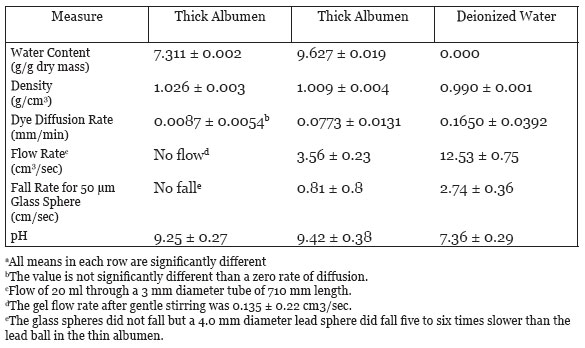
Table 2: Physical measure of thick and of thin albumen and of deionized water at 22oC (mean ± SD)a.
Centrifugal force applied to thick albumen decreases much of its dye excluding properties
It is known that most proteins have a density of 1.4 g/cm3. Given the density of thick albumen is 1.027 g/cm3 (Table 2) it was decided to subject thick albumen to centrifugal force as a means to separate a protein rich denser fraction from a less dense fraction. It was postulated that some of the dye excluding properties of thick albumen would be reduced by the force of centrifugation and a less dense dye solvent fraction of the thick albumen would develop towards the top of the centrifuge tube with time.
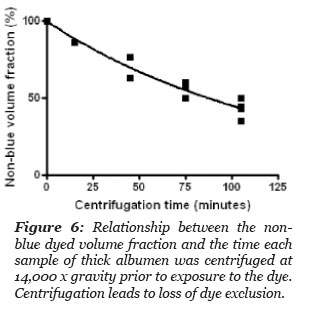
Two cm long stoppered, volume calibrated and marked centrifuge tubes were loaded with thick albumen, placed in a centrifuge and subjected to a centrifugal force of 14,000 x g. At intervals, the centrifuge was stoppered and one or more of the tubes was removed. To the sample tubes removed from the centrifuge was added a drop of methylene blue dye at the top of the tube contents. The total height of the sample in the stoppered tube and the distance the blue dye diffused from the top of the column was measured at 20 hours after the blue dye was added at the top of the sample in the tube. The volume of non-blue dyed sample and the volume of sample that dyed blue, was calculated and the results are summarized in Fig. 6. The volume fraction of non-blue decreased with time of centrifugation.
The data points in Fig. 6 gave a best fit to a one phase exponential decay, r2 = 0.97, with a half life of 89.9 minutes. These results indicate that a large proportion of the blue dye excluding thick albumen was separated from the thick albumen by a centrifugal force of 14,000 x gravity. Clearly much of the blue dye excluding albumen can be forced to become blue dye solvent.
Effect of shear force on dye excluding properties of thick albumen
Thick albumen was allowed to remain on the plastic sieve used to separate thick and thin albumen for 15 minutes. Thick albumen formed protrusions below the sieve bottom (Fig. 7A). The thick albumen was then poured into a dish with methylene blue dye. As illustrated in Fig. 7B, the rim of the thick albumen at the edge of the sieve pores dyed blue. Apparently, the shear force of the protruding drop of the thick albumen was enough to change the dye-excluding state of the thick albumen to a non-dye-excluding state.
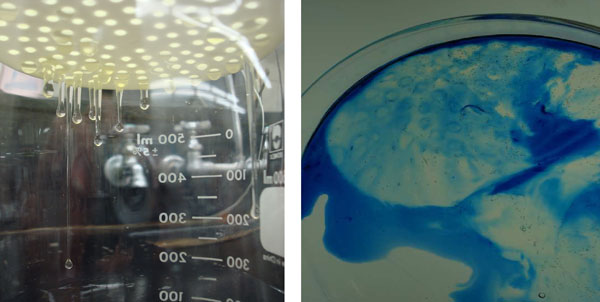
Figure 7: A and B. Photographs of under surfaces of filter and protrusions of thick albumen (A). Effect of shear force on dye uptake at the edge of sieve pore of thick albumen fraction after removal from the filter (B).
Conversion of the thick albumen gel state to a more fluid sol state causes loss of some of the gel’s dye excluding properties
As reported above, the measured volume fractions of thick and of thin albumen agrees with the volume density of methylene blue dyed area when the dye was added to the whole egg white prior to placing in a 15 cm diameter Petri dish. Scoring of the number of non-blue intercept points over the total intercept points in an underlaying grid was the method used for this study. Separated thick albumen excluded most of the methylene blue dye while thin albumen had all of the area dark blue. The thick albumen remained dye excluding when rested without agitation in a covered beaker for 20 or more hours. Data are summarized in Table 3. When thick albumen was made to flow through the funnel with gentle stirring 33% of the area in the Petri dish dyed blue. When thick albumen that had flowed through the funnel once and then returned to the funnel that was then covered tightly with parafilm was allowed to rest without agitation for 20 hours only 23% of the sample area dyed blue but with longer rest periods the percent that dyed blue further decreased to 10% by 72 hours and to 6% by 96 hours. The 96 hour rested sample failed to flow through the funnel giving evidence of gel reformation.
After moderate stirring of thick albumen and after three passes through the funnel 53% of the thick albumen sample dyed blue after adding two drops of the blue dye solution prior to pouring into the Petri dish. After a 20 hour rest the blue dyed fraction decreased to 40% and by 72 hours decreased to 28%.
These results indicate the conversion of the thick albumen gel-like state to a more fluid sol-like state caused loss of some of the gel’s blue dye exclusion properties. The results also indicate that some of the dye excluding properties of the thick albumen are recoverable with time after mechanical agitation.
As noted in the previous section increased mechanical agitation caused an increase in the fraction of thick albumen that dyed blue upon exposure to methylene blue dye. The relationship between flow rate and the percent of thick albumen that dyed blue was therefore measured. A significant positive linear relationship between the fraction of blue dye thick albumen and the flow rate was found (p value 0.003). The greater the agitation of the thick albumen the higher the fraction that dyed blue and the faster the flow rate or decrease in viscosity.
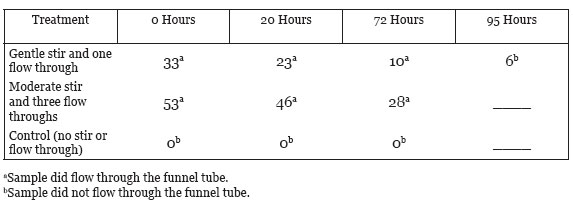
Table 3: Mechanical agitation of thick albumen and percent of blue dye exclusion as a function of time the sample was allowed to remain without further agitation (rest).
The thick albumen gel demonstrates osmotic “like” behavior
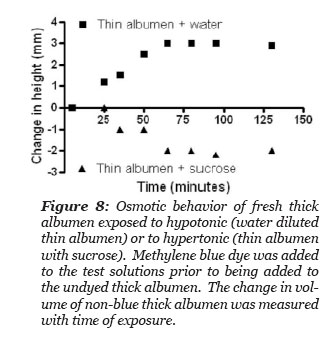
It was hypothesized that the thick albumen gel would increase volume when exposed to a hypotonic methylene blue dye containing solution and would decrease its volume when exposed to a hypertonic dye containing solution. Three methylene blue dye solutions were tested: the first was thin albumen, the second was thin albumen diluted in half with deionized water and the third was thin albumen with sucrose added to give a saturated solution of sucrose in thin albumen. The experiment designed to test the hypothesis was simply to gently layer one of the three blue dye solutions to the top of a volume of thick albumen gel in a graduate cylinder and to measure the height of the undyed region with time after adding the blue solution. The thin albumen that was saturated with sucrose had so high a density that it fell to the bottom of the column of thick albumen. This fraction was subsequently injected to the bottom of the column with a long needle and syringe. Thus, the height of blue dyed and non-blue column could be measured as a function of time. There was not a distinct boundary between the blue and non-blue regions. The measurements reported in Fig. 8 were made where the height of non-blue color could just be detected. The height between blue and non-blue regions became more diffuse as time progressed. Fig. 8 illustrates the experimental results. The total height of the thick albumen and the height of the blue dye bathing solution was measured. The height of the non-blue column increased after exposed to the hypotonic solution and decreased after exposure to the hypertonic sucrose solution and remained unchanged after exposure to the thin albumen. These results demonstrate that thick albumen has osmotic “like” behavior.
Discussion
Dye exclusion mechanisms in thick egg white and in cells
The extent of dye exclusion of the thick albumen can be explained by one or by both of the following mechanisms: 1) formation of at least two layers of water molecules over the surface of the globular proteins that are solute (dye) excluding. 2) formation of cavities of water molecules within the individual globular protein molecules or in spaces between the tightly packet globular proteins that cannot be reached by the vital dye. At this time neither possibility can be excluded as an explanation of the extent of dye exclusion of a vital dye by living cells. Given that these mechanisms are operational in tissue cells, then mechanical agitation (perhaps palpation or other physical perturbations) of a tumor could cause transformation of the gel state to a sol state and allow drug or dye to better diffuse throughout the tumor.
There are at least three possible ways to explain loss of vital dye exclusion upon death of a cell: 1) a failure of membrane exclusion, 2) loss of a key cardinal adsorbent (like ATP) causing loss of a solute (dye) excluding layer of polarized multilayers of water (Ling 2001), 3) change from a solute (dye) excluding gel state to a non-solute dye excluding sol state as demonstrated by thick albumen. Possibility one seemed doubtful as the sole mechanism responsible for solute dye exclusion because detergent or surgical disruption of the plasma membrane of lens fiber cells did not cause loss of dye exclusion (Cameron et al. 1988) and for more examples see Maniotis and Schliwa, 1991 and Pollack, 2001). Possibility two also seems unlikely as loss of the key cardinal adsorbent (ATP) after cell death did not decrease the extent of non-bulk, polarized multilayers of water, to become bulk water as Ling’s association induction theory predicts (Cameron et al. 2007, 2008). Possibility three remains a viable option but there is currently no direct evidence that cell death causes the cytoplasmic gel state that may exclude a vital dye, to change into a non-vital dye excluding sol state. Further studies are underway to understand the dye excluding properties of the thick egg white gel.
Gel-sol-gel phase transformation in thick albumen
The gel-to-sol and back to a gel phase transformation, as observed in thick albumen, has also been observed to occur during amoeboid motion as reported by Mast in 1926 and 1930. Mast reported that cytoplasm flowed as a sol from a region near the rear of the cell forward towards the advancing pseudopod. The rear of the cell and areas under the cell surface, along the length of the cell remained stationary, and were termed the gel state. Thus the gel state at the rear of the cell transformed to a sol state that then flowed forward through the tubular gel cell body towards the advancing pseudopod. As the flowing sol approached the tip of the advancing pseudopod it moved laterally and transformed back to a gel state. When subjected to agitation or increased hydrostatic pressure the thick egg albumen fraction demonstrates a gel to sol phase transformation that resembles the gel to sol transformation observed in the cytoplasm/protoplasm of the amoeba cell during locomotion. However the time needed for transformation of thick albumen sol back to the gel state was much longer than in amoeba.
Conclusions
The hen egg white thick albumen, rich in globular protein, demonstrate the following properties: the ability of the boundary of thick albumen to act as a semi-permeable boundary with solute (vital dye) excluding properties, the ability to demonstrate osmotic-“like” behavior, and the ability to transform from a gel to a sol under the influence of hydrostatic pressure or mechanical agitation. The thick albumen can also transform from a sol state back to a dye excluding gel state similar to the properties of cytoplasm observed in living cells (Pollack 2001).
Acknowledgements
Thanks is given to Anthony Lanctot and James Buchanan for help with photographs and to Professors Gary D. Fullerton and William Phillips for critical review of this report and for helpful discussion on the subject. Thanks is also given to Cathy Bunnell for typing and to Nicholas Short for manuscript preparation.
References
Brooks, SC, Brooks, MM. The permeability of living cells. 1941
Cameron, IL Contreras, E, Fullerton, GD, Kellermayer, M, Ludany, A, Misetta, A. Extent and properties of nonbulk “bound” water in crystalline lens cells. J. Cell. Physiol. 1988. 137:125-132.
Cameron, IL and Fullerton, GD. Interfacial water compartments on tendon/collagen and in cells. 2008. Phase Transition in Cell Biology, ed. Pollack, G, Chin, WC, Springer, Dordrecht, The Netherlands. 2008, p. 43-50.
Cameron, IL and Fullerton GD. Non-bulk like water on cellular interfaces. Water and the Cell. Eds. Pollack, GH, Cameron, IL, and Wheatley, DN, Springer, Dordrecht, The Netherlands. 2006. 315-323.
Cameron, IL, Kanal, KM, Keener, CR, Fullerton, GD. A mechanistic view of non-ideal osmotic and motional behavior of intracellular water. Cell Biol. Int. 1997. 21: 99-113.
Cameron, IL, Short, NJ, Fullerton, GD. A simple centrifugal dehydration force method to characterize water compartments in fresh and post-mortem fish muscle. Cell Biol.Int. 2007. 31: 516-520.
Cameron, IL, Short, NJ, Fullerton, GD. Characteristics of multiple water of hydration fractions in rabbit skeletal muscle with age and time post-mortem by centrifugal dehydration force and rehydration methods. Cell Biol. Int. 2008. 32:1337-1343.
Chen, YW., Lin, JS, et al. Application of in-vivo stain of methylene blue as a diagnostic aid in the early detection and screening of oral squamous cell carcinoma and precancerous lesions. J. Clin. Med. Assoc. 2007. 70:497-503.
Fullerton, GD and Cameron, IL. Water compartments in cells. Methods in Enzymology. 2007. 428:2-26.
Fullerton, GD, Kanal, KM, Cameron, IL. Osmotically unresponsive water fraction on proteins: Non-ideal osmotic pressure of bovine serum albumin as a function of pH and salt concentration. Cell Biol. Int. 2006. 30:86-92.
Gordon, DL, Airan, MC, Swanick, S,. Visual identification of insulinoma using methylene blue. Brit. J. Surgery. 2007. 61:363-364.
Harris, JE, Peters, A. Experiments on vital staining with methylene blue. Quarterly J. of Microscopical Science. 1953. 94:113-124.
Kiple, KF, Ornelas, KC. The Cambridge World History of Food 2000. Cambridge Univ. Press, Cambride. P 503.
Ling, GN. Life at the Cell and Below Cell Level., 2001 Pacific Press, N.Y.
Maniotis, A, Schliwa, M. Microsurgical removal of centrosomes blocks cell reproduction and centriole generation in BSC-1 cells. Cell. 1991. 495-504.
Marconi, G, Quintian , R. Methylene blue dye of cellular nuclei during salpingoscopy, a new in-vivo method to evaluate vitality of tubal epithelium. Human Repro. 1998. 13:3414-3417.
Mast, SO. Structure, movement, locomotion and stimulation in amoeba. J. Morphol. 926. 41:347-425.
Mast, SO. Locomotion in Amoeba proteous (Leidy) Protoplasma. 1931. 14:321-330.
Upile T., Fisher, C., et al. Recent technology developments: in situ histopathology interrogation of surgical tissue and resected margins get nuclear dye positive. Head and Face Med 2007. 3:13-26.
Pollack, GH. Cells, Gels and the Engines of Life. 2001, Enner & Sons, Seattle.
Upile, T, Fisher, C, et al. Recent technological developments: in situ histopathological interrogation of surgical tissue and resected margins get nuclear dye positive. Head and Face Med. 2007. 3:1-26.
Figure Legends
Figure 1: Photographs illustrating vital dye exclusion from decapsulated pig lens treated with membrane disruptive detergents. The round-shaped specimens are decapsulated lens. Above and to the right of each lens is the removed capsule of that lens, and above and to the left is a piece of the sclera. The letters “H” and “S” refer to the bathing solutions used. H” = Hanks and “S” = isotonic sucrose). The letters “B” and “T” refer to cell membrane disruptive detergents (“B” = brig 58 and “T” = triton x 100). The letter “C” refers to the unstrained control. Specimens in A (top paragraph), except the unstained controls were exposed to 0.1% nigrosin. Specimens in B (middle photograph was exposed to 0.1% trypan blue, and in C (bottom photograph, were exposed to 0.1% methylene blue. After one hour in the dye solutions, the intact lenses were removed and their stained capsule removed. The lens body (less the capsules) was returned to the dye solution for 2 additional hours, then removed and placed on a glass plate along with its lens capsule and a piece of sclera. As shown here, none of the treatments resulted in dye uptake or staining of the lens body, whereas all of the lens capsule and sclera specimens took up the dye. Figure reproduced from Cameron et al. 1988 with permission of John Wiley and Sons, Inc.
Figure 3, A and B: A, photographs of a plastic sieve used to separate thin from thick egg white albumen fractions. B, photograph of whole egg white dyed with five drops of methylene blue then poured into a 15 cm diameter Petri dish that is positioned over a lined grid paper.
Figure 4: Photographs of thin and thick egg white fractions separated by sieve filtrations. Two mls of methylene blue were added to the egg white of a single egg which was then added to the filter surface. The fraction that passed through the filter was dark blue (Fig. 4 right) while the fraction on the filter surface was almost colorless (Fig. 4 left).
Figure 5: Graph of the rate of diffusion of methylene blue into thin and thick albumen fraction compared to deionized water. The statistical analysis of slopes is summarized in Table 2. The slope of thick albumen is not significantly different than a zero slope.
Figure 6: Relationship between the non-blue dyed volume fraction and the time each sample of thick albumen was centrifuged at 14,000 x gravity prior to exposure to the dye. Centrifugation leads to loss of dye exclusion.
Figure 7, A and B: Photographs of under surfaces of filter and protrusions of thick albumen (A). Effect of shear force on dye uptake at the edge of sieve pore of thick albumen fraction after removal from the filter (B).
Figure 8: Relationship between the percent of thick albumen that dyed blue and the flow rate of the thick albumen when the albumen was agitated to different extents by stirring. Statistical analysis reveals a significant linear relationship
Figure 9: Behavior of fresh thick albumen exposed to hypotonic (water diluted thin albumen) or to hypertonic (thin albumen saturated with sucrose). Methylene blue dye was added to the test solutions prior to being added to the undyed thick albumen. The change in volume of non-blue thick albumen was measured with time of exposure.
Discussion With Reviewers
Mae Wan Ho1: Do you see any relationship between the dye exclusion in the gel fraction of albumen to the exclusion zone Pollack et al. have identified in water organized next to hydrophilic surfaces?
Ivan Cameron: The likelihood that multilayers of water on hydrophilic surfaces, as shown by Pollack et al., can exclude solutes in an established fact. Thus it seems likely that the same mechanism operates in the fresh thick hen egg white gel. Another possible mechanism for dye exclusion in the egg white gel is formation of cavities of water molecules within protein molecules or in spaces between lightly packed and/or cross linked proteins that cannot be reached by the dye (“cavity water” see Fullerton and Cameron 2007).
Ho: Do you see the egg albumen picture of gel and sol representative of cytoplasm in general?
Cameron: Yes in that both do transform from get to sol and back to gel states but no in regard to speed of conversion between states, i.e. in amoeba conversion from sol to gel is almost instantaneous but in the thick hen egg white albumen the conversion from sol to gel took days (see Table 3 in text).
Ho: Do you see the egg albumen picture of gel and sol representative of cytoplasm in general?
Cameron: Yes I do in that both cytoplasm and thick egg albumen undergo gel to sol and back to gel transformation associated with dye exclusion properties as also seen in vivo by Kite and Lepeschkin (cited in Ling 2001). Also data on thick egg gel, as reported in the current report, and data in a recent report by Fels et al. (Biophy. J. 2009 96: 4276-4285) both indicate that the egg albumen gel and that a mammalian cytoplasmic hydrogel are osmotically responsive.
Ho: What do you think are the natural signals for gel to sol transformation in vivo?
Cameron: I refer you to a monography (Phase Transition in cell Biology, Pollack, G.H. and Chin, W-C, 2008, Springer). Possible signals include: ion changes during nerve excitation, stretch (shear-induced fluidization followed by slow resolidification) and perhaps ATP levels.
Ho: Can you say anything regarding density of water associated with the two albumen states?
Cameron: This is an important question but I have only indirect information to address the question. It seems that the proteins in egg albumen have both hydrophilic surface domains with water hydrogen bonding properties (denser water) and hydrophobic surface domains that does not allow direct hydrogen bonding of water molecules. The water over hydrophobic domains is therefore less dense. Thus the amount of dense and less dense water is dependent on the extent of hydrophilic and hydrophobic surface area which can change with extent of protein folding and aggregation (polyme ization).
1 Visiting Professor of Biophysics, Catania University, Sicily