
![]()
Microstructure of Water Sediments on Hydrophilic Surfaces
Yakhno TA, Sanin AG, Yakhno VG
Federal Research Center Institute of Applied Physics of the Russian Academy of Sciences (IAP RAS),
46 Ulyanov Street, Nizhny Novgorod 603950, Russia
Correspondence: yakhta13@gmail.com
Keywords: NMR; Raman Spectroscopy; Hydrogen bond; Water; Amyloid; Meditation
Submitted: December 7, 2022
Reviewed: February 12, 2023
Accepted: March 20, 2023
Published: May 8, 2023
Abstract
In the modern world, the focus of natural science research thought has shifted mainly to the molecular level, including the study of water. Water is considered as a mixture of interacting H2O molecules and their clusters based on the data of molecular dynamics, neutron, and X-ray scattering. In this case, a huge layer of information is lost related to the composition of real water, its microstructure and behavior. The aim of our study was to follow the phase transformations of hydrated liquid crystal water during the evaporation of free water using optical microscopy. We observed a panoramic picture of a cascade of interrelated phase transitions of distilled water and its microdispersed phase — sodium chloride (NaCl) microcrystals surrounded by a thick layer of hydrated liquid crystal water. Incubation of a glass slide in water for two days was accompanied by adhesion of the microdispersed phase to the glass surface. During the free evaporation of distilled water from a Petri dish, erosion of hydration shells, dissolution of NaCl microcrystals, and further recrystallization with the formation of large monolithic crystals and traces of non-drying water were observed. However, there are still questions that do not yet have clear answers. This work is intended to supplement our knowledge in the field of phase transitions of water during its evaporation from hydrophilic surfaces, which can be of not only theoretical, but also practical importance in, for example, the operation of water supply networks and water purification systems.
Introduction
The interaction of water with surfaces is the most important problem of physical chemistry underlying the development of animate and inanimate nature (Shvartsev, 2014). Despite the close attention of scientists to this topic and a number of undoubted discoveries in this area over the past decades, the scientific community is far from unanimous in interpreting the effects observed in the zone of water-surface contacts (Pollack, 2013; Elton et al., 2020; Schurr, 2013; Esplandiu et al., 2020; Yakhno and Yakhno, 2018). Therefore, the study of the microstructure of aqueous sediments on the surface in contact with water after the evaporation of free water, as well as the evolution of these sediments during drying in air, can clarify their origin and composition (Yakhno and Yakhno, 2019a; Yakhno and Yakhno, 2019b). In the framework of this work, we studied the microstructure of the precipitate formed on a glass slide after its incubation in a glass of water (distilled or tap water) at room temperature for two days and subsequent drying of this precipitate in air. In another experiment, we expected that the evaporation of water poured into Petri dishes to a 5 mm thick layer with a turned off thermostat would protect them from room dust. After the formation of sediment at the bottom, we also observed its changes within two weeks.
Previously, the opinion was expressed (Sedlmeier et al., 2008) that “the adsorption of dissolved substances at the interfaces is due to direct interactions of the dissolved substance with the surface and solvation forces. These solvation forces are closely related to the structure of water in the interfacial region and are therefore determined by complex interactions in multidimensional space.” In the conclusion of their article (Sedlmeier et al., 2008), the authors stated: “attempts to analytically describe the solvation forces at the interfaces are difficult and cannot be achieved in a predictive way.” According to modern concepts (Pollack, 2013), upon contact with hydrophilic surfaces, water forms a liquid-crystal near-wall layer up to 0.5 mm wide, as a result of which all dissolved substances and insoluble impurities are displaced from this “exclusion zone” (EZ) (Pollack, 2013). At the same time, due to the special supramolecular structure of near-wall water, EZ acquires a negative charge at the boundary with free water. Thus, in one glass under room conditions, two phases of water coexist — free and liquid crystal. It is shown that the distinguishing feature of liquid crystal water is its high electrical sensitivity (Tychinsky, 2011) and higher refractive index (Kozlov et al., 2013) than that of ordinary water. In their paper, Ostroverkhov et al., (2005), used a new phase-sensitive method to obtain an unprecedentedly detailed structure of the water/quartz interface. In their opinion, interfacial water molecules form a network of hydrogen bonds with mixed regions of ordered and disordered structures. Those located in ordered (disordered) regions, giving an ice-like (liquid-like) peak in the spectra, are closely associated with surface regions that have a higher (lower) pK value for deprotonation. According to cryogenic scanning electron microscopy, EZ water has a heterogeneous structure similar to a sponge, where high-density water forms walls, between which there is low-density water (Hwang et al., 2018). Hydrophilic microimpurities, that get into the water, also acquire hydrate shells (EZ). It is assumed that the interaction of such microparticles with each other and with near-wall water is carried out according to the “Like likes like” mechanism (Ise, 2010), i.e., through ions of the opposite sign (+) accumulating near EZ, which carries a negative charge (Pollack, 2013). Previously, we showed that real water in the real world always contains microimpurities, which are its integral part (Yakhno et al., 2019; Yakhno and Yakhno. 2019; Yakhno and Yakhno, 2021). In this work, we intend to follow the fate of microimpurities during the formation of a deposit on the glass surface and their transformations during the evaporation of free water. The study of water precipitation is used to assess the degree of water pollution (Annan et al., 2018). The development of modern biotechnologies is based on the knowledge and competent use of the features of the interaction of phases with hydrophilic and hydrophobic properties in one volume. For example, this knowledge has made it possible to develop highly efficient encapsulation of drugs and the formation of fine particles of submicron size (Toorisaka et al., 2018). With the development of automatic methods for quantifying the composition of precipitation, this inexpensive and informative method can be used to monitor water quality in various technological chains.
Materials and Methods
The work used distilled water GOST 6709-72 (pH 6,6; specific conductivity 5 μS/cm), distilled water “Water for injections” (manufacturer: Deko Company (Russia), LS-000512), as well as tap water (pH 7,2; specific conductivity 550 μS/cm).
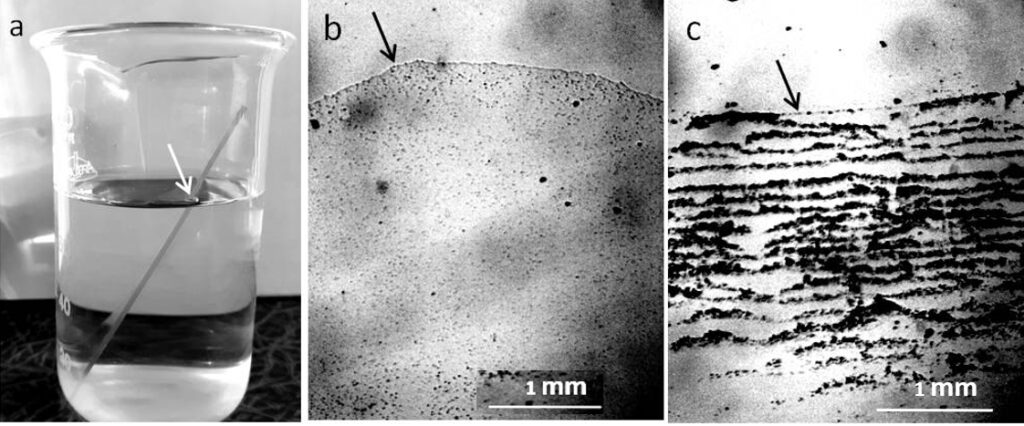
New ApexLab microscope slides (25.4 x 76.2 mm, 1 mm – 1.2 mm thick) and new Petri dishes (Russia) were washed in tap water and rinsed thoroughly in distilled water to remove possible mechanical impurities. After drying the glasses in a vertical position on the table, they were used for experiments: they were immersed in a glass of water and left there for two days at room conditions: T = 23 – 25°C and H = 70 – 72%. After that, the slides were removed from the beakers and placed in a horizontal position on filter paper to evaporate free water (Fig.1). In the second series of experiments, water was poured into washed Petri dishes in a layer 5 mm thick and left in a switched off thermostat until free water completely evaporated (three days). The studies of dry sediments were performed under a Levenhuk microscope with a video camera coupled to a computer using the ToupView program without the use of a cover glass.
Results and Discussion
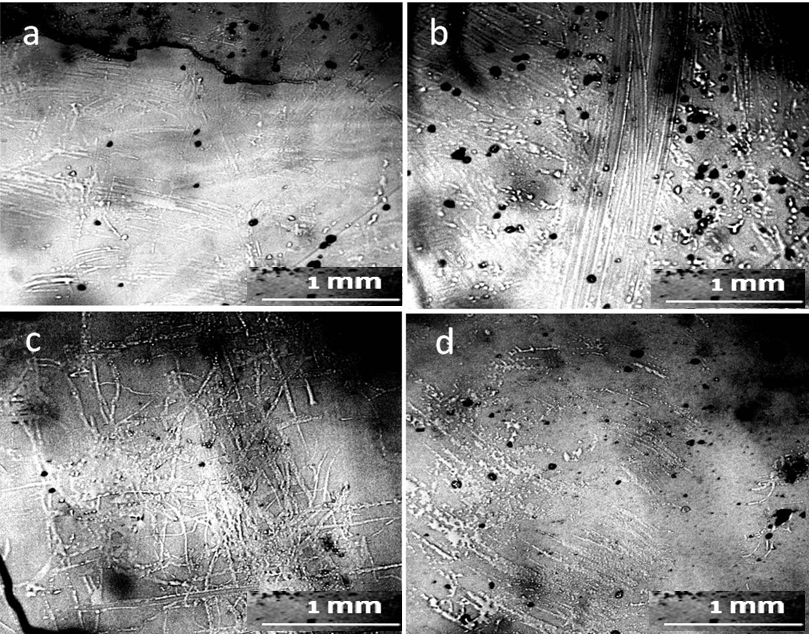
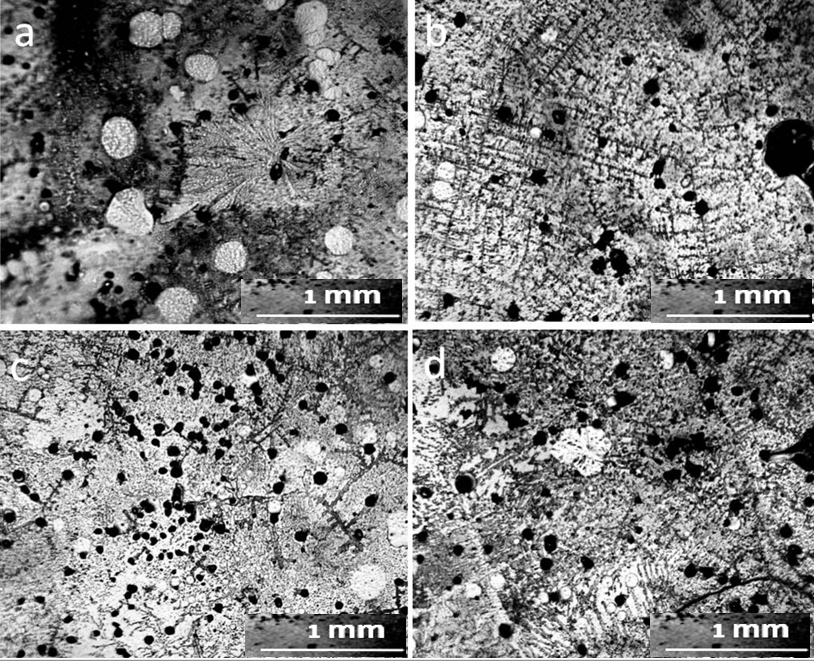
As can be seen in the photographs, the deposits on the glass slide (Fig.1b) after its contact with distilled water are an even layer of densely packed rounded structures with a dark dot in the center, which we previously called the dispersed phase of water (DP) (Yakhno and Yakhno, 2019a; Yakhno and Yakhno, 2019b; Yakhno and Yakhno, 2022). We believe that the DP unit is formed by a hydrophilic microparticle (NaCl micro-crystal) covered with a thick layer of hydrate liquid crystal water (EZ). The upper part of the glass incubated in tap water (Fig.1c) is covered with bands of deposits of coarse microimpurities, reflecting the decreasing level of evaporating water. The deposition of DP aggregates in the middle part of the glasses can be multilayered (Fig.2). In sediments of distilled water after drying them in air, there were different-scale fragments of network structures, the optical density of which was higher than the background (DP of water), and the cell sizes ranged from tens to hundreds of micrometers (Fig. 3). On the one hand, cryogenic scanning electron microscopy suggests that EZ consists of high-density water with a cell-like wall structure (Hwang et al., 2018). The paper reports that water has a heterogeneous structure consisting of water of high and low density. Using cryogenic scanning electron microscopy, the authors demonstrated the presence of a cellular structure where high-density water exists as walls. Between them is ordinary water with a low density. From the measurement of electric charge separation, it was understood that the source of high-density water is EZ.
The proposed model can adequately explain the anomalous properties, especially the electrical properties of water. As the size of the unit cell decreases, the “degree of structuredness” increases, which leads to an increase in the charging capacity of structured water due to an increase in the total interface area. At the same time, due to the separation of electrons, the redox potential and antioxidant property increase (Hwang et al., 2018). The size of the cells presented in this work was one to two orders of magnitude smaller than those observed by us with in a light microscope. In the sediment of tap water at the bottom of the Petri dish, there were also mesh structures made of optically dense material (Fig. 4). The cells limited the DP aggregates growing inside them, according to our previous studies (Yakhno and Yakhno, 2019a; Yakhno and Yakhno, 2019b; Yakhno and Yakhno, 2022), sodium chloride crystals (Fig. 5).
Following this (“foamy”) version, we must recall that, according to the literature (Marcelja, 2004), EZ is formed not only at hydrophilic surfaces, but also at the boundary with air. In solution, air bubbles are macroscopic hydrophobic surfaces. It is known that large hydrophobic regions form a thin layer of low-density liquid immediately at the surface. In particular, in Thiel et al., (2020), the authors of that study observed an increase in the areas of hexagonal packing as the level of solid particles in the droplets, and hence the elasticity, decreases. The layer can be associated with instability and rupture of a thin liquid film between the bubbles (Huang et al., 2002). Numerous studies have established that NaCl ions prevent bubble coalescence (Jungwirth and Tobias, 2006; Craig et al., 1993a; Craig et al., 1993b; Weissenborn and Pugh, 1995; Marcelja, 2004; Craig, 2004).
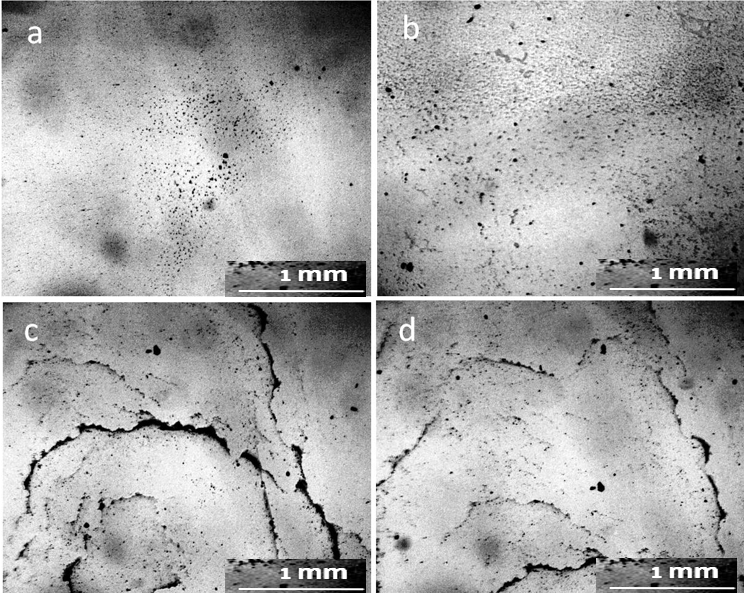
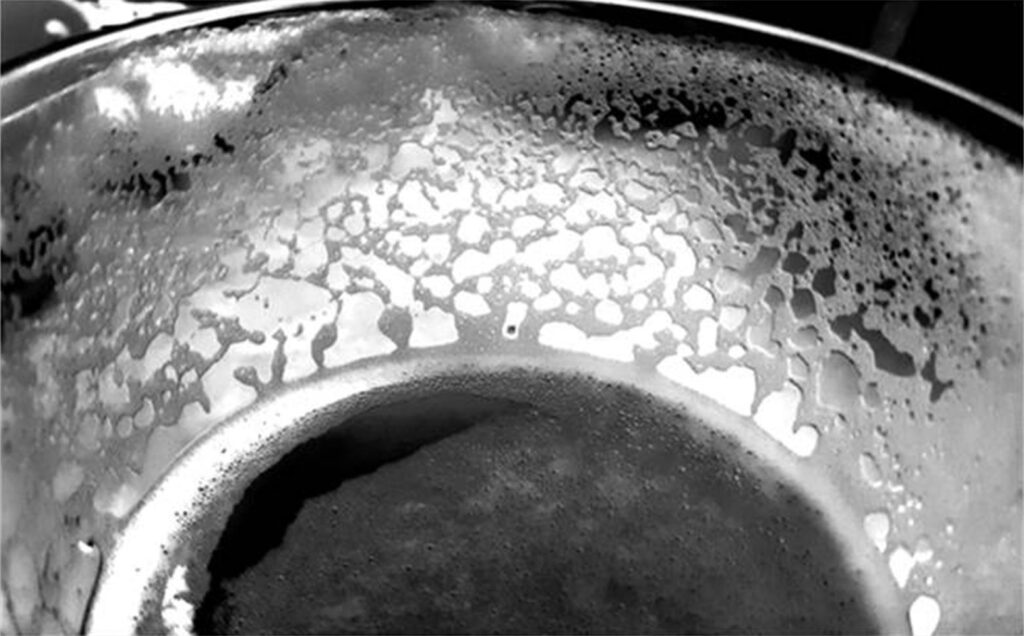
The evaporation of distilled water from the Petri dish was accompanied by a stepwise advance of the drying front (Fig. 6).
Why does a layer of liquid, drying on a flat surface, move in the form of steps rather than moving smoothly? The explanation for this was given by the Soviet physicist, Ya. E. Geguzin, (Geguzin, 1977) using the example of a drying drop of salt solution. Water from the entire surface of the drop evaporates evenly. However, the thickness of the drop along its radius is different: the thickest section is in the center, and the thinnest is along the periphery. As moisture evaporates, the concentration of dissolved salts will increase, and crystals will begin to fall out first of all where the excess salt concentration is greatest. This will be in the thinnest part of the drop – along its perimeter. This is where the salt first turns into a solid state. The remaining liquid wets the precipitated crystals, sticking to them. The volume of the drop decreases with time, but the area of its base remains unchanged. At a certain moment, the water film breaks, and the remaining part of the liquid shifts sharply to a new place — inside the drop, taking on a new equilibrium shape. Further, similar processes continue, and as a result, concentric circles are formed inside the drop until all the water has evaporated. We believe that it is this mechanism that underlies the jump-like advancement of the structurization front in our experiment (Fig 6). The mechanism of deposit formation at the three-phase boundary of drying drops based on the Marangoni flow is also described in Deegan et al., (2000). Thus, Figure 6 clearly shows that real distilled water is not a “pure liquid” but a microdispersion.
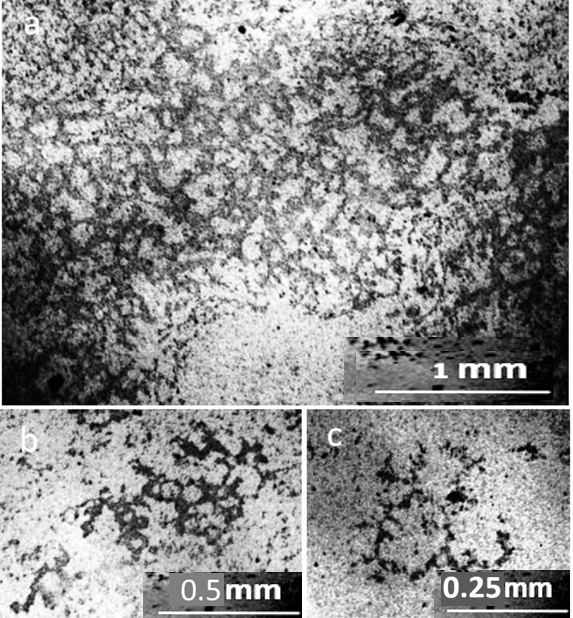
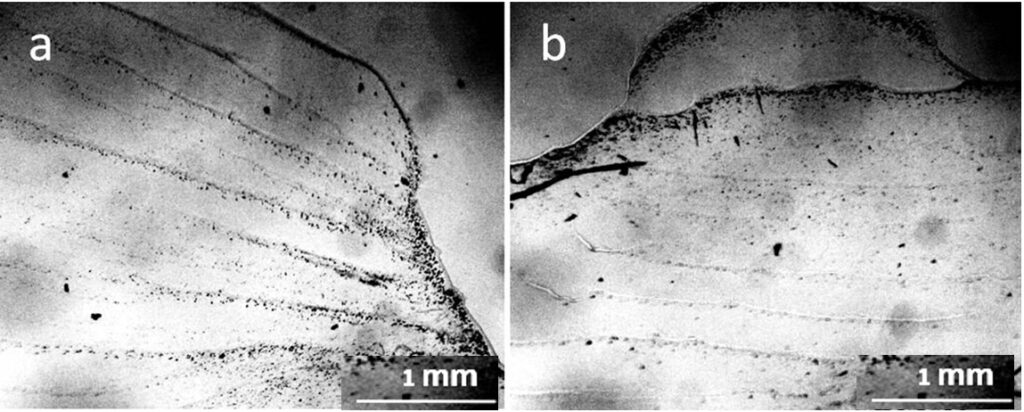
Let us consider the dynamics of phase transitions of distilled water components in accordance with the obtained data. This object is a system that consists of distilled water, freed from most salts, and a microdispersed phase consisting of NaCl microcrystals surrounded by a thick layer of hydrated liquid crystal water (EZ) (Yakhno and Yakhno, 2019a; Yakhno et al., 2019). Hydrated water has no solvent power, so the system is stable in the absence of evaporation. Evaporation is accompanied by an increase in the concentration of salt dissolved in the liquid phase, and, consequently, the osmotic pressure. Upon reaching a certain threshold of osmotic pressure, the hydration shells of DP begin to “melt” (Yakhno et al., 2019). The liberated salt microcrystals get the opportunity for further growth and “Ostwald maturation.” Figure 7 shows a fragment of the DP sediment of distilled water at the bottom of the Petri dish at different depths of focus of the objective. The microcrystals of NaCl protrude from the hydration shells that are under destruction. In the immediate vicinity, large NaCl crystals are visible. The same large crystals can also be observed at the bottom of the Petri dish far from the sediments of DP water (Fig. 8). There is no doubt that these crystals were absent at the beginning of our experiment. Following the logic of our observations, the crystals were formed during the experiment due to the evaporation of free water. With increasing NaCl concentrations, the dissolved Na+ and Cl- ions tend to be aggregated in solutions. The formation of solute aggregate lowers the barrier height of nucleation and affects the nucleation mechanism of NaCl crystals in water (Sun et al., 2020).
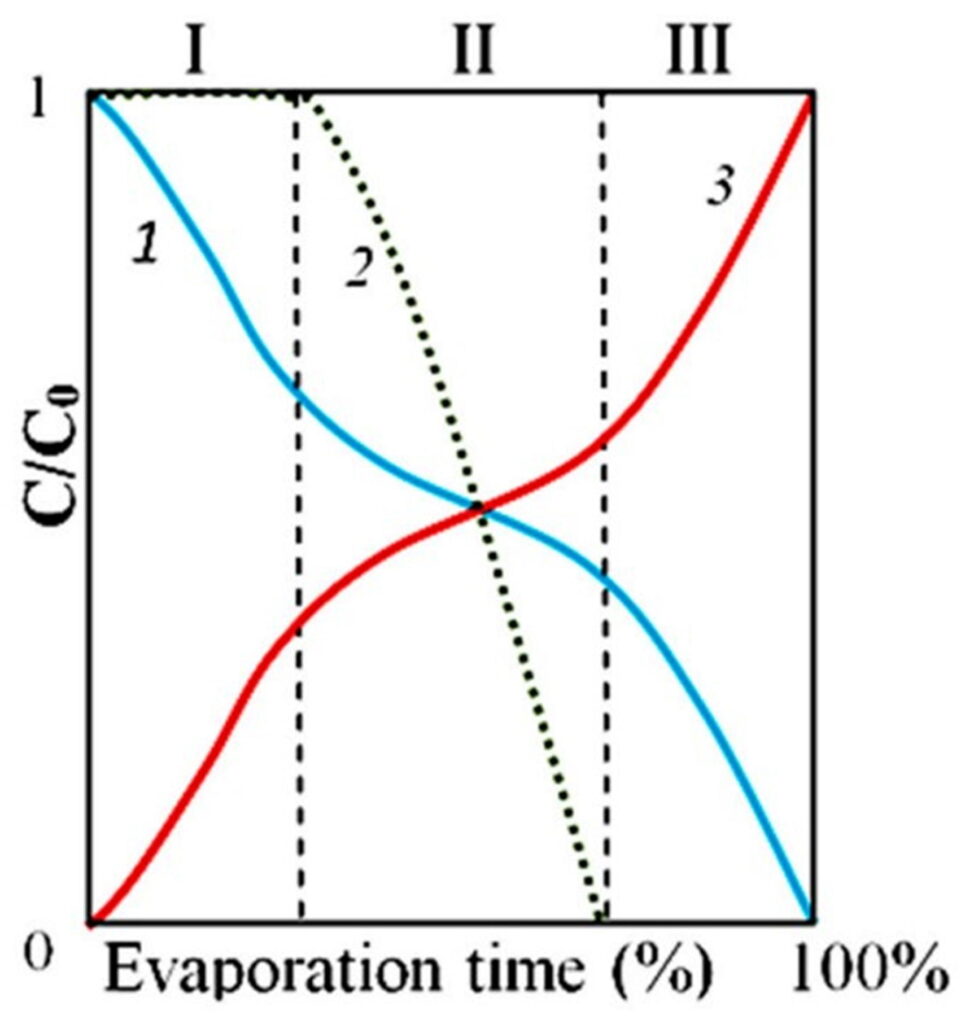
To illustrate the complex processes of phase transitions in distilled water drying on a glass surface, we consider it appropriate to present a diagram from our previous publication (Yakhno et al., 2019). Our new results are consistent with previous ones.
One more interesting fact attracts attention – the presence of non-drying water in the preparations even 2 weeks after the evaporation of distilled water (Fig. 9). Solutions of salts in water can be considered as solutions of hydrated ion complexes. It is shown that “the concentration dependence of the verified solvent activity coefficient has the form of a discontinuous function; moreover, the discontinuity point corresponds to the complete solvation limit (CSL). The increase in the activity coefficient after CSL is determined by the dehydration of the stoichiometric mixture of ions, the transition of the solvent from the inner sphere into the volume of the solution for the subsequent solvation of additional portions of the electrolyte” (Afanasiev and Zaitsev, 2006; Afanasiev, 2013). A similar view on the dynamics of concentrated salt solutions was also expressed in the monograph (Voronina and Zelinskaya, 2009, Chapter 2.2). The presence of a non-evaporating liquid may be due to the fact that this liquid has reached the CSL, and there is practically no free water in it (Fig. 9).
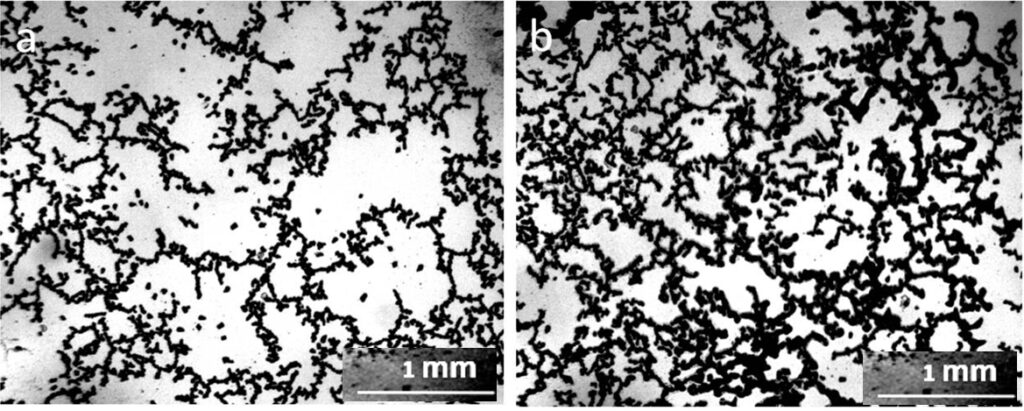
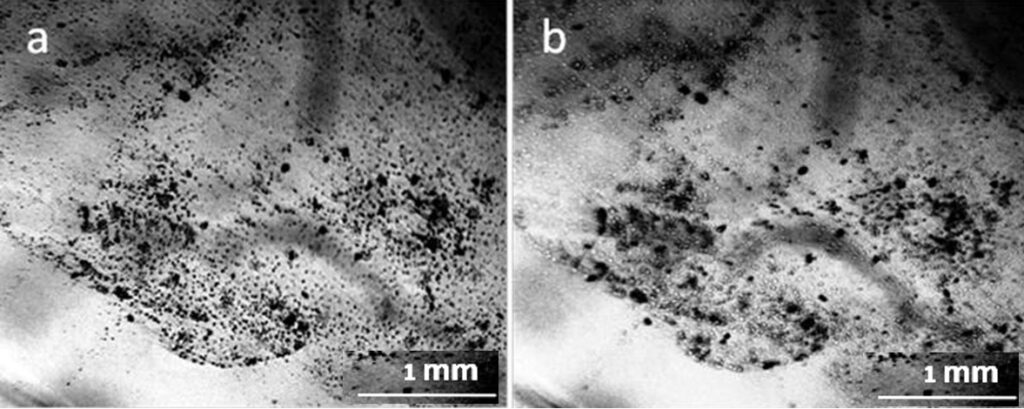
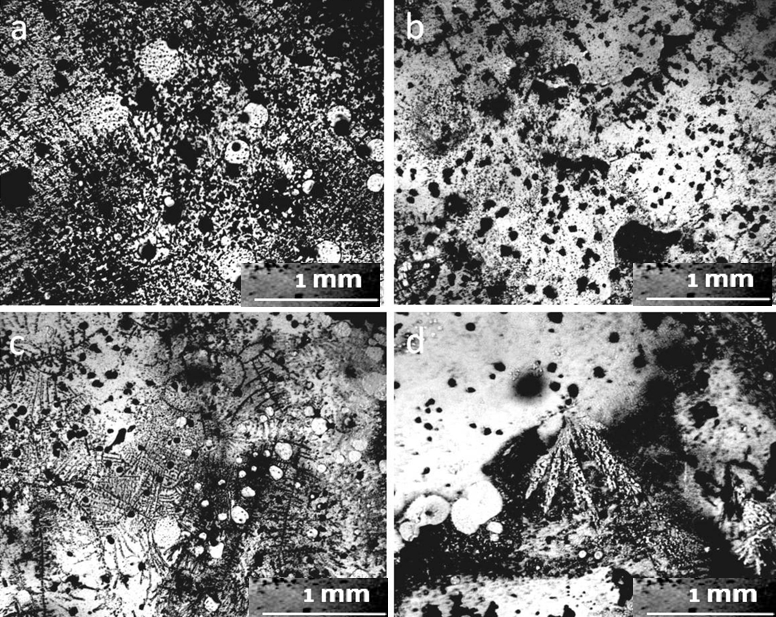
No traces of non-drying water could be found in the sediment after the evaporation of tap water. The entire field of view was occupied by crystalline structures, both of fractals, and in the form of monolithic NaCl crystals. (Fig.10). Two weeks later, the structure of the sediment changed (Fig. 11): individual small DP aggregates became even smaller and acquired visible signs of erosion (Fig.11, a, c). Large NaCl crystals formed on a number of such aggregates. The surface of large DP aggregates (Fig. 11, b, d) was covered with the same crystals. In general, it can be argued that during this time the process of DP destruction and crystal growth continued.
Slow structuring of aqueous solutions may be a consequence of the “drop” structure of associated liquids, such as water, the cooperative nature of H-bonds in “drops” of the intrinsic structure of water and associates of solvates of substances dissolved in it (Lagodzinskaya et al., 2018).
The study showed that optical microscopy is an accessible, inexpensive, and informative tool for studying dynamic processes in liquid media. This approach opens up a panoramic picture of interrelated phase transitions, which is difficult to obtain using separate “point” research methods designed to clarify the details and molecular mechanisms of the observed phenomena. It is important that the stimulus that “starts” all these dynamics is the natural process of evaporation under room conditions. However, without knowledge of the molecular mechanisms of the observed processes, it is impossible to assess the cause-and-effect relationships that lead to changes at the macro level.
This work confirmed our earlier observations (Yakhno and Yakhno, 2019a; Yakhno et al., 2019) and expanded them by revealing non-drying water at the end of the evaporation of distilled water. Based on the data obtained, we built our own picture of the observed processes. However, unresolved questions remain regarding the presence of NaCl in distilled water (Yakhno and Yakhno, 2019a; Yakhno et al., 2019). We hope that this will be the subject of further research by authors interested in this topic. First of all, we would like to clarify our assumptions and detail the morphological structure of the elements of the dispersed phase using atomic force microscopy. As for its practical use, we plan to move on to quantitative studies of the content of certain structures in water sediments based on training neural networks during image processing for automatically assessing its quality. We hope that this inexpensive and informative method can be used for quality control in the operation of water supply networks and water treatment systems.
Supplementary Materials
The following supporting information can be downloaded at:
Microstructure of tap water sediments on hydrophilic surfaces. pdf https://disk.yandex.ru/i/uQz0YUOIq5HIOg ; Microstructure of distilled water sediments on hydrophilic surfaces. pdf https://disk.yandex.ru/i/RMReWkX888aDlA
References
Afanasiev VN (2013). Quantitative evaluation of the discontinuous function of the solvent in aqueous solutions of electrolytes. J Struct Chem 54(1): 82-94.
Afanasiev VN, Zaitsev AA (2006). Features of the structural state of the solvent in electrolyte solutions. J Struct Chem 47: Appendix S94 – S101. UDC 541.8:532.12.
Annan S, Sanful P, Lartey-Young G and Yandam R (2018) Spatial and temporal patterns of variation in environmental quality of water and sediments of streams in mined and unmined areas with emphasis on mercury (Hg) and arsenic (As). GEP 6:125-140.
Craig VSJ (2004). Bubble coalescence and specific-ion effects. Curr Opin Colloid Interface Sci 1-2: 178 -184
Craig VSJ, Ninham BW, Pashley RM (1993)a. Effect of electrolytes on bubble coalescence. Nature 364:317 – 319.
Craig VSJ, Ninham BW, Pashley RMJ (1993b). The effect of electrolytes on bubble coalescence in water. J Phys Chem 97: 2, 10192 – 10197.
Deegan RD, Bakajin O, Dupont TF, Huber G, Nagel SR, Witten TA (2000). Contact line deposits in an evaporating drop. Phys Rev E 62: 756 -765.
Elton DC, Spencer PD, Riches JD, Williams ED (2020). Exclusion Zone phenomena in water – a critical review of experimental findings and theories. Int J Mol Sci 21(14): 5041.
Esplandiu MJ, Reguera D, Fraxedas J (2020). Electrophoretic origin of long-range repulsion of colloids near water/Nafion interfaces. Soft Matter 16:3717-372.
Geguzin,Ya. E (1977). Kaplya. (Drop). (2nd revised Edn.) Moscow: Nauka, 253 p.
Huang DM, Chandler DJ (2002). The hydrophobic effect and the influence of solute–solvent attractions. J Phys Chem B 106: 2047 –2053.
Hwang SG, Hong JK, Sharma A, Pollack GH, Bahng, G (2018). Exclusion zone and heterogeneous water structure at ambient temperature. PLoS ONE 13(4): e0195057.
Ise N (2010). Like likes like: counterion-mediated attraction in macroionic and colloidal interaction. Phys Chem Chem Phys: 10279-10287.
Jungwirth P, Tobias DJ (2006). Specific ion effects at the air/water interface. Chem Rev 106: 1259-1281.
Kozlov V, Bunkin N, Ignatiev PS, Shkirin AV, Zakharov SD, Zinchenko AA (2013). Study of the phase states of water close to Nafion interface. Water 4:129-154.
Lagodzinskaya GV, Laptinskaya TV, Kazakova AI (2018). Supramolecular structuring of aqueous solutions of strong acids: manifestations in light scattering, NMR and oxidation kinetics. “Drop” nature of the liquid? Proceedings of the Academy of Sciences. Chemical series 12: 2212-2223. ISSN 1026-3500.
Marcelja S (2004). Short-range forces in surface and bubble interaction. Curr Opin Colloid Interface Sci 9: 165 -167.
Ostroverkhov V, Waychunas GA, Shen YR (2005). New information on water interfacial structure revealed by phase-sensitive surface spectroscopy. PRL 94: 046102.
Pollack GH (2013). The Fourth Phase of Water: Beyond Solid, Liquid, and Vapor. Ebner and Sons Publishers, 3714 48th Avenue NE Seattle, WA 98105 www.ebnerandsons.com, 353 p.
Schurr JM (2013). Phenomena associated with gel–water interfaces. Analyses and alternatives to the long-range ordered water hypothesis. J Phys Chem B 117: 7653–7674
Sedlmeier F, Janecek J, Sendner C, Bocquet L, Netz R, Horineka D (2008). Water at polar and nonpolar solid walls (Review). Biointerfaces 3: FC23
Shvartsev SL (2014). How are difficulties formed? Bull Russ Acad Sci 84(7): 618–628.
Sun Q, Cui S, Zhang M (2020). Homogeneous nucleation mechanism of NaCl in aqueous solutions. Crystals 10: 107.
Thiel A, Atherton TJ, Patrick T, Spicer PT, Hartela RW (2020). Aggregation in viscoelastic emulsion droplet gels with capillarity-driven rearrangements. Soft Matter 16: 5506-5513.
Toorisaka E, Watanabe K and Hirata M (2018). Development of fine poly(D,L-Lactic-Co-Glycolic acid) particles for hydrophilic drug using a solid-in-oil-in-water emulsion. JEAS 8: 58-66. doi: .
Tychinsky V (2011). High electric susceptibility is the signature of structured water in water-containing objects. Water 3: 95-99. .
Voronina EYu, Zelinskaya EV (2009). Theoretical aspects of the use of hydromineral raw materials. Academy of Natural History, ISBN: 978-5-91327-047-4.
Weissenborn PK, Pugh RJ (1995). Effects of electrolytes on bubble coalescence. Langmuir 11: 1422-1426.
Yakhno T, Drozdov M, Yakhno V (2019). Giant Water Clusters: Where Are They From? Int J Mol Sci 20: 1582; doi:10.3390/ijms20071582.
Yakhno T, Yakhno V (2022). Water as a microdispersed system. Water “activation” mechanism. Water phases at room conditions. Review. Water.
Yakhno T, Yakhno,V (2019)a. A study of structural organization of water and aqueous solutions by means of optical microscopy. Crystals 9(1): 52.
Yakhno TA, Yakhno VG (2018). On the question of the interaction of water with hydrophilic surfaces. Russ J Biol Phys Chem 3(1): 9-18.
Yakhno TA, Yakhno VG (2019)b. Physical and chemical evolution of the dispersed phase of water during its drying. Russ J Biol Phys Chem 4(1): 43-52.
Yakhno TA, Yakhno VG (2021). The mechanism of “activation” of water. Phases of water at room conditions. Water Special Edition: Evidence of water structure.
Discussion with Reviewers
Reviewer: The term “aqueous/water sediments” seems to be used with various meanings in the text. Thus, please clarify or define the meanings of “aqueous/water sediments” in this paper.
Authors: For us, the term “water deposits” includes all those substances that remain at the bottom of the dish after the evaporation of free water.
Reviewer: How do you define and observe non-drying (gel-line) water (Fig. 9)?
Authors: Non-evaporating gel-like water is a common form of residue after the evaporation of distilled water. The photographs in the manuscript show this sediment in its natural state. We assume that these are the remains of the hydrated shells of the “dispersed phase of water” after the evaporation of free water. Now this assumption is being tested using atomic force microscopy.