
![]()
Serious Problems with Saeed & Lee’s “Experimental Determination of Proton-Cation Exchange Equilibrium Constants at Water-Membrane Interface Fundamental to Bioenergetics”
Todd P. Silverstein*
Department of Chemistry (emeritus), Willamette University, Salem, OR 97301
*corresponding author: tsilvers@willamette.edu
Keywords: bioenergetics, water electrolysis; protonic capacitor, transmembrane electrostatically localized protons, surface-localized protons, localized chemiosmosis
Submitted: August 16, 2023
Reviewed: January 5, 2024
Accepted: February 12, 2024
Published: June 9, 2024
Abstract
Saeed and Lee recently published “Experimental Determination of Proton-Cation Exchange Equilibrium Constants at Water-Membrane Interface Fundamental to Bioenergetics,” in the WATER Journal. We show here, using standard thermodynamic calculations, that the equilibrium constants that they reported cannot be correct. Furthermore, we point out serious flaws in their conclusions regarding the experimental electrolysis system: It is highly doubtful that (i) black stains on the aluminum films represent proton-induced “corrosion” and can be used to quantitate surface proton concentration, and (ii) their Teflon® disks support a “protonic capacitor.”
Introduction
In a 2018 paper published in WATER Journal entitled, “Experimental Determination of Proton-Cation Exchange Equilibrium Constants at Water-Membrane Interface Fundamental to Bioenergetics,” (Saeed and Lee, 2018) Saeed and Lee used water electrolysis experiments carried out at various salt concentrations to determine the ion-exchange equilibrium constants for Na+/H+ and K+/H+ exchange at a water/hydrophobic interface. Subsequently, Lee has repeatedly cited this 2018 paper to calculate predicted surface concentrations of cations, concluding that, “We experimentally demonstrated the formation of an electrostatically localized layer of excess protons at a water-membrane interface in biomimetic experiments using an anode water-membrane-water cathode system.” (Lee, 2018)
The main experiments reported in the Saeed and Lee 2018 paper involved electrolyzing water for 10 h at 200 V, with a small 75 µm-thick Teflon® disk (or disks) mounted in the wall(s) separating the anode and cathode chambers. In most of the key experiments, this disk was covered on both sides by 25 µm-thick pieces of aluminum film (= Al-Tf-Al “membrane”) which, according to the authors, served as a “proton-sensing detector.” The dark stains evident in some of the Al film photographs were interpreted by the authors as “corrosion” due to oxidation of Al(s) by protons.
Saeed and Lee reported that during and after the electrolysis, the pH in the bulk solutions remained essentially constant, while Al film “corrosion” indicated proton localization at the surface of the “biomimetic” Al-Tf-Al disk. They interpreted this as demonstration of a “protonic capacitor” system in which the water surface layers on either side of the Al-Tf-Al disk function like capacitor plates: All of the excess H+ from water oxidation at the anode was localized at the “P” surface of the disk, while an equal number of excess OH– from water reduction at the cathode was localized at the “N” surface. Furthermore, Saeed and Lee reported that Na+ and K+ could protect the Al film from “corrosion” in a concentration-dependent manner. From these observations, they calculated ion-exchange equilibrium constants of (5.07 ± 0.46) x 10-8 for Na+ displacing H+ from the disk surface layer, and (6.93 ± 0.91) x 10-8 for K+ displacing H+.
Because Lee has cited this paper widely as strong support for his “Transmembrane Electrostatically Localized Protons” (TELP) hypothesis, we feel that it is important to carefully examine the results and conclusions published in the Saeed and Lee 2018 paper. We show here that, in addition to nearly a dozen smaller errors (Supporting Information, Section I), four major conclusions in this paper are unproven or in doubt: (I) The dark stains on the Al film, interpreted as proton-induced “corrosion” are chemically unidentified, and are seen above pH 8.7 (in control experiments in the absence of electrolysis). Hence, they may have nothing to do with proton-sensing. (II) The ion exchange equilibrium constant values are wrong by several orders of magnitude. (III) The water electrolysis system is not “biomimetic,” and the expectation that this aqueous Al-Tf-Al disk system behaves like a capacitor-containing electrical circuit seems unlikely. And (IV) Saeed and Lee’s rejection of the alternative barrier models for proton surface localization is unfounded. This analysis is an expansion of preliminary calculations that were first reported in the Appendix of ref. (Silverstein, 2023)
Results and Discussion
Aluminum Film “Corrosion”
The linchpin of Saeed and Lee’s experimental results and interpretation is their conclusion that the dark “corrosion” stains on the Al films of the Al-Tf-Al disks separating the anode and cathode chambers were a sign of proton-induced oxidation. Their implicit assumption was that the amount of stain was proportional to the proton concentration in the water layer adjacent to the disk surface. For example, they wrote: “The proton-sensing detection employed here was in the form of Al surface corrosion [Equations 5 and 6] when the effective proton concentration was above 0.1 mM….” Their Equations 5 and 6 are presented below as my Equations 1 and 2, which describe the breakdown of the aluminum oxide surface coating layer (Equation 1), followed by oxidation of the uncovered metallic aluminum (Equation 2).
Equation 1: Al2O3(s) + 6 H+(localized) → 2 Al3+(aq) + 3 H2O(l)
In these equations, “H+(localized)” presumably symbolizes protons localized in the water layer at the P (anodic) surface of the Al-Tf-Al disk. The authors cited previous measurements (Saeed and Lee, 2015) in which they determined that the pH at the surface of the Tf-Al-Tf disk was 2.92. (We show in Section I-I of the Supporting Information that there may be problems with this surface pH determination.) Degradation of the aluminum oxide coating (Equation 1) uncovers the metallic aluminum underneath, which can then be oxidized by H+ (Equation 2):
Equation 2: 2 Al(s) + 6 H+(localized) + 6 OH–(aq) → 2 Al(OH)3(s) + 3 H2(g)
Saeed and Lee did not specify the relationship between Equation 2 and the dark “corrosion” stains on their Al films, but presumably, they believe that these stains are due to the deposition of Al(OH)3 precipitate. There are a number of problems with this conclusion (and with Equation 2), but the most obvious is that the stains on the Al film are black, whereas Al(OH)3 is a white powder, and in aqueous solution forms a whitish gelatinous precipitate.
Even if there existed some form of surface-deposited Al(OH)3 that appeared black, Equation 2 is highly problematic. It actually combines two processes: first, the oxidation of Al(s) by H+; in this reaction, six surface-localized protons are consumed and replaced by two surface-localized Al3+ cations, and three H2 molecules are released as gas bubbles (Equation 2A). (Saeed and Lee did not report observing any bubbles of hydrogen gas released at the P surface of the Al-Tf-Al disk. They also did not consider the contribution of dissolved oxygen to the Al oxidation reaction.)
Equation 2A: 2 Al(s) + 6 H+(localized) → 2 Al3+(localized) + 3 H2(g)
If Al oxidation to Al3+ were the only reaction, then the Al film would appear pitted (not black) at the end of the 10 h electrolysis experiment, and the film would weigh less. (Saeed and Lee did not report any changes in the mass of the Al film.) Thus, Saeed and Lee seem to envision a second process embedded in Equation 2: the reaction of Al3+ with hydroxide to precipitate aluminum hydroxide on the P surface of the Al film (Equation 2B).
Equation 2B: 2 Al3+(?) + 6 OH–(?) → 2 Al(OH)3(s, surface)
Note the question marks in Equation 2B. The logical assumption would be that the precipitation reaction would take place in the surface layer adjacent to the P side of the Al film. However, if, as Saeed and Lee have claimed, the pH is 2.92 in this surface layer, then the hydroxide concentration is insufficient to form Al(OH)3. The solubility product of Al(OH)3 has been reported (Chen, 1973) to range from 10-30 to 10-34 (with a narrower range in the presence of 0.1 M supporting electrolyte, [1.0 – 4.4] x 10-31). Many sources cite a value of 2(10-33), and this seems reasonable. Furthermore, a surface pH of 2.92 (1.2 mM H+) implies a hydroxide surface concentration of 8.32 pM (= 10-14/0.0012). Thus, in order for Al(OH)3 to precipitate, the Al3+ concentration in the surface layer would have to exceed 3.5 M. As this is highly unlikely, Saeed and Lee distinguished between H+(localized) at the disk surface and OH–(aq), implying that the initial Al(OH)3 precipitation takes place not at the disk surface, but out in the bulk aqueous phase, where the hydroxide concentration is much higher.
In the bulk aqueous phase, Saeed and Lee reported pH values ranging from 5.7 to 8.9 in various experiments. At pH 6 (10 nM OH–), Al(OH)3 will precipitate at [Al3+] > 2 nM. The implication of Equation 2 seems to be that the black “corrosion” stains on the Al films are particles of Al(OH)3 that precipitate initially in the bulk aqueous phase, and then diffuse to the Al film where they deposit to form a black surface stain. However, there are a number of problems with this conclusion.
(I) Saeed and Lee did not account for the possibility that a significant fraction of Al oxidation could be due to reaction with dissolved oxygen.
(II) Saeed and Lee did not chemically characterize the black material staining the Al films.
(III) All aluminum oxide precipitates, including Al(OH)3, AlO(OH), and Al2O3 are white powders. They would not form black stains on the surface of Al film.
(IV) There is no driving force that would cause aluminum oxide precipitates, all of which are neutral particles, to diffuse toward the Al film. They would simply fall to the bottom of the anode chamber solution or form a colloidal suspension.
(V) Any Al(OH)3 precipitate that did reach the Al film surface would have to diffuse from the relatively alkaline bulk aqueous phase through the acidic surface water layer (pH 2.92). The high proton concentration in the surface layer would dissolve the Al(OH)3 solid particles, giving Al3+(aq) + 3 H2O(l).
(VI) Later in their paper (p. 128), Saeed and Lee report that “observable corrosion” forms on the Al film at pH > 8.7 in control experiments in the absence of electrolysis. This clearly cannot be from a proton-induced reaction, because at pH > 8.7, the proton concentration is nM or less.
Thus, the authors’ contention that the dark “corrosion” stains on the Al films have anything to do with “proton sensing” is not only unsubstantiated, but highly unlikely. This in turn calls into doubt Saeed and Lee’s claim that in their electrolysis experiments, they have established an aqueous TELP protonic capacitor system. In order to support (or challenge) their interpretation, the authors must carry out at least three important experiments: (i) expose Al film to pH 0 – 14 buffers to characterize any proton-dependent changes; (ii) chemically characterize the “stain” material deposited on the Al film; and (iii) measure any changes in the mass of the Al film after electrolysis.
Before we move on, it is worth considering these questions: If the protons formed by water electrolysis are found neither in the P surface layer nor in the bulk solution, then where are they? If the black stains on the Al film surface are not Al(OH)3, then what are they? If the salt cations are not exchanging with surface-localized protons, then how do they inhibit the stain-forming process? In the absence of key control experiments, answers to these questions would be pure speculation, but interested readers are referred to Section II of the Supporting Information for some possibilities.
Reported Proton-cation Exchange Keq Values Cannot Be Correct
Saeed and Lee performed their water electrolysis experiments in the presence of 0 – 500 mM sodium and potassium bicarbonate salt solutions. They observed decreasing amounts of stain “corrosion” above 25 mM salt, and complete absence of stain at ≥ 200 mM. Saeed and Lee concluded that this protection against corrosion was due to Na+ (or K+) exchanging with H+ in the surface layer:
Equation 3:
Na+ + surf.H+ → surf.Na+ + H+ ; 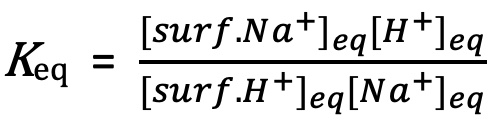
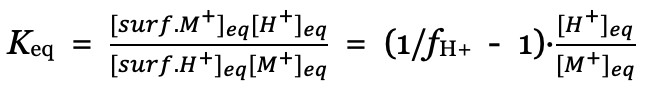
Defining fH+ as the fraction of the surface layer occupied by H+, we can derive (Supporting Information, Section III):
Equation 4: ![]()
Which can be rearranged to:
Equation 5: ![]()
By qualitative visual inspection, Saeed and Lee determined that the 75 mM Na+ solution afforded 50% protection from “corrosion,” where [surf.Na+] = [surf.H+]. Given bulk pH = 8.37 (4.3 nM H+), this allowed them to calculate Keq = 5.7 x 10⁻⁸ for the Na+/H+ surface ion exchange equilibrium. Averaging two different pH measurements at 0 and 200 V in the electrolysis experiment, they reported an average Keq value of (5.07 ± 0.46) x 10-8, and similarly, (6.93 ± 0.91) x 10-8 for the K+/H+ surface ion exchange equilibrium. [We show in Section I-H of the Supporting Information that correct propagation of error gives, instead: (5.1 ± 2.0) x 10-8, and (7 ± 4) x 10-8, respectively.]
The problem with these Keq values is that they yield predictions that dramatically contradict the results presented by Saeed and Lee in their Table 2. First, from the black curve in Figure 1 (Keq = 5.05 x 10⁻⁸), we see that as expected, fH+ = 0.5 occurs at 75 mM Na+. However, at 200 mM Na+, this curve yields fH+ = 0.24, or 24%, which should have produced visible “corrosion” stains. In fact, as mentioned above, the photographs in Table 2 show no stains at all for 200 mM Na+, i.e., fH+ ≈ 0. Thus, Keq = 5.05 x 10⁻⁸ matches photographic results for 75 mM Na+, but not for ≥ 200 mM Na+. The red, green, and blue curves in Figure 1 employ Keq values that give fH+ = 4%, 2%, and 1% at 200 mM Na+. Thus, depending on whether the qualitatively observed full “corrosion” protection at 200 mM Na+ constitutes fH+ = 4% or 1%, this would require Keq for surface ion exchange to be 9 to 37 times higher (respectively) than the Keq that gives fH+ = 0.5 at 75 mM Na+. Hence, a single equilibrium constant (Equation 3) cannot describe the Al film photographic results presented by Saeed and Lee in their Table 2.
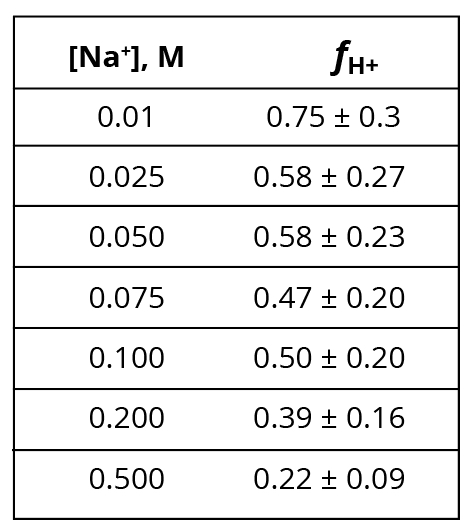
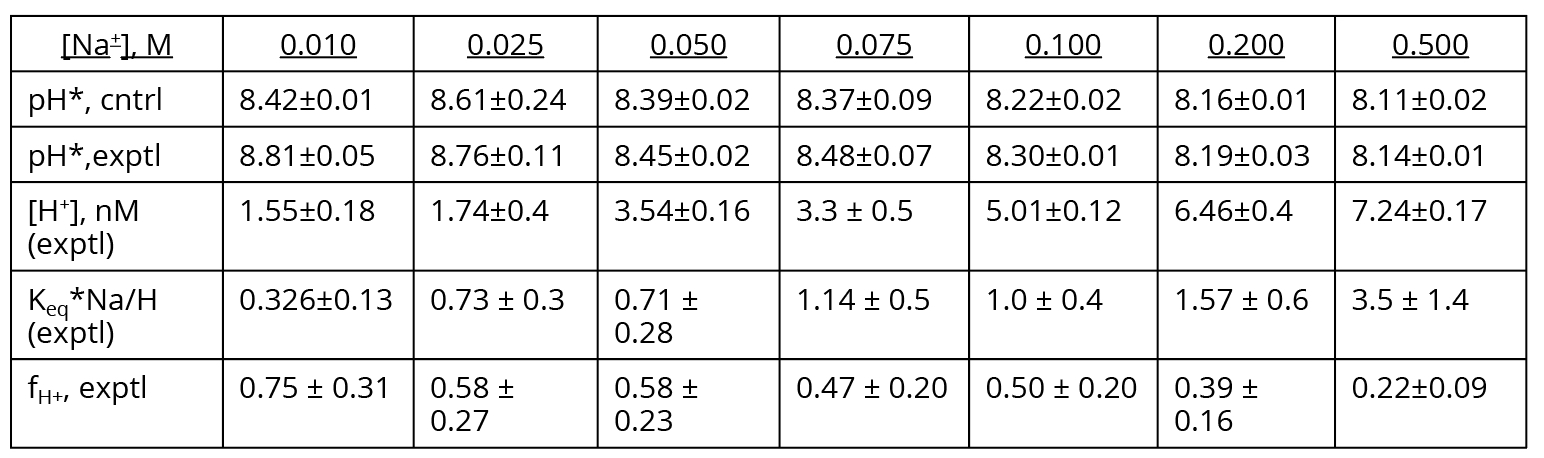
Another way to examine this problem is to calculate fH+ for each [Na+], using Keq = 5.05(10-8) and pH values measured under experimental (200 V) electrolysis conditions (Supporting Information, Section III). The results are presented in Table 1. Key observations here are that fH+ should be statistically identical for 25 and 50 mM Na+ (58%), and also for 75 and 100 mM Na+ (50%). However, the Al film photographs in Saeed and Lee’s Table 2 clearly show less intense “corrosion” stains for 50 mM Na+ relative to 25 mM, and for 100 mM Na+ relative to 75 mM. This contradiction again calls into doubt the assumption made by Saeed and Lee that the Al “corrosion” stains that they observe are a measure of surface proton concentration resulting from the M+/H+ ion exchange equilibrium (Equation 3). Thus, the ion exchange equilibrium constants reported by Saeed and Lee cannot be correct.
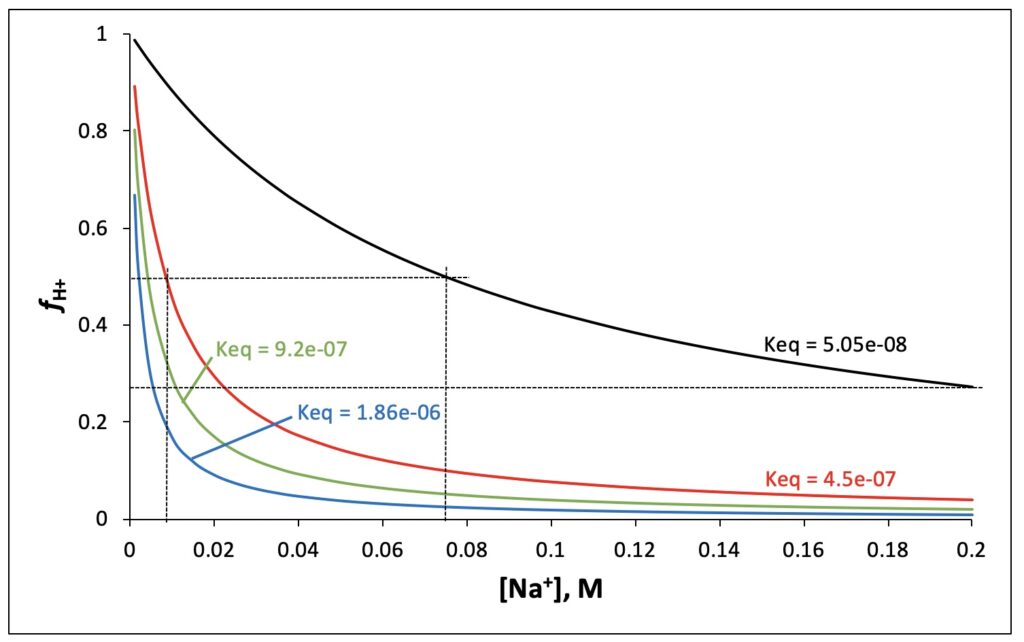
To account for the complete inhibition of Al film staining in the presence of ≥ 200 mM Na+ (while accepting that the Al “corrosion” stains are a measure of surface proton concentration resulting from the Na+/H+ ion exchange equilibrium), one would have to posit Keq > 4.5(10-7), as depicted by the red, green, and blue curves in Figure 1. The problem with this interpretation is that the [Na+]1/2 that gives 50% proton occupation in the surface layer must then lie between 2 and 8 mM Na+ (Figure 1). Comparing the 0 – 50 mM Na+ Al film photographs in Saeed and Lee’s Table 2, this seems exceedingly unlikely. Thus, not only are the surface ion exchange Keq values reported by Saeed and Lee incorrect, but the contention also that their Al film is a proton-sensing detector that can characterize the surface ion exchange equilibrium is highly suspect.
A good question to ask at this point is, if Saeed and Lee’s ion exchange Keq values of ≈ 10-8 are wrong, how wrong are they? Based on the electrostatic nature of Saeed and Lee’s model, and the diameters of the ionic hydrates [0.56 nm for H+(aq), 0.66 nm for K+(aq), and 0.72 nm for Na+(aq)], one would expect M+/H+ ion exchange Keq values of ≈ 0.1, which is seven orders of magnitude higher than the reported value (Silverstein, 2024). Even if one uses Keq values of 0.001, the localized pmf values that one calculates from Lee’s TELP equations (Silverstein, 2024) amount to only ≈ 0.1% of the total pmf (as opposed to Lee’s reported values of 60 – 85%). This is therefore a serious problem for the applicability of Lee’s model.
Does the Teflon® Disk Serve as a Biomimetic Protonic Capacitor?
Saeed and Lee concluded that in their water electrolysis setup, the Tf-Al-Tf and Al-Tf-Al disks form a biomimetic protonic capacitor. By “biomimetic,” they mean that the disks behave like a biological bilayer membrane, with the water layer at the disk surfaces closely resembling the water layers at opposing surfaces of a biological membrane. By “protonic capacitor,” they mean that the aqueous protons near the positive (P) side of a charged membrane are found only in the water layer at the membrane’s P surface, and not in the bulk aqueous phase. (This is depicted in their Figure 1A.) Saeed and Lee make this assumption because just as metal wires and plates serve as electron conductors, water is an excellent proton conductor.
There is reason to doubt the veracity of both conclusions. Regarding the “biomimetic” nature of the the Tf-Al-Tf and Al-Tf-Al disks, both Teflon® (polytetrafluoroethylene) and the metal/water surface are hydrophobic (Limmer et al., 2014), whereas lipid head groups at the membrane surface are polar. Thus, there is no reason to expect the structure of water at the Tf disk surface to resemble that at the lipid bilayer membrane surface, nor do homogeneous hydrophobic disks seem like a particularly apt “biomimetic” for heterogeneous biological membranes.
Furthermore, the Teflon® disk employed by Saeed and Lee is much too thick to serve as a capacitor holding excess charge in the water surface layers on opposite sides of the disk. The electrostatic energy of attraction between a H+/OH– pair separated by a dielectric medium of thickness r can be calculated from Coulomb’s Law, Equation 6:
Equation 6: ![]()
where ε0 is the vacuum permittivity (8.8542 x 10⁻¹² coul2/J/m), ε is the relative permittivity (or dielectric constant) of the medium, and q = ±1.602 x 10⁻¹⁹ coul.
From Equation 6 we calculate E = 9.2(3) x 10-25 J for an H+/OH– ion pair across the 125 µm Teflon® disk (ε = 2). Meanwhile, thermal energy at 25°C is 4500 times higher: kBT = 4.1(2) x 10-21 J. From this we may conclude that the electrostatic attraction between protons at the anodic surface and hydroxide anions at the cathodic surface is negligible compared to thermal energy (endnote 1). Thus, any excess protons that diffuse to the disk surface would not be stabilized by hydroxide anions at the opposite surface; the excess protons would simply diffuse back out into the bulk aqueous phase. Hence, there is no way that the Teflon® disk can serve as a protonic capacitor.
There is yet another reason to doubt the existence of a protonic membrane capacitor in water: Proton conduction in water is much slower than electron conduction in a metal. Due to the delocalized conduction bands in metals, excess electrons in a metal behave as a continuous fluid (or gas) whose particles are minuscule. Because of this, in a charged capacitor, excess electrons are found only at the surface of the negative capacitor plate closest to the positive plate. As Saeed and Lee pointed out, protons diffuse in water in a manner distinct from that of other ions. Instead of “vehicular” translation of the entire ion hydrate complex, protons can also travel by the de Grotthuss mechanism, which features water chains that support a sequence of “hops and turns” (de Grotthuss, 2016; Cukierman, 2006; Agmon, 1995). This accounts for the fact that protons diffuse ≥ 4 times faster than other ions: For example, diffusion coefficients (Aqion, 2020) in nm2/ns are 9.3 for H+, 5.3 for OH–, 2.0 for K+ and Cl–, 1.3 for Na+, 1.2 for HCO3–, 0.8 for Ca2+, and 0.7 for HPO42-.
However, it is important to point out that the de Grotthuss water chains are not believed to be very long: Entropy and Brownian motion calculations put the upper limit at five molecules (Cukierman, 2006), and molecular dynamics simulations (Markovitch and Agmon, 2007; Knight and Voth, 2012) and IR spectroscopic results (Reed, 2013) suggest that the chain generally comprises only two or three water molecules. These chains are long enough to explain the enhanced diffusivity of protons (and hydroxide anions), but proton (and hydroxide) diffusion in water is much less facile and occurs by an entirely different mechanism than electron conduction in a metal. Thus, it seems quite a stretch to assume that protons in water will behave identically to electrons in a metal when exposed to an electric field.
Does a Potential Barrier Preclude Diffusion of Bulk Protons to the Surface?
Saeed and Lee compared the electrolysis results for their supposedly surface-localized protons to literature results at various water/hydrophobic interfaces, including those from Pohl’s group (Weichselbaum et al, 2017). Saeed and Lee wrote (Saeed and Lee, 2018) that Pohl’s result “now appears also pointing [sic] to a similar localized proton phenomenon; their experiments ‘reveal an entropic trap that ensures channeling of highly mobile protons along the membrane interface in the absence of potent acceptors.’ ” Later, Saeed and Lee rejected the “interfacial barrier model” in favor of their own TELP hypothesis, stating that (1) “the excess protons generated by the electrolytic anode electrode in the bulk phase as demonstrated in our experiment would not be able to enter into the liquid-membrane interface, since the putative ‘potential barrier’ (if exists) between the bulk phase and liquid-membrane interface would have prevented the entry of any excess protons from the bulk liquid phase into the liquid-membrane interface.”
There are two problems with these statements. First, Saeed and Lee wrote approvingly of Pohl’s “entropic trap” explanation, but neglected to mention that this entropic trap is in fact the major component of Pohl’s interfacial potential barrier model. Second, for a potential barrier to have completely “prevented the entry of any excess protons from the bulk liquid phase into the liquid-membrane interface,” the barrier would have to be infinitely high. A real, finite barrier simply slows down equilibration, and because Saeed and Lee believe that their system is equilibrated, this does NOT preclude a barrier model. The barrier delays, but does not prevent, the diffusion of protons from the bulk to the surface phase. It is worth pointing out here that this brings up an important distinction between the two models for localized chemiosmosis and surface proton diffusion: The potential well/barrier model is a nonequilibrium/kinetic model, featuring surface proton diffusion that is much faster than proton exchange between surface and bulk aqueous phase; on the other hand, Lee’s protonic capacitor TELP model is static (electrostatic, actually), having no time-dependent elements.
Summary
In their 2018 paper published in WATER Journal, Saeed and Lee reported two basic observations: (I) During water electrolysis, Al films facing the P (anode) side became stained or “corroded,” and these stains were inhibited by increasing concentrations of Na+ and K+ bicarbonate solutions; and (II) bulk pH remained roughly constant, hence protons released by water oxidation did not show up in the bulk phase.
Saeed and Lee drew three main conclusions from their results: (I) The various Teflon® disks became charged during electrolysis with excess protons and hydroxide anions, setting up a “protonic capacitor”; (II) their Al films acted as proton sensors, and the resulting intensities and surface area of the stains could be used to determine surface cation/proton equilibrium constants; and (III) their TELP protonic capacitor model explains the localization of protons in the P surface water layer of biological membranes, whereas potential barrier models are flawed.
We have shown here that all three of these conclusions are either suspect or wrong: (I) Proton conduction in water and electron conduction in metal are so different that the idea that one behaves almost identically to the other seems far-fetched. (II) Saeed and Lee presented no direct evidence that the Al films behaved as proton sensors; in fact, they presented some evidence that suggested the opposite (e.g., “corrosion” stains at pH > 8.7 in the absence of electrolysis). Furthermore, the surface ion-exchange Keq values that they calculated and reported cannot be correct, based on thermodynamic calculations. (III) Saeed and Lee’s understanding of the chemical potential barrier model assumes an infinitely high barrier; real, finite potential barriers merely delay, they do not preclude, the movement of protons between the bulk and the surface phases.
Acknowledgment
I wish to thank James Lee for stimulating discussions over the years, and reviewers for their valuable suggestions. Peter Pohl and Denis Knyazev pointed out the contradiction between the thickness of Lee and Saeed’s Teflon® disk and its Bjerrum length.
Endnotes
Endnote 1.
One could argue (J.W. Lee, personal communication) that due to the macroscopic (≈ 100 µm) thickness of the Teflon® disk, the electrostatic attraction energy must somehow be integrated over millions of charge pairs. But the method for such an integration is obscure, as is the distance cutoff above which you must perform this integration. Electric field strength declines with distance, so at what distance is the field so weak as to be unable to stabilize layers of excess charge?
References
Agmon N (1995). The grotthuss mechanism. Chem Phys Lett 244: 456–462.
Aqion (2020). Table of Diffusion Coefficients [Online]. https://www.aqion.de/site/diffusion-coefficients.
Chen DTY (1973). Solubility Products of Aluminum Hydroxide in Various Ionic Solutions. Can J Chem 51: 3528–3533.
Cukierman S (2006). Et tu, Grotthuss! and other unfinished stories. Biochim Biophys Acta – Bioenerg 1757: 876–885.
De Grotthuss CJT (2006). Memoir on the decomposition of water and of the bodies that it holds in solution by means of galvanic electricity. Biochim Biophys Acta – Bioenerg 1757: 871–875.
Knight C, Voth GA (2012). The curious case of the hydrated proton. Acc Chem Res 45: 101–109.
Lee JW (2020). Protonic conductor: better understanding neural resting and action potential. J Neurophysiol 124: 1029–1044.
Limmer DT, Willard AP, Madden P, Chandler D (2013). Hydration of metal surfaces can be dynamically heterogeneous and hydrophobic. Proceedings of the National Academy of Sciences 110: 4200–4205.
Markovitch O, Agmon N (2007). Structure and energetics of the hydronium hydration shells. J Phys Chem A 111: 2253–2256.
Reed CA (2013). Myths about the proton. The nature of H+ in condensed media. Acc Chem Res 46: 2567–2575.
Saeed HA, Lee JW (2015). Experimental Demonstration of Localized Excess Protons at a Water-Membrane Interface. Bioenergetics 4: 127.
Saeed HA, Lee JW (2018). Experimental Determination of Proton-Cation Equilibrium Constants at Water-Membrane Interface Fundamental to Bioenergetics. Water 9: 116–140.
Silverstein TP (2023). Lee’s “Transmembrane Electrostatically-Localized Proton” model does NOT offer a better understanding of neuronal transmembrane potentials. J Neurophysiol 130: 123–127.
Silverstein TP (2024). Oxidative phosphorylation does not violate the second law of thermodynamics. J Phys Chem B: submitted April 2024.
Weichselbaum E, Österbauer M, Knyazev DG, Batishchev OV, Akimov SA, Hai Nguyen T, Zhang C, Knör G, Agmon N, Carloni P (2017). Origin of proton affinity to membrane/water interfaces. Scientific reports 7: 4553.
Discussion with Reviewers
Reviewer 1: I am happy to offer my opinion on the commentary by T. Silverstein that criticizes a recently published paper on the pages of the WATER Journal, entitled “Experimental Determination of Proton-Cation Exchange Equilibrium Constants at Water-Membrane Interface Fundamental to Bioenergetics,” by Saeed and Lee, WATER 9:116 (2018). I recommend publication of the commentary after a revision.
The specific value of the equilibrium exchange constant that Saeed & Lee reported can indeed be questioned; as the commentary analysis clearly shows, the constant clearly involves some uncertainty (factor of ten or so depending on the conditions). However, everything in biophysical measurements is approximate, and the question is how important the remaining uncertainty is for the qualitative conclusions that are based on such approximate data. I agree there is some uncertainty in the exact value of the equilibrium constant, perhaps related to a simplistic model for the exchange.
Silverstein: Although Saeed & Lee’s model of a protonic capacitor is probably wrong, that’s not the main problem with their ion exchange Keq values of ≈ 10-8. The main problem is that the “corrosion” stains on the Al films most likely have nothing to do with proton concentration, hence their extent cannot be used to estimate the concentration of surface protons, nor to obtain Keq values.
Reviewer 1: What I would add regarding the Al-Tf-Al system is the image charge/polarization attraction of protons by the conducting Al surface.
Silverstein: I thank the reviewer for this important suggestion. I have thought about adding a section on this additional explanation for why protons might be attracted to the Al surface. However, there are two reasons why I decided not to do this. Most importantly, I’m not convinced that the proton concentration at the Al surface is dramatically elevated in Saeed & Lee’s electrolysis setup. Their Al films certainly don’t prove this to be the case. Also, adding this would involve more electrostatics than most readers could handle, and it would take me beyond my main goal in this paper, which is simply to critique the conclusions Saeed & Lee published in their 2018 WATER Journal paper.
Reviewer 1: But the most serious issue not mentioned by T. Silverstein and Saeed & Lee is the non- equilibrium nature of the surface protons participating in the coupling, i.e., the local hypothesis assumes that the protons produced by the pumps may not be equilibrated with the bulk…[However] In S&L experiments, the equilibrium conditions are realized for the surface and bulk ions.
Silverstein: This is an important observation that we discussed in a recent critique of one of Lee’s “reinterpretations” of published results on surface proton diffusion in Knyazev et al., (2023).
Reviewer 2: If because of water electrolysis, the only new chemical species that are introduced into the system (at the anode P side) are protons, one must ask a reasonable question: What else could react with Al foil to induce its apparent “corrosion?”
Silverstein: First, it is important to point out two things: If, as I suspect, Lee’s Al films are NOT reporting proton concentration, then there is no evidence that protons from water electrolysis are enriched at the Al film surface. So, it is not clear that electrolysis causes protons to be introduced at the P side surface. The reviewer has raised an excellent question though, one that readers may wonder about. If the protons are not at the Al film surface, and not in the bulk phase, where are they? And what causes the stains? And how does salt inhibit the stains? Accordingly, I have added this to the main paper, as well as Section II of the Supporting Information, for this paper:
“Before we move on, it is worth asking these questions: If the protons formed by water electrolysis are found neither in the P surface layer nor in the bulk solution, then where are they? If the black stains on the Al film surface are not Al(OH)3, then what are they? If the salt cations are not exchanging with surface-localized protons, then how do they inhibit the stain-forming process? In the absence of key control experiments, answers to these questions would be pure speculation, but interested readers are referred to Section II of the Supporting Information for some possibilities.”
Reviewer 2: Proton movement in water is definitely very different from electron movement in metal, but the recognized fact is that protons do move faster than any other ions in water and by a different mechanism. The length of those proton jumps does not really matter as long as they do support fast proton migration.
Silverstein: I disagree: The length of the water chains supporting the de Grotthuss mechanism of proton hopping does matter. After all, Lee is saying that the protonic capacitor behaves like an electronic capacitor because proton diffusion is so fast in water (due to the de Grotthuss water chains) that electrostatic equations developed for electronic capacitors will apply. But while proton diffusion is indeed faster than that of other ions in aqueous solution, it is still much slower than electron motion in a circuit. That is the main point, and it suggests that one cannot simply assume, as Lee does, that electrostatic equations developed for electronic capacitors apply to protons in two aqueous phases separated by a membrane.
Reviewer 2: If we take the reverse perspective, the chemical potential barrier model is not able to explain how protons become enriched at the interface. They become trapped there once they’ve entered the interfacial zone, but what drives their entry?
Silverstein: The reviewer has raised an interesting point. I will share some thoughts here, but I think this discussion includes a level of detail that is inappropriate to be added to this particular manuscript. The potential well/barrier model hypothesizes that the pumped protons are initially released at the surface of the P side of the membrane. They become enriched there because 2D proton diffusion along the surface is much faster than proton release into the bulk phase, due to the potential barrier. This differs from Lee’s TELP hypothesis, in that Lee believes that the proton pumps release their protons into the bulk phase on the P side. The only support for this assumption that Lee presents is 3D structures of Complexes I, III, and IV, showing their distal edges a nanometer or more from the membrane surface. However, Lee does not stipulate exactly where the proton inlets and outlets are, nor do I think this is known. The proton outlets could easily lie flush with the membrane surface, thus releasing protons directly into the surface layer, as envisioned in the potential well/barrier model. Alternatively, protons released at the protein surface could diffuse preferentially via proton wire titratable groups along the protein surface to release sites at the membrane surface. If this process is more facile than release directly into the bulk phase, this would also cause proton release into the surface layer.
Reviewer 2: Calculations to prove that ion-exchange constants provided by the authors cannot be correct… I assume it might be a valid argument. Nevertheless, the experimental observation remains in place: Only with other monovalent ions present in great excess in solution can the proton-induced “corrosion” be prevented.
Silverstein: This is absolutely true, but it doesn’t prove that the “corrosion” stains are proton-induced, nor that the inhibition of staining by salt is due to M+/H+ cation exchange equilibria that can be characterized by an equilibrium constant obtained from estimation by eye of the extent of staining. That is my only point here: Salt is definitely inhibiting the staining but estimating that inhibitory effect does not yield viable ion-exchange equilibrium constants.
References
Knyazev DG, Silverstein TP, Brescia S, Maznichenko A, Pohl P (2023). A new theory about interfacial proton diffusion revisited: The commonly accepted laws of electrostatics and diffusion prevail. Biomolecules 13: 1641; doi.org/10.3390/biom13111641
Wolf DM, Segawa M, Kondadi AK, Anand R, Bailey ST, Reichert AS, van der Bliek AM, Shackelford DB, Liesa M, Shirihai OS (2019). Individual cristae within the same mitochondrion display different membrane potentials and are functionally independent. The EMBO Journal 38:e101056.
Supporting Information for: Saeed & Lee’s “Experimental Determination of Proton-Cation Exchange Equilibrium Constants at Water-Membrane Interface Fundamental to Bioenergetics” is Substantially Flawed
Section I. Minor errors in Saeed and Lee (2018) paper published in WATER Journal
A. p. 118: Should be pmf = ∆ψ – (2.3 RT) ∆pH/F not “+ (2.3RT…)”
B. p. 119: Saeed & Lee: “the Mitchellian equation [1] that contains the term ∆ψ but does not seem clearly [sic] explain its origin.”
The ∆ψ term in Mitchell’s pmf equation comes directly from the dependence of the chemical potential of an ion on electrical potential; this dependence is clearly explained in Mitchell’s early papers, as well as all undergraduate physical chemistry textbooks.
C. p. 120: Saeed & Lee: “the excess proton layer at the water-membrane interface is likely to be a special monolayer (with a thickness probably of about 1 nm).”
No explanation (or citation) as to why the thickness is “probably” 1 nm.
D. p. 122: The highest salt concentration used in these experiments is consistently 500 mM, not 400 mM (as on p. 122) or 300 mM (as in Tables 3, 4).
E. p. 124: Saeed & Lee: “After the 10-hour water electrolysis, the measured pH value in the anode bulk water body (5.92 ± 0.12) remained nearly the same as that of the cathode bulk water phase (5.81 ± 0.07).”
These values in the prose are the opposite of those in Table 1: cathode, 5.92; anode, 5.81.
F. p. 124: Saeed & Lee: “Use of salts in the anode and the cathode chambers which have large volumes would not only cost much more in chemical materials but also might interfere with the electrolysis process complicating the interpretation of the experimental results.”
The anode chamber is 600 mLs, which would require 30 g of KHCO3 to make a 0.5 M solution, so not prohibitively expensive. The authors do not explain how salt in the anode chamber might interfere with electrolysis.
G. p. 125: Saeed & Lee: “was determined that the mobility of sodium cations under the influence of unit potential gradient (0.53 x 10⁻³ cm2 V-1 s-1) is slower than potassium cation mobility (0.76 x 10⁻³ cm2 V-1 s-1) under the influence of unit potential gradient (36). That’s probably why it required a higher concentration of sodium cations (75 mM) to delocalize 50% of the electrostatically localized protons on P′ site” as compared to only 50 mM K+.”
Ion exchange is at equilibrium, so mobility rate is irrelevant. If Na+ is in fact less effective exchanging w/ H+ cf. K+, it’s simply because Na+ is larger: Na+(H2O)4, 3.6 Å cf. K+(H2O)2-3, 3.15 Å.
H. p. 126: Saeed & Lee: “The true KPNa+ value is likely to be in between average of (5.07 ± 0.46) x 10-8…. The true KPK+ value is likely to be in between with an average of (6.93 ± 0.91) x 10-8.”
The authors report three significant figures for their average Keq values. This is unreasonable, given that:
[Na+]1/2 is determined qualitatively by visual inspection,
The uncertainties reported for pH yield proton concentration uncertainties as high as 35% (e.g., 8.48 ± 0.13 3.3 nM H+ ± 35%), and
During the course of the experiment, [H+] bulk declines by 40% [Na+ runs: from 4.3 nM H+ (pH 8.37) to 3.3 nM (pH 8.48)].
Using uncertainty estimates of ± 15 mM for the [M+] that gives 50-50 protection, and correct averaging and propagation of error calculations, the actual Keq values are 5.1 ± 2.0 e-08 (Na+) and 7 ± 4 e-08 for K+. These large uncertainties also make more sense given that the [M+] determined for 50% protection was made qualitatively, by eye.
I. p. 126: Saeed & Lee: “It has been determined in a previous study (33) that the amount of localized proton density at the PI site that has an effective area 2.55 cm2 to be 1.19 x 10⁻⁹ moles/m2 which is equivalent to a localized pH value of 2.92 assuming an 1-nm proton layer thickness.”
This calculation of pH 2.92 in ref. 33 included a typo (should be 2.98 × 10⁻¹³ moles, not 1013), as well as 2 questionable assumptions:
1. The surface-localized H+ on the P side was present only at the surface of the Tf-Al-Tf disk and there was no excess H+ present in the bulk phase aqueous solutions. However, Saeed & Lee do not explain why they discount the presence of H+ at the surface of the entire dividing wall between the anode and cathode solutions. In the body of the manuscript, we also question the notion that H+ cannot be present in the bulk phase aqueous solutions.
2. Saeed & Lee: “this process reached thermodynamic equilibrium after about 1500 seconds (shown in the inset of Figure 4) under this experimental condition where the curve of the water electrolysis current quickly became flat indicating the completion of the water electrolysis-coupled proton-charging-up process.”
In fact, the line in the inset of their Figure 4 flattened after 1500 s at a current of ≈ 0.12 nA, not 0. If this non-zero current is actually zero, then it should not be sensitive to the voltage, but this control was not performed. If the steady state “flat” current is actually not zero, then the process has not reached equilibrium.
J. p. 127: Saeed & Lee: “it was reported that chloride ions have a high penetration power into the passive aluminum oxide film that protects the aluminum from corrosion (41, 42). This was attributed to its small size that is close to the oxygen atoms in the oxide layer and its high mobility that makes it capable of substituting for the oxygen atoms in the alumina network.”
Again, mobility (rate) has nothing to do with an equilibrium process. Also, the Cl- anion is not particularly small, and it is ≈30% larger than the O2- anion: 0.18 nm vs. 0.14 nm.
Section II.
Alternative Interpretations of Al Stain Results
A.Where are the protons?
If the protons formed by water electrolysis are found neither in the P surface layer nor in the bulk solution, then where are they? To confirm the location of the protons produced in the anodic chamber of the electrolysis apparatus, the authors should add a pH indicator to the solution. They should then be able to detect via color change where the protons go after they are released at the anode. It is possible that they leak into the cathodic chamber where they are neutralized by the hydroxide anions produced there.
B.What are the black stains?
Black stains on the surface of a metal are usually oxides, e.g., CuO, Fe3O4, PdO, MnO2, Ni2O3, Ag2O. If the metal alloy comprising the anode in the electrolysis apparatus contains copper, iron, palladium, manganese, nickel, or silver, then trace amounts of these metals could be oxidized, and the metal cations could form black oxides on the anodic side surface of the Al film. The only way to determine the composition of the black stains is to perform a chemical analysis.
C. How do salt cations inhibit stain formation?
Salt cations could inhibit the oxidation of metal in the anode, and/or they could inhibit the deposition of black metal oxide on the Al film surface. In fact, it is well-known that electrolysis is quite sensitive to ionic strength (Knyazev et al., 2023). In fact, electrolysis has been used to determine the ionic strength of solutions (Nakanishi, 1958). Thus, the effect of salt could be on the electrolysis process itself, and not on any stain forming on the Al surface.
Section III.
Calculating the fraction of disk surface covered by protons, fH+
The cation/proton ion exchange equilibrium at the disk surface is described by Equation 1:
Equation 1:
![]()
Because the entire disk surface layer contains only H+ or M+, the fraction of the surface covered by H+ or M+ (fH+ or fM+, respectively) can be written as
Equation 2:

and
![]()
And the mass balance equation is: fH+ + fM+ = 1
Thus
Equation 3:
![]()
And the ion-exchange equilibrium constant (Equation 1) can be written as:
Equation 4:
Finally, solving for fH+ we get
Equation 5:
![]()
References:
Knyazev DG, Silverstein TP, Brescia S, Maznichenko A, Pohl P (2023). A new theory about interfacial proton diffusion revisited: The commonly accepted laws of electrostatics and diffusion prevail. Biomolecules 13: 1641; doi.org/10.3390/biom13111641.
Nakanishi ( 1958). Anal. Chem. 30: 1988-1991