SPECIAL EDITION
Water Structure
Structure Formation and Physicochemical Properties of Diluted Aqueous Solutions Prepared by the Supramolecular Technique (SMT) Method
Konovalov AI†, Ryzhkina IS, Murtazina LI, Kostina LA
Arbuzov Institute of Organic and Physical Chemistry, FRC Kazan Scientific Center, Russian Academy of Sciences, Abruzov str. 8, Kazan 420088 – Russia
and Gastaldi L *
IED BioEngineering Italia, s.r.l., Via Bra, 3 – 12100 Cuneo, Italy
*Corresponding author, e-mail: ieditalia@icloud.comluciano.gastaldi@virgilio.it, LIMurt@yandex.ru, irina.s.ryzhkina@mail.ru, kostina@iopc.ru
†-Deceased.
Keywords: diluted aqueous solutions, structure formation, supramolecular technique, redox potential, dynamic and electrophoretic light scattering
Received: September 21, 2021
Revised: January 22, 2022
Accepted: February 25, 2022
Published: April 25, 2022
Abstract
The purpose and objectives of this article are to study structure formation and the physicochemical properties of an aqueous material solution (SM) prepared using the supramolecular technique (SMT) method. The paper introduces the study of self-organization and physicochemical properties of the initial SM and solvents: distilled water (DW), municipal water (MW) used for the SM preparation, Kazan municipal water (KMW), and samples SM/DW, SM/MW, SM/KMW. The obtained data is evidence that, in the 1:200 – 1:400 dilution interval, all the samples (SM/DW, SM/MW, SM/KMW) represented self-organized dispersed systems. They have the pronounced ability for nonlinear changes of physicochemical properties (specific conductivity, pH, and redox potential), prompting suggestions that, in this dilution interval, systems might influence biological objects within a minimum of two months after preparation of SM.
Highlights
Variations in the electromagnetic field and those of the electrical type can be transformed into electromechanical impulses, consequently generating a certain amount of kinetic energy. The obtained data is evidence that, in the 1:200 – 1:400 dilution interval, self-organized structures are formed with a pronounced manifest ability to induce nonlinear changes in physicochemical properties (specific conductivity, pH, redox potential), prompting suggestions that, in this dilution interval, systems might influence biological objects within a minimum two months after preparation. This finding is rich in consequences and applications in agriculture, biology, and ecology.
Introduction
Based on the method developed for studying highly diluted aqueous solutions (Ryzhkina et al. 2009), it was shown for the first time (Ryzhkina et al. 2011a; Ryzhkina et al. 2012) that highly diluted solutions of many bioactive substances (BAS) represent a self-organized dispersed system. Obtained experimental results allowed for proposing a method for forecasting biological effects under the impact of such systems. The essence of this phenomenon is nanoscale information (up to 400 nm, ζ-potential from -2 to -20 mV) structures consisting mainly of arranged water molecules called nanoassociates (Ryzhkina et al. 2009). The low-frequency electromagnetic field (LEF) effect is a mandatory condition for nanoassociates to be produced in aqueous systems. It means that highly diluted aqueous solutions are open self-organized nonequilibrium dispersed systems, which as a general matter are characterized by concerted nonlinear changes of all properties.
It is established that formation and restructuring of nanoassociates are the reasons for the unusual physicochemical properties of highly diluted aqueous systems made from BAS. It is imperative to correlate with their bioeffects (Palmina et al. 2009: Ryzhkina et al. 2009b; Ryzhkina et al. 2011b; Ryzhkina et al. 2011c). Conclusions that nanoassociates play a considerable role in the occurrence of bioeffects in highly diluted systems are made based on simultaneous analysis of concentration dependences of system properties found in the course of physicоchemical, and biological experiments (Palmina et al. 2009: Ryzhkina et al. 2009b; Ryzhkina et al. 2011b; Ryzhkina et al. 2011c) performed for a wide range of bioactive substances of different chemical structure.
Study of structure formation and physicochemical properties of diluted aqueous solutions studied aqueous material (SM) prepared with the SMT method (supramolecular technique) will be performed using the method developed by Luciano Gastaldi. In the paper, we will establish the presence of nanoassociates in the SM and dilution intervals in which the formation of nanoassociates and maximum nonmonotonic changes of physicochemical properties of the studied systems are observed. According to Banzhaf, self-organization is the ability of specific systems to change their structures or functions to organize their elements to stabilize themselves in the face of external fluctuations (Banzhaf 2009). Herein, it was characterized by the following methods: dynamic light scattering (DLS) and electrophoretic light scattering (ELS) methods, both critical physicochemical properties.
The comparison of the physicochemical properties and the self-organization of the studied material indicated that SM is a structured and self-organized aqueous dispersion system. The following dilutions could be distinguished: 1:150, 1:200, 1:250, 1:300, and 1:350, in which size and ζ-potential of dispersed phase, the type of particle distribution by size and polydispersion index (PDI <0.3) almost met the full quality criteria of the self-organized dispersed system.
The information gathered on self-organization ultimately demonstrates the formation of a negatively charged internal phase as large as hundreds of nm and that these systems can influence biological objects. It will allow forecasting the possibility of bioeffect occurrence under the impact of the studied systems in dilution intervals.
Material and Methods
The Studied Material
The studied material (SM) was prepared through the SMT method. The SMT method integrates a dual technology: a high sensitivity antenna SMT analyzes the electromagnetic spectrum emitted by the mineral (or biological) systems under study, using a low-frequency receiver; next, all those frequencies emitted in the ultrasound spectrum are sampled, listening punctually down to the subsonic frequencies. A sample of water is made to pass at high speed through a forced path in which obstacles are installed to create turbulence in the fluid. It eliminates all possible existing structured patterns and makes the sample receptive to a new ordering pattern. The variations in the electromagnetic field and those of the electrical type can be transformed into electromechanical impulses, consequently generating a certain amount of kinetic energy. The SMT method is described in the Supplementary Material.
Equipment
The analyses were performed using a methodology commonly applied for studying biologically active compounds in low and extra-low concentration, using a set of sensing and precise equipment:
• conductometer (inoLab Cond 7110, WTW)
• pH-meter (inoLab pH 7110, WTW)
• redox potential meter (inoLab pH 7110, WTW)
• highly sensitive analyzer Zetasizer Nano ZSP (“Malvern Instruments,” UK) allowing the study of particle size and ζ-potential.
Study Design
1. Study of self-organization plus physicochemical properties of the initial SM and solvents: distilled water (DW), municipal water (MW) used for the SM preparation in the SMT device, and Kazan municipal water (KMW).
2. Study of self-organization plus physicochemical properties of the following systems:
1. SM diluted in distilled water (DW)
2. SM diluted in municipal water (MW)
3. SM diluted in Kazan municipal water (KMW)
4. Control 1 – municipal water, as used for the material
preparation
5. Control 2 – distilled water, as used for dilutions
6. Control 3 – Kazan municipal water
The following dilutions were studied for SM/DW, SM/MW and SM/KMW systems:
1, 1:10, 1:50, 1:100, 1:150, 1:200, 1:250, 1:300, 1:350, 1:400, 1:450, 1:500, 1:700, 1:1000.
1.The SM/DW System
Fresh DW was distilled for each SM dilution. Each system with the above dilutions was prepared with fresh DW. Before studying physicochemical properties, the prepared SM/DW system with preset dilution was allowed to stand for 18-24 hours. DW, which was used for system preparation, was poured into a 10 ml vial and let stand for a day just like for dilution.
Upon 24 hours’ expiration, we studied self-organization (with dynamic light scattering (DLS) and electrophoretic light scattering (ELS) methods), physicochemical properties of the SM/DW system of a specific dilution, and of DW, which was used for the dilution (Table 2 and Figures 7-9).
2.The SM/MW System
The SM/MW system was prepared with MW used for the SM preparation. Before studying physicochemical properties, a prepared SM/MW system with specific dilution was allowed to stand for 18-24 hours. Upon 24 hours’ expiration, we studied self-organization, physicochemical properties of the SM/MW system, and MW for comparison (Figures 13, 15, 17).
3.The SM/KMW System
The SM/KMW system was prepared with KMW. Dilutions prepared for studying with physical and chemical methods were allowed to stand for 18-24 hours. Upon 24 hours’ expiration, we studied self-organization, physicochemical properties of the system of a specific dilution, and KMW for comparison. Physicochemical parameters of allowed to stand KMW and SM/KMW systems are presented in Figures 14, 16, 18.
When we studied dilutions of SM/DW, SM/MW, and SM/KMW systems with DLS and ELS methods, we found filters for solution purification impractical due to the degradation of the particles’ parameters quality during filtration, which is consistent with (Yakhno and Yakhno, 2019).
The properties of the solutions of each dilution have been studied in three parallel samples with triple repetition of each experiment and the results are presented in a descriptive way.
Results and Discussion
Study of Self-Organization, Physicochemical Properties of Initial SM and Solvents (DW, MW, and KMW)
To study self-organization and properties of SM/DW, SM/MW, and SM/KMW systems, it is necessary to know physicochemical properties (specific conductivity, pH, redox potential) of the initial systems’ components (SM aqueous solution prepared with the SMT method using MW and such solvents as DW, MW, and KMW). It is also necessary to know its structural condition to specify SM and solvent interaction type. Results of the systems’ physicochemical properties are provided in Table 1.

Table 1. Values of specific conductivity, pH, and redox potential of initial components of the studied systems
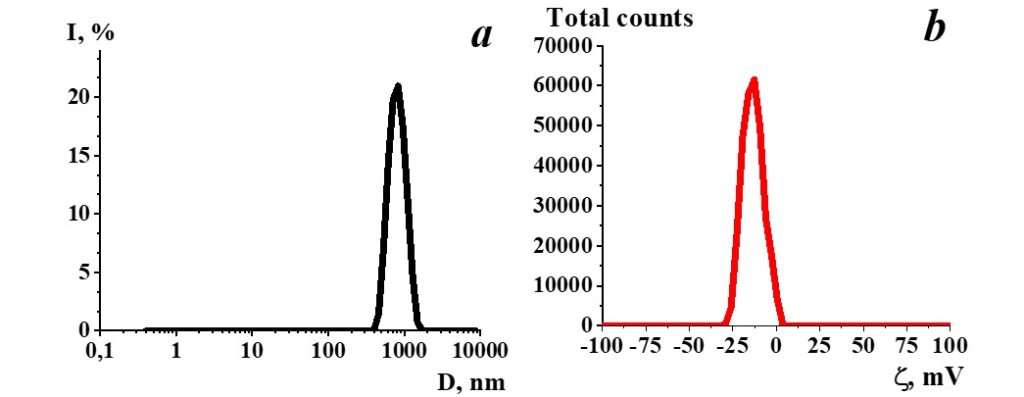
Figure 1. Distribution of particles by size (a) and ζ-potential (b) in a SM sample.
Study of SM aqueous solution self-organization with dynamic and electrophoretic scattering demonstrated (Figure 1) that particles with a hydrodynamic diameter of 800 nm (Figure 1a) are present in the SM. Herewith ζ-potential of such particles is -11 mV (Figure 1b).
SM is a self-organizing nonequilibrium dispersed system sensitive to the impact of external physicochemical factors, in which negative structures such as nanoassociates as big as hundreds of nm are formed, suggesting the existence of their ability to impact biosystems similar to the one demonstrated earlier for diluted aqueous systems of a biologically active substance (Ryzhkina et al. 2009a, 2009b, 2011a, 2011b, 2011c, 2012; Palmina et al. 2009).
However, as any self-organizing nonequilibrium dispersed system with time, SM undergoes structural transformations that degrade the quality of dispersed phase size and ζ-potential determination (Figure 2). The colors represent the repetitions done and are represented separately for better reading. It can be applied to all figures below.
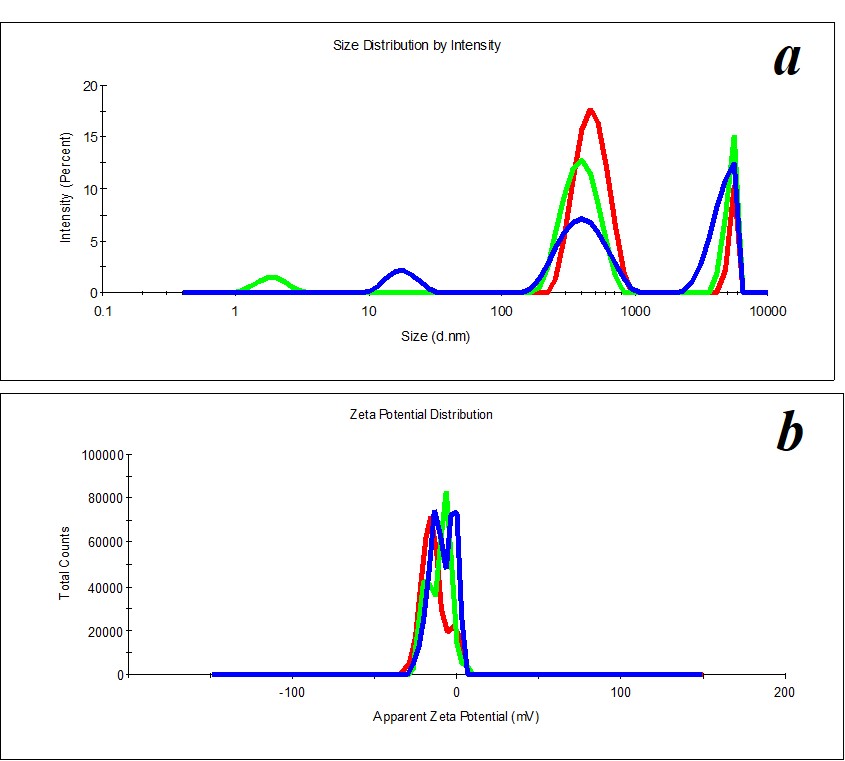
Figure 2. Distribution of particles by size (a) and ζ-potential (b) in a SM sample upon 2.5 months’ expiration.
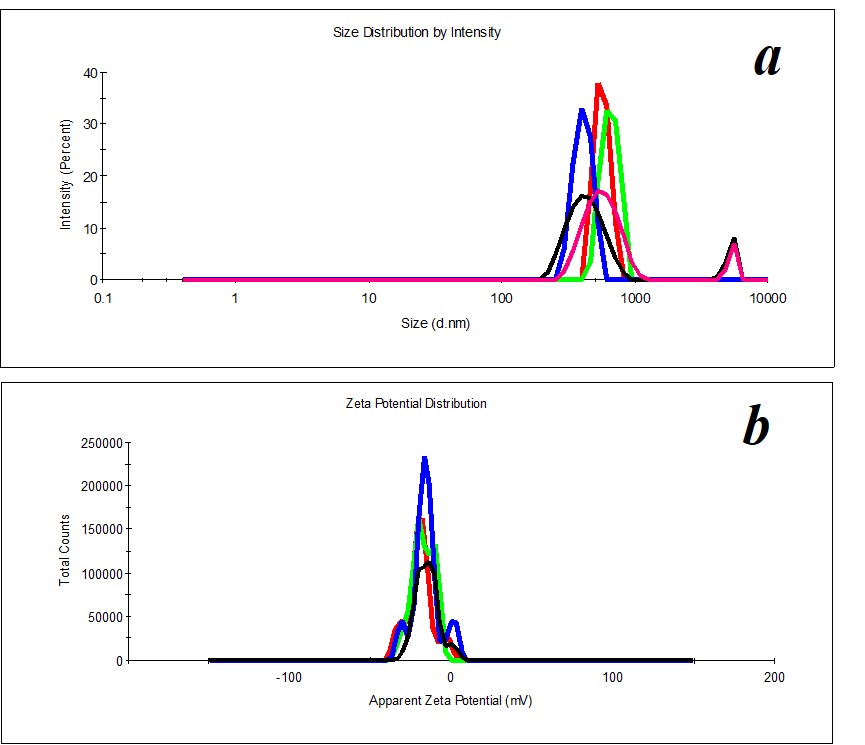
Figure 3. Distribution of particles by size (a) and ζ-potential (b) in a MW sample.
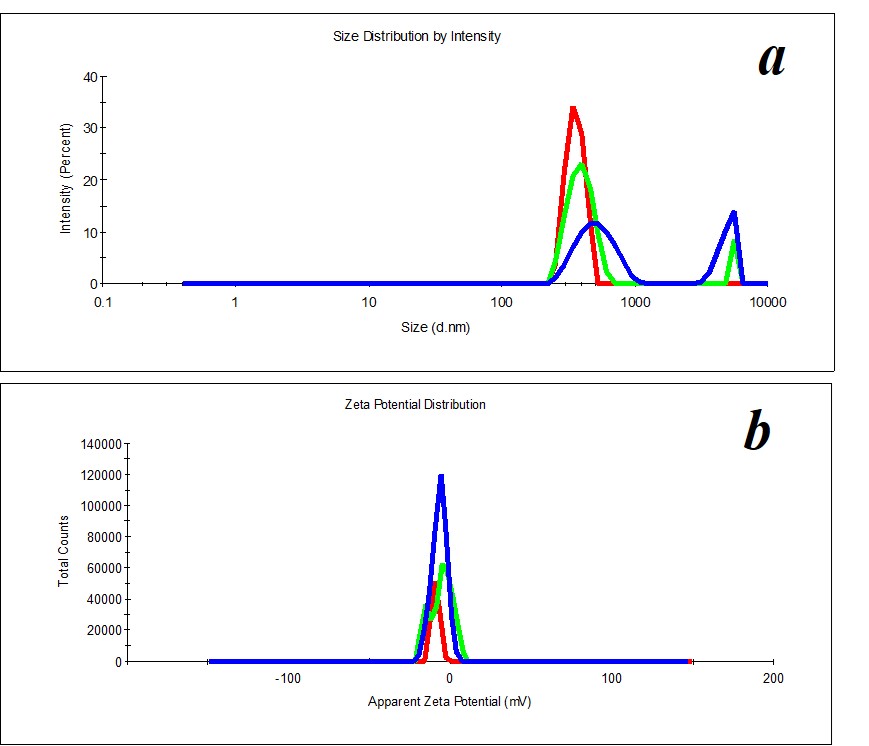
Figure 4. Distribution of particles by size (a) and ζ-potential (b) in a MW sample upon two months’ expiration.
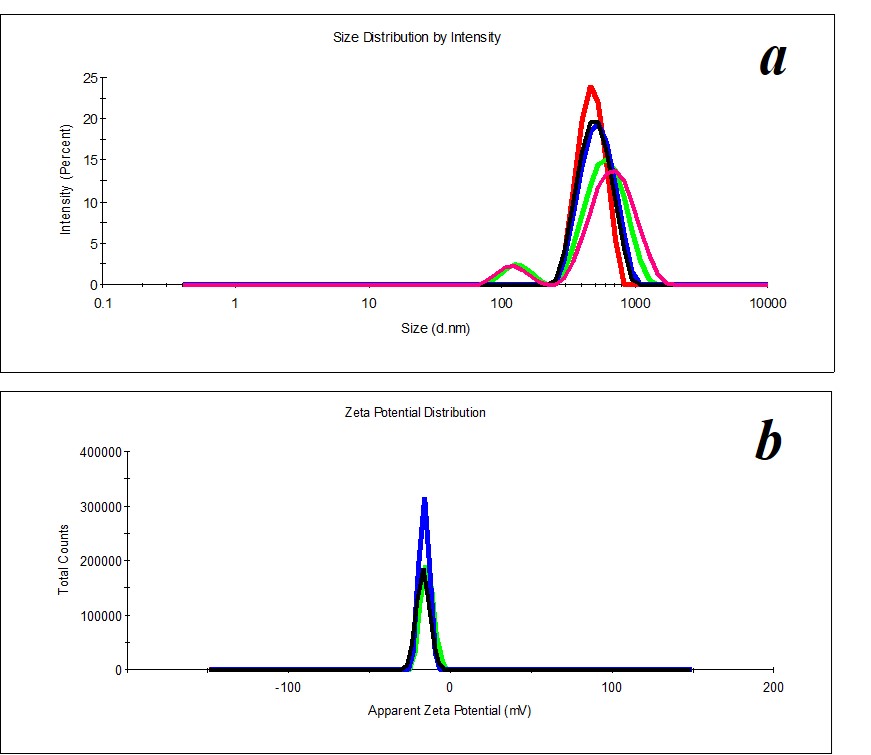
Figure 5. Distribution of particles by size (a) and ζ-potential (b) in a KMW sample. The KMW system keeps structuring within two months (Figure 6).
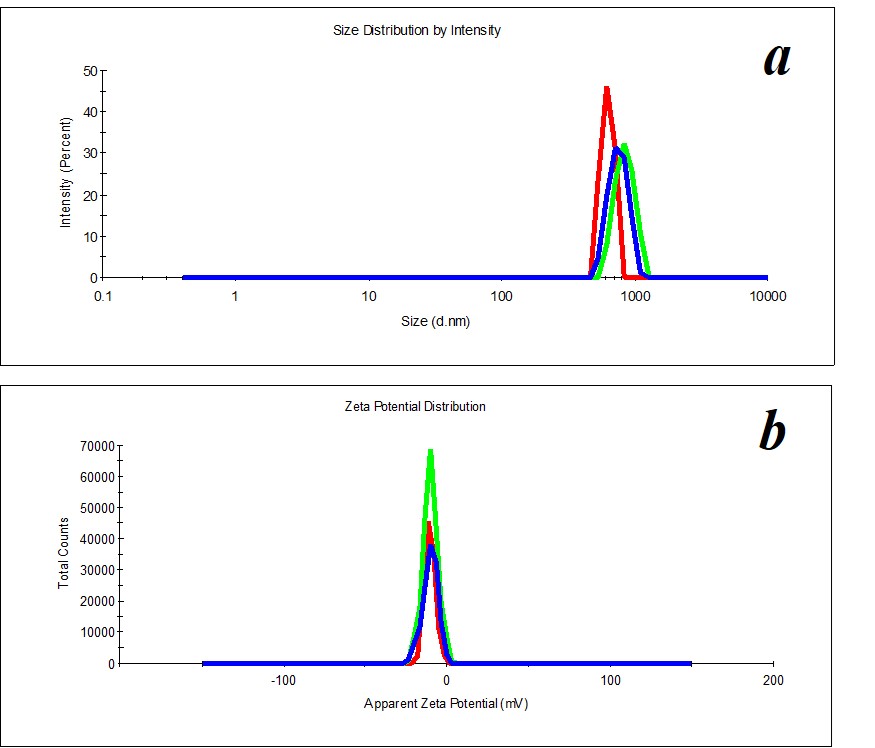
Figure 6. Distribution of particles by size (a) and ζ-potential (b) in a KMW sample upon two months’ expiration.
A study of MW, which was used for SM preparation, discovered the distribution of particles by size (Figure 3a) and by ζ-potential (Figure 3b) is bimodal. The distribution of particles as big as hundreds of nm changes considerably during the measurement of a sample. The hydrodynamic diameter varies from 400 to 650 nm (polydispersity index PDI=0.8). A similar pattern is observed when we measure ζ-potential. It is impossible to define the size and ζ-potential of particles in MW. It is impossible to precisely define MW as a dispersed system. At the same time, MW is not a homogeneous medium; it is a pseudo-nano-heterogeneous medium proved by data in Figure 4.
Comparison of data on size and ζ-potential of SM prepared by the SMT method based on MW (Figure 1) demonstrates that MW structuring is achieved using the SMT method, which is accompanied by dispersed system formation, i.e., the transformation of the aqueous medium into SM self-organizing nonequilibrium aqueous dispersed system takes place.
KMW samples are more structured (PDI=0.4) (Figure 5) than MW samples. Mono- and bimodal distribution of particles by size was observed during measurements. The average hydrodynamic diameter in the case of monomodal distribution is 540 nm; in the case of bimodal distribution by size, it is 100-120 nm and 750 nm (Figure 5a). The particles’ distribution by ζ-potential is monomodal; ζ-potential equals -16 mV (Figure 5b).
The DW distribution of particles by size is polymodal, making DW samples unfit for analysis with the DLS method (PDI > 0.5). i.e., DW is a homogeneous medium. Thus, a comparison of physicochemical properties and self-organization of the SM and solvents (MW, KMW, and DW) indicates that SM is a structured self-organized aqueous dispersed system. The structuring degree of solvents falls as follows: KMW> MW> DW. It means that when SM interacts with the studied solvents forming mixed systems (SM/DW, SM/MW, SM/KMW), interaction type changes from “dispersed system (SM) – aqueous system (DW)” to “dispersed system (SM) – dispersed system (KMW)” that may be accompanied with behaviors of the studied systems during dilutions.
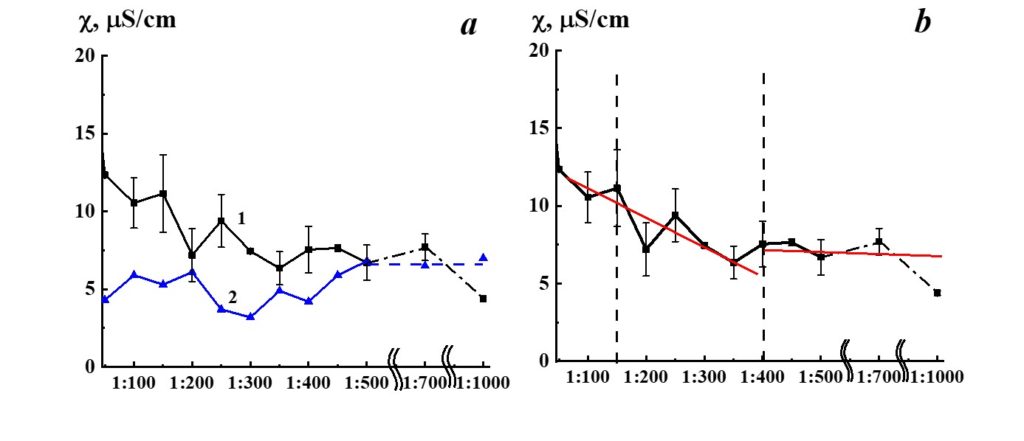
Figure 7. Dependence of specific conductivity from dilution in the SM/DW system (curve 1). Specific conductivity values allowed to stand for a day DW used for the corresponding dilution are shown in curve 2.
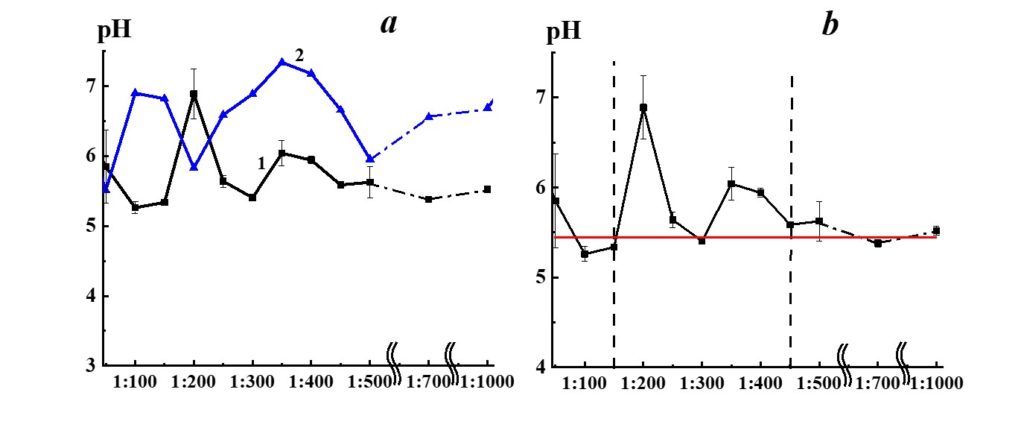
Figure 8. Dependence of pH from dilution in the SM/DW system (curve 1). The pH values allowed to stand for a day DW used for the corresponding dilution are shown in curve 2.
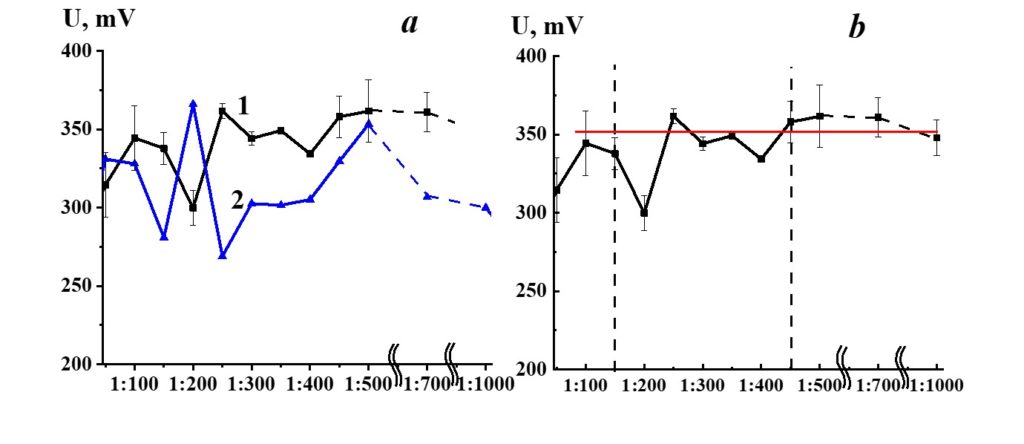
Figure 9. Dependence of redox potential from dilution in the SM/DW system (curve 1). ORP values used for the corresponding dilution are shown in curve 2.
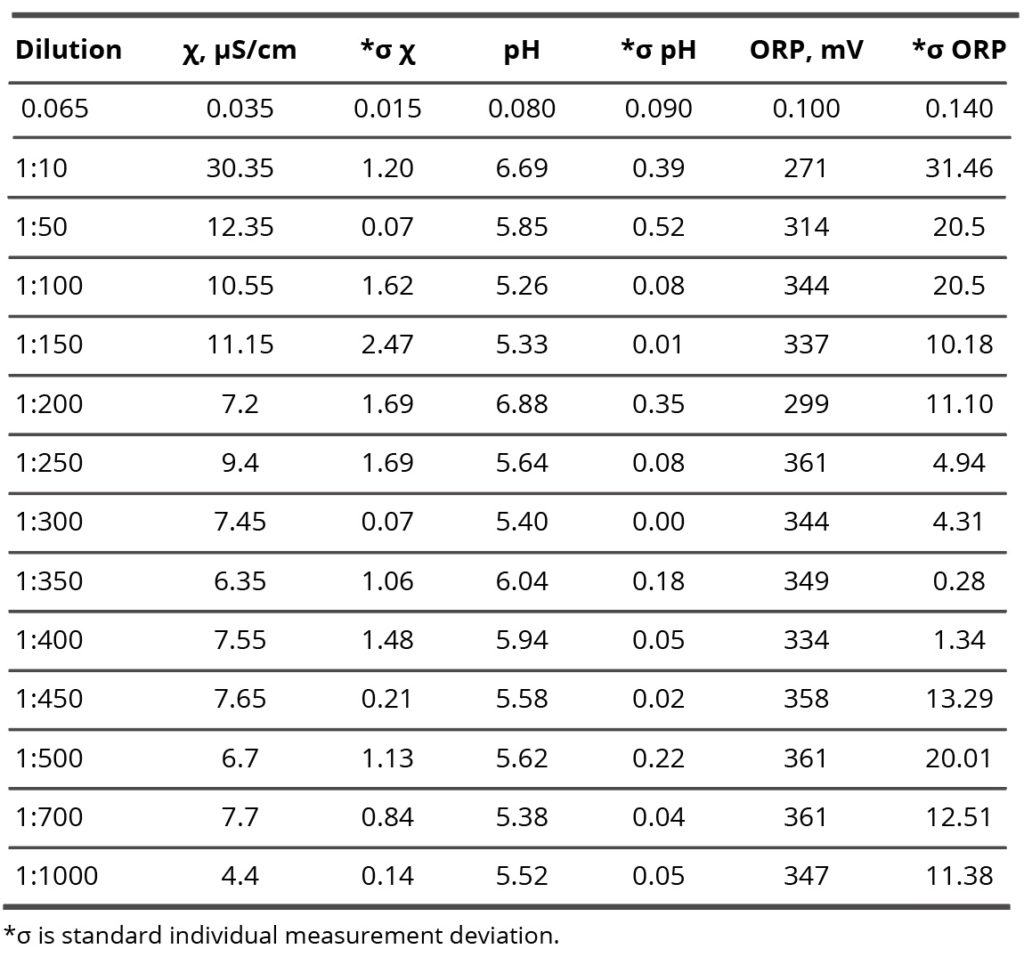
Table 2. Specific conductivity, pH, and potential redox values of the SM/DW system in different dilutions.
Study of Self-Organization, Physicochemical Properties of SM/DW System
Results of research of SM/DW aqueous system physicochemical properties are provided in Table 2. The study of the SM/DW system against dilution with the conductometric analysis method (Figure 7, curve 1) demonstrates that the specific conductivity (χ) dependence from dilutions is nonlinear. χ values change from 5 to 30 µS/cm.
In Figure 7 (curve 2), specific conductivity values of DW used to prepare the system are provided for comparison. Like the SM/DW system, DW was allowed to stand regularly on a laboratory workbench for a day. In 3 weeks of measurements, the DW χ value was within the range between 7.5 and 4.5 µS/cm; the average value was 6.0±1.5 µS/cm.
About the specific conductivity dependence in SM/DW systems, one can distinguish three dilution areas (Figure 7, curve 1): 1:50 – 1:150, 1:150 – 1:350, and 1:400 – 1:1000. In the second area, χ values changes were observed with considerable deviations from linearity, evidencing that nonequilibrium self-organizing systems may form in this interval. The formation of negative dispersed phases as big as hundreds of nm, which can influence biosystems, is a feature of such systems. Minor linear deviations are seen; there are almost no deviations in the third area.
Figure 8, curve 1, demonstrates pH dependence from dilution in the SM/DW system. The pH values of DW allowed to stand for a day (curve 2) are shown for comparison. The pH variations in SM/DW system and DW are synchronous in 1:300 – 1:1000 interval (plateau access) and are asynchronous in the 1:50 – 1:300 interval, indicating considerable differences in the SM/DW system in comparison to solvent, particularly in this interval.
Please note that in the case of 1:50 – 1:150 dilutions, pH values of the SM/DW system are comparable to values of much higher dilutions (1:450 and higher), where pH values access plateau (Figure 8, curve 1). Similar to the concentration dependence of the SM/DW system-specific conductivity (Figure 7, curve 1), the pH dependence of the system (Figure 8, curve 1) allows distinguishing 1:150 – 1:450 dilution area, where pH dependence is nonlinear. In the case of 1:200 and 1:350 – 1:400 dilutions, nonlinear pH values changes (Figure 8, curve 1) are observed. Accordingly, the highest pH deviation from the plateau value is 1.5 and 0.5 pH units.
Figure 9, curve 1, demonstrates potential redox dependence from dilution in the SM/DW system. Redox potential (ORP) values that stand for a day DW (curve 2) are shown for comparison. The pH variations of redox potential in the SM/DW system and DW were synchronous in 1:100 – 1:150 and 1:450 – 1:1000 intervals and in 1:150 – 1:400 intervals, respectively, which indicates considerable differences in the behavior of the SM/DW system in comparison to solvent, particularly in this interval.
The 1:50 – 1:150 dilutions SM/DW systems had the potential redox values comparable to values of much higher dilutions (1:400 and higher), where ORP values access the plateau (Figure 9, curve 1). In the 1:150 – 1:450 dilution interval, a nonlinear redox potential change was observed, especially noticeable in the case of 1:200 and 1:400 dilutions, where potential redox values differed from the plateau values by 50 and 20 mV.
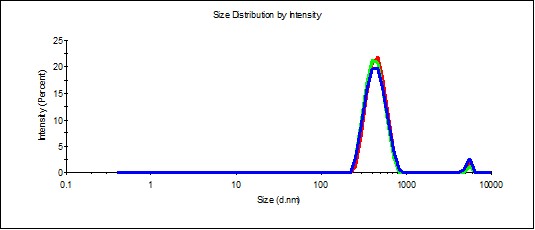
Figure 10. Distribution of particles by size in the SM/DW system in case of 1:200 dilution.
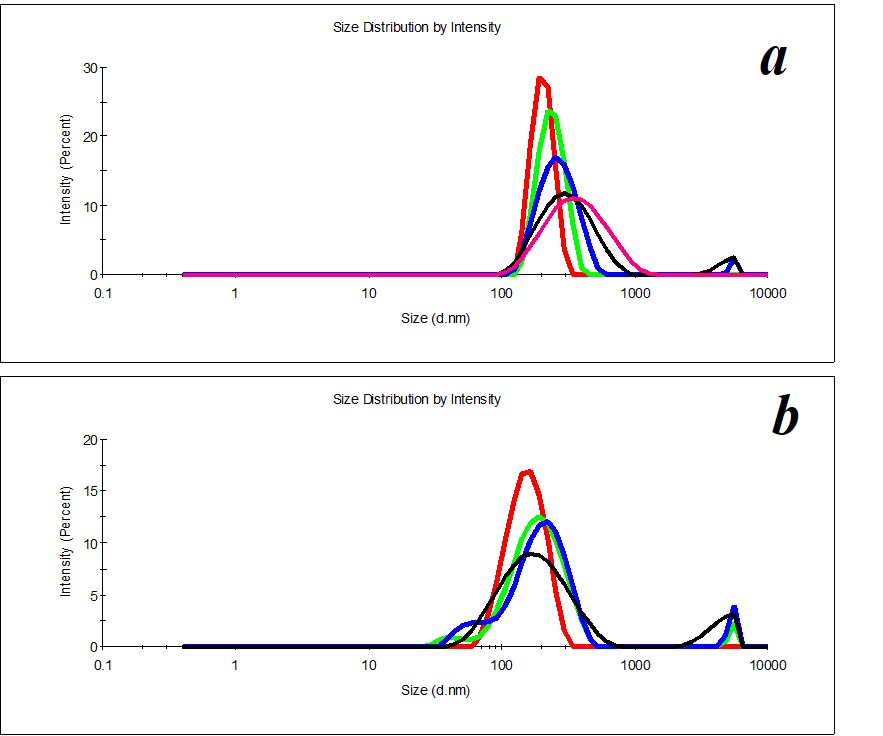
Figure 11. Distribution of particles in the SM/DW system in case of 1:100 (a) and 1:500 (b) dilutions.
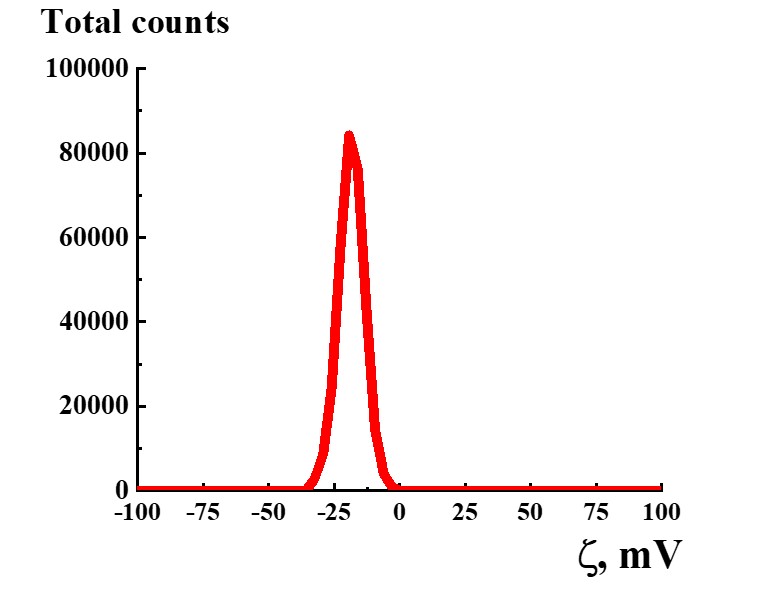
Figure 12. Distribution of particles by ζ-potential in the SM/DW system in case of 1:300 dilution.
Study of SM/DW systems’ self-organization with DLS demonstrated that distribution of particles by size in SM/DW systems in all the studied dilutions is bimodal (Figure 10), i.e., dilution degenerates structuring of initial SM. It is possible to distinguish the following dilutions: 1:150, 1:200, 1:250, 1:300, and 1:350 structuring, the most approximate to SM. In these dilutions, the type of particles’ distribution by size and polydispersion index (PDI<0.3) almost meet the quality criteria of SM’s self-organized dispersed system (Figure 10).
For reference below, we provide the distribution of particles by size in SM/DW systems that do not meet quality criteria (Figure 11), for example, in the case of 1:100 and 1:500 dilutions.
Study of ζ-potential of particles in SM/DW systems demonstrated that in the whole studied interval of dilutions, almost all particles with negative ζ-potential are formed within the range of -18≈-30 mV except 1:10, 1:50, 1:500, 1:700, and 1:1000 dilutions being a part of intervals with linear dependence or plateau of physicochemical properties’ dependence. In the 1:150 – 1:350 interval where nonlinearity of systems’ physicochemical properties is found, ζ-potential of nanoassociates meets quality criterion. For example, Figure 12 shows the distribution of particles by ζ-potential in the SM/DW system for 1:300 dilution. In the dilution, ζ-potential value equals -20 mV.
Thus, based on both nanoassociates’ parameters (size and ζ-potential), it is possible to distinguish SM/DW systems having dilutions in the 1:150 – 1:350 interval as nonequilibrium self-organized dispersed systems and thereby as the ablest to demonstrate nonlinear properties. In the 1:150 – 1:400 interval, we also observe the sharpest variations of physicochemical properties of the SM/DW system that suggests the ability of the SM/DW system to influence biotest objects in the interval.
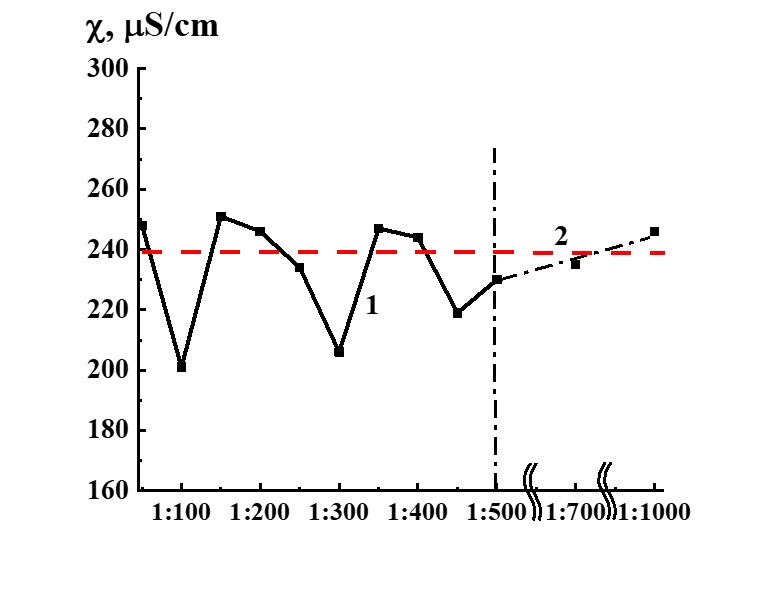
Figure 13. Dependence of specific conductivity from dilution in the SM/MW system (curve 1) and MW specific conductivity value (line 2).
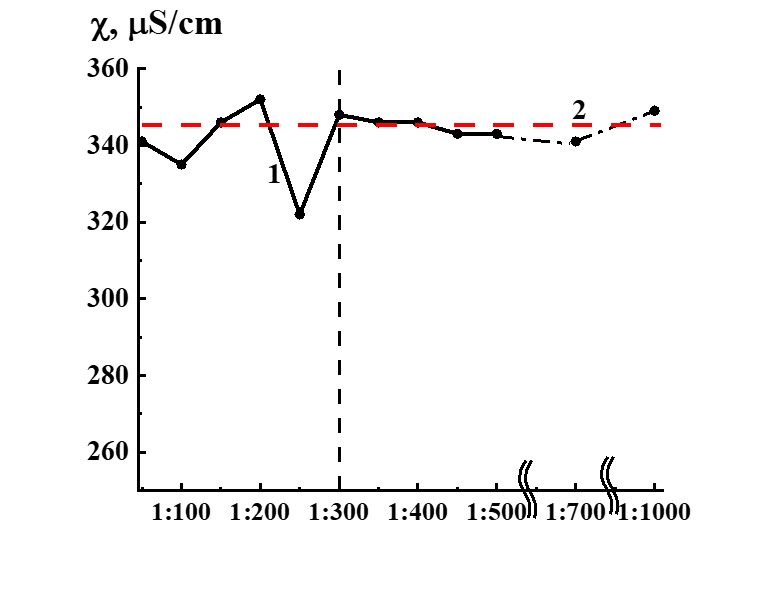
Figure 14. Dependence of specific conductivity from dilution in the SM/KMW system (curve 1) and KMW specific conductivity value (Line 2) provided for comparison.
Study of Self-Organization, Physicochemical Properties of SM/MW and SM/MWK Systems
Study of SM/MW and SM/KMW systems against dilution with conductometric analysis method (Figures 13, 14) demonstrates that the systems’ specific conductivity (χ) from dilutions is nonlinear. χ values change from 170 to 250 µS/cm in the SM/MW system and from 320 to 350 µS/cm in the SM/KMW system. Line 2 in Figures 13 and 14 correspond to MW and KMW specific conductivity values accordingly. However, χ variations in dilutions are slightly different in the systems.
In SM/MW systems, in the case of 1:50 dilution, χ values are almost the same as in the MW solvent. Figure 13 demonstrates that the specific conductivity of the systems changes in a nonmonotonic way with further dilution differing from χ values of MW in 1:100, 1:300, and 1:450 dilutions. In these dilutions, χ deviations from plateau χ value are approximately 40 µS/cm.
The dilution interval where we observed considerable deviations of χ values from the plateau value is more comprehensive than in the case of the SM/DW system, and the deviations begin with a hundredfold dilution and finish with only five hundredfold dilutions.
It could mean that SM/MW systems diluted with the solvent used for SM preparation are nonequilibrium self-organizing in a wider dilution interval from 1:100 to 1:500 than the systems prepared with DW as may be seen below with KMW.
The SM/KMW systems’ specific conductivity varies somewhat differently (Figure 14) than SM/MW systems (Figure 13). Figure 14 demonstrates that in the case of 1:50 dilution χ value of SM/KMW system and SM/MW system comes close to solvent’s (KMW) χ value. Further dependence of SM/KMW systems’ specific conductivity against dilutions almost reached a plateau coinciding with χ value for KMW. Specific conductivity of SM/KMW systems differs from KMW χ values only in 1:100 and 1:250 dilutions. Deviations of χ value from KMW χ value in these dilutions are 10 and 25 µS/cm, which is significantly lower than 40 µS/cm in the SM/MW system in which SM was prepared using MW.
Comparison of SM/MW and SM/KMW aqueous systems’ specific conductivity dependencies from dilutions evidenced that solvent quality does not influence 1:50 dilution, where χ values come close to plateau occurring along with higher dilutions. However, solvent quality influences dilution intervals in which nonlinear variations of χ value are observed; it also influences maximum ∆χ values in some dilutions of the interval.
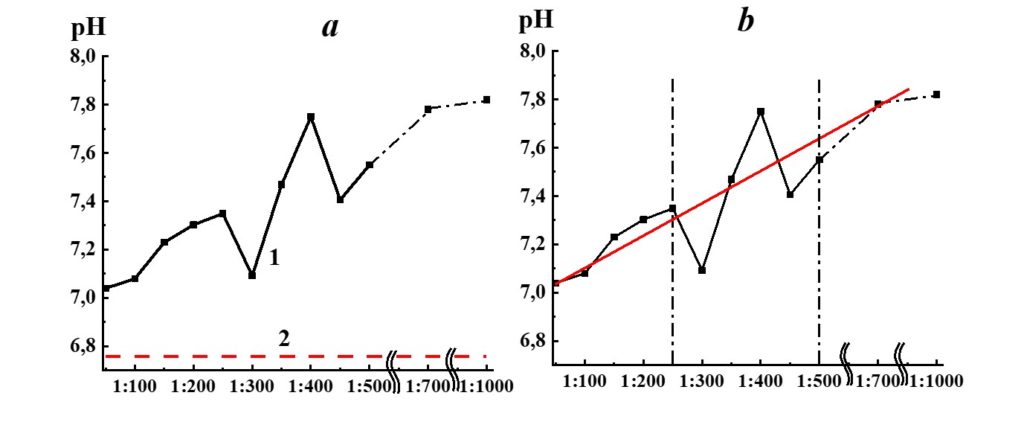
Figure 15. Dependence of pH from dilution in the SM/MW system (curve 1) and MW pH value (line 2).
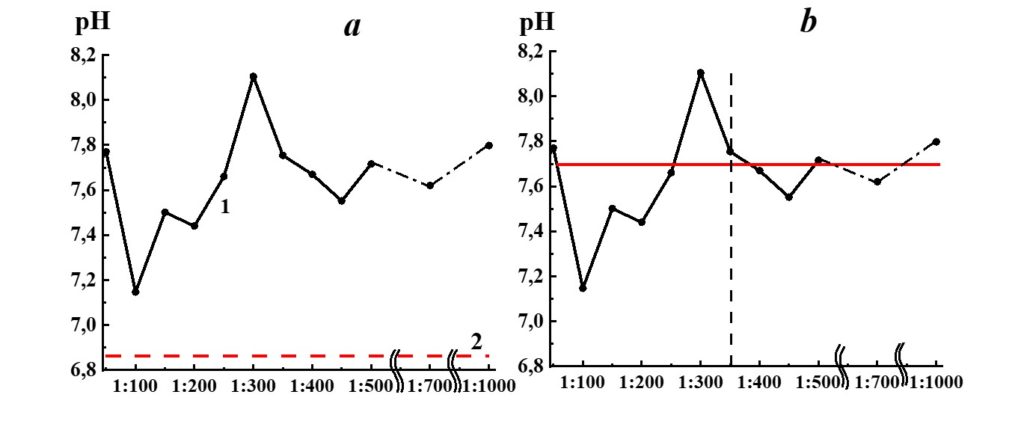 Figure 16. Dependence of pH from dilution in the SM/KMW system (curve 1) and KMW pH value (line 2).
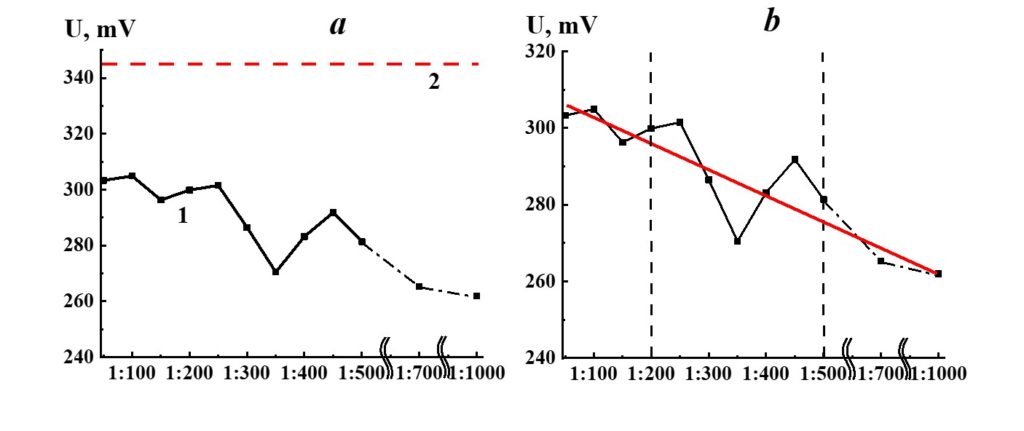 Figure 17. Dependence of redox potential from dilution in the SM/MW system (curve 1) and MW redox potential value (line 2).
Analysis of SM/MW systems’ pH dependences against dilutions (Figure 15) evidenced that the pH of the systems considerably differs from MW pH in the whole studied range of dilutions. It rises significantly with the increase of dilution degree (∆pH around 0.9 pH units). For pH dependence, we distinguish three dilution areas (Figure 15). Am almost linear increase of the systems’ pH is observed in the first area (1:50 – 1:250); a nonlinear increase with extreme values in 1:300, 1:400, and 1:450 dilutions is observed in the second area (1:250 – 1:500), and pH values reach a plateau in the third area (1:500 and higher).
The pH dependence of SM/KMW systems (Figure 16) is of a more complicated nature. The specific conductivity and pH dependence of SM/KMW systems in the case of the 1:50 dilution, where the value is around 7.75, is comparable to the pH value at the plateau obtained with high dilutions (1:350 and higher). However, the SM/KMW systems’ pH significantly differs from pH at the plateau in 1:100, 1:200, and 1:300 dilutions. Maximum deviations equal to 0.6 and 0.35 pH units are observed in 1:100 and 1:300 dilutions.
Figure 17 demonstrates the potential redox dependence from the dilution in the SM/MW system. Similar to the pH dependence (Figure 15), the redox potential values of the systems considerably differ from the redox potential of the solvent (MW) alone in the whole range of dilutions. Three areas of redox potential were seen. The linear dependence of redox potential from dilution was observed in the first area (1:50 – 1:200) and the third area (1:500 – 1:1000); a nonlinear dependence with extreme values in 1:250, 1:350, and 1:450 dilutions was observed in the third area.
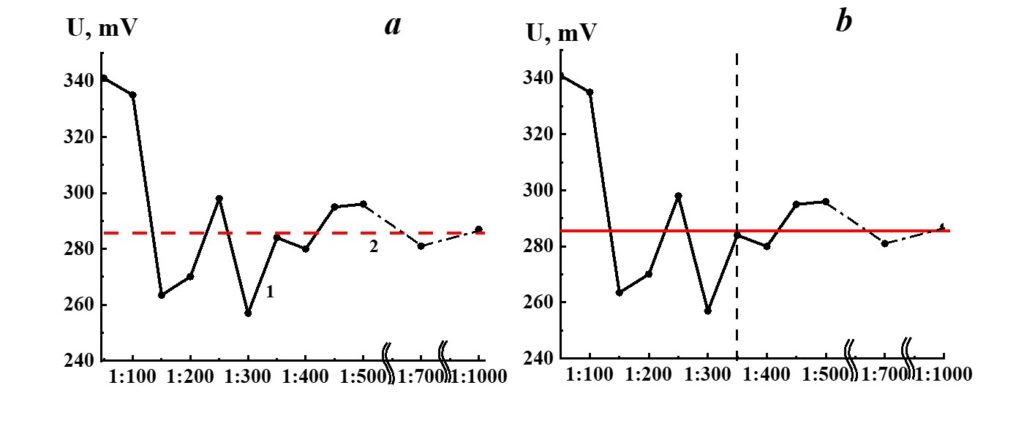 Figure 18. Dependence of redox potential from dilution in the SM/KMW system (curve 1) and KMW redox potential value (line 2).
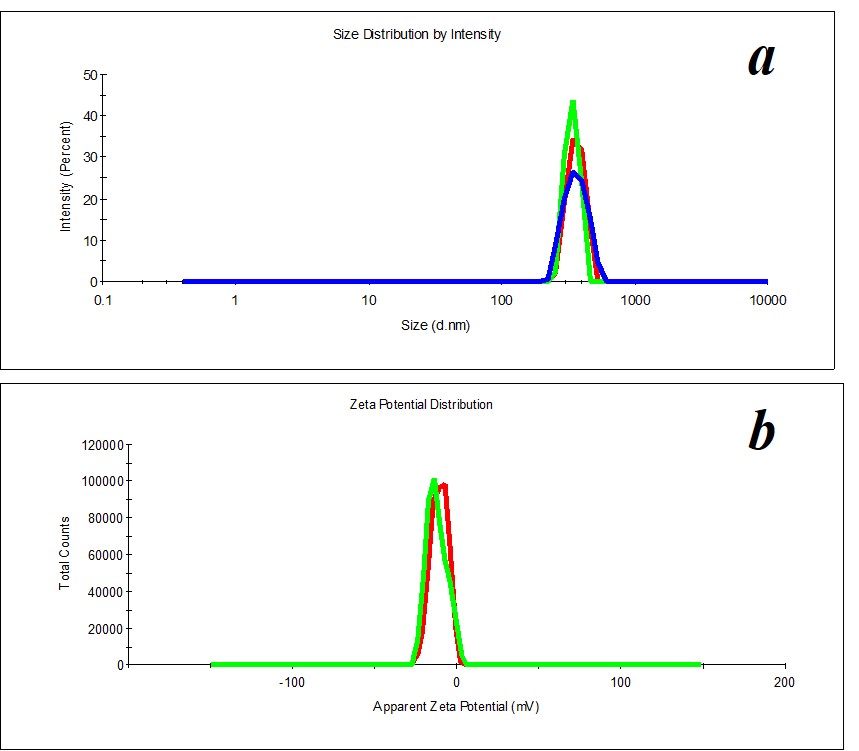
Figure 19. Distribution of particles by size (a) and ζ-potential (b) in the SM/MW system in the case of 1:450 dilution.
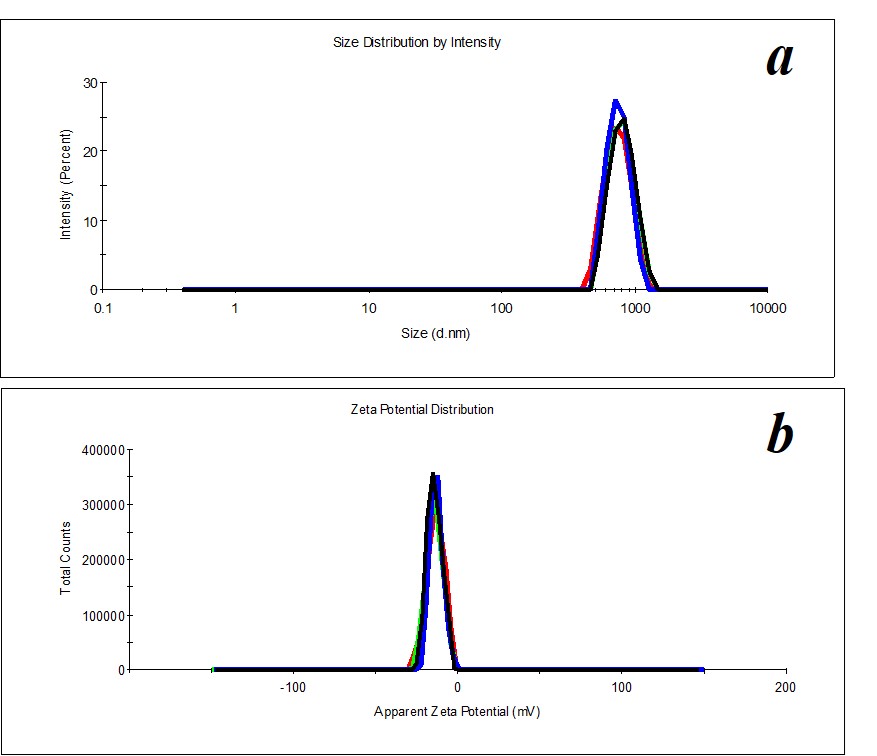
Figure 20. Distribution of particles by size (a) and ζ-potential (b) in the SM/KMW system in the case of 1:200 dilution.
Figure 18 demonstrates the dependence of redox potential from dilutions in the SM/KMW system. Redox’s potential dependence on SM/KMW systems is of a complicated nature. Similar to the specific conductivity and pH seen in SM/KMW systems, the potential redox dependence may be divided into two areas. The dependence of SM/KMW systems’ redox potential in the first area of dilutions (1:100 – 1:350) is of pronounced nonlinear nature; it almost reaches a plateau in the second area (1:400 – 1:000), which coincides with KMW redox potential value. The redox potential of SM/KMW systems differs from KMW values in 1:100, 1:150, and 1:300 dilutions.
Comparing the distribution of particles in the solvent (MW) and SM/MW system by size, we distinguish the following dilutions 1:100 and 1:450, in which distribution of particles by size and ζ-potential is monomodal (PDI<0.4). Figure 19 shows an example of particle distribution by size and ζ-potential for 1:450 dilution.
In the same way, we distinguish 1:200, 1:250, 1:300, and 1:450 dilutions in SM/KMW systems. Figure 20 shows an example of distributions for 1:200 dilution.
Conclusion
Our study confirms the possibility that molecular water configurations may assume different structural levels, thus contributing to the aim of the present Special Edition of the WATER Journal with a more profound understanding of molecular water dynamics, which may lead to further applications of great relevance in many fields, from biology to ecology.
Using DLS and ELS methods, we established that the studied material (SM) forms an aqueous self-organized dispersed system, in which the dispersed phase is formed with dimensions around 800 nm and negative surface potential (ζ-potential – 11 mV). The result of the studies on the MW used for the preparation of SM shows that the use of the SMT method leads to the structuring of MW accompanied by dispersed phase formation, i.e., the transformation of the unstructured aqueous medium into a self-organized dispersed system.
The physicochemical properties of the SM, even if prepared in different solvents – DW, municipal water (used for SM preparation or MW), and Kazan municipal water (KMW) – indicate that the SM is the most structured self-organized aqueous dispersed system. The structuring degree of solvents drops as follows: KMW> MW> DW. This means that, when the SM interacts with the studied solvents, forming mixed systems (SM/DW, SM/MW, SM/KMW), the interaction type changes from “dispersed system (SM) – aqueous system (DW)” to “dispersed system (SM) – dispersed system (KMW)” that may be accompanied by different behaviors of the systems when dilutions are made.
The study of self-organization, physicochemical properties of the SM/DW system in dilution series (1, 1:10, 1:50, 1:100, 1:100, 1:150, 1:200, 1:250, 1:300, 1:350, 1:400, 1:450, 1:500, 1:700 and 1:1000) shows that on the totality of values of dispersed phase’ parameters – size and ζ-potential – it is possible to distinguish the SM/DW with dilutions in 1:150 – 1:350 interval as the most self-organized dispersed system. It is translated by its pronounced ability to demonstrate nonlinear properties. Sharp variations of physicochemical properties (specific conductivity, pH, redox potential) are observed in the 1:150 – 1:400 interval of SM/DW system dilutions, prompting suggestions that SM/DW systems may influence biological objects in this dilution interval.
Comparison of dependencies of SM/MW and SM/KMW systems’ specific conductivity from the different dilutions proves that solvent’s properties almost do not influence 1:50 dilution, where χ values come close to the plateau occurring in high dilutions. However, solvent properties influence dilution intervals in which nonlinear variations of χ value are observed; the properties also influence maximum ∆χ values in some dilutions of the same interval. In the SM/MW case, both parameters are more remarkable and higher (dilution intervals from 1:100 to 1:500 and ∆χ is around 40 µS/cm) than in the SM/KMW system (dilution intervals from 1:100 to 1:300 and ∆χ, not more than 25 µS/cm).
Studies of SM/MW and SM/KMW systems’ pH and potential redox prove the conclusion that in the SM/MW dilution intervals between 1:200 and 1:500, nonlinear variations of the system properties are observed; on the other hand, in SM/KMW systems it happens between 1:100 and 1:350.
The self-organization of SM/MW and SM/KMW systems shows the formation of negatively charged dispersed phase as big as hundreds of nm within 1:100 – 1:450 dilution intervals; corresponding to the intervals of nonlinear variations of physicochemical properties and, according to the literature, these dispersed systems can influence biological objects (De Ninno 2016; Del Giudice et al. 1988, 2014;Konovalov et al. 2017; Murtazina et al. 2014; Ryzhkina et al. 2018, 2019, 2020, 2021a, 2021b, 2021c, 2021d).
The population of obtained data shows that in the 1:200 – 1:400 dilution interval all the studied samples (SM/DW, SM/MW, SM/KMW) represent self-organized dispersed systems that can be translated to their pronounced ability for nonlinear changes of physicochemical properties (specific conductivity, pH and redox potential). It suggests that the systems may influence biological objects within a minimum of two months after preparation of the SM in this dilution interval.
The description of the SMT method is detailed in the figures that make up the Supplementary Material.
Authors’ Contributions
Manager of the Study: Chief Research Scientist, Doctor of Chemistry, Professor, Member of the Russian Academy of Sciences A.I. Konovalov and Leading Research Scientist, Doctor of Chemistry, Assistant Professor I.S. Ryzhkina. Executors: Research Scientist, Candidate of chemical sciences L.I. Murtazina, Junior Research Assistant L.A. Kostina. L. Gastaldi devised SMT.
Discussion with Reviewers (DWR)
Reviewer: What is the dilution method for preparing the systems (SM/DW, SM/MW, and SM/KMW)?
Authors: The following dilutions were studied for SM/DW, SM/MW, and SM/KMW systems:
1 (SM), 1:10, 1:50, 1:100, 1:150, 1:200, 1:250, 1:300, 1:350, 1:400, 1:450, 1:500, 1:700, 1:1000.
Three parallel samples were prepared in 10 ml volumetric flasks using pipettes from 0.01 to 10 ml and a micro syringe with a volume of 10 μl with graduation of 0.01 μl to measure the particle parameters and solution properties. The amount of SM calculated for each dilution was poured into a volumetric flask using a pipette, then DW, MW, or KMW was added to the mark. For example, for a ratio of 1: 100, 0.1 ml of SM was poured into the flask, and DW, MW, or KMW was added to the mark. After that, each flask was placed in a mini shaker for 10 s and kept for 20 hours on the laboratory bench.
Reviewer: The authors claim that, when studying systems SM/DW, SM/MW, and SM/KMW with DLS and ELS methods, they found that filters for solution purification are impractical due to degradation of the quality of parameters during filtration. What happened? Did the differences disappear? Did variations appear without a defined pattern?
Authors: It is known that water under room conditions is a nanodispersed system (Yakhno and Yakhno. 2019). All methods of physical impact on water, including filtration with microfilters, are accompanied by the dissociation of the nano dispersed phase of water and their re-association after hours (days). Therefore, filtration leads to a deterioration in the quality of the parameters of the nanodispersed phase, and it takes time to recover.
Yakhno T, Yakhno V (2019). A Study of the Structural Organization of Water and Aqueous Solutions by Means of Optical Microscopy. Crystals 9 (1): 52. doi: 10.3390/cryst9010052
References
Banzhaf W (2009). Self-organizing Systems. In: Meyers R (eds). Encyclopedia of Complexity and Systems Science. Springer, New York, NY. doi: 10.1007/978-0-387-30440-3_475
De Ninno A (2016). Dynamics of Formation of the Exclusion Zone near Hydrophilic Surfaces. ChemPhys Lett 667: 322-326.
Del Giudice E, Preparata G, Vitiello G (1988). Water as a Free Electric Dipole Laser. Phys Rev Lett 61: 1085-1088.
Del Giudice E, Voeikov V, Tedeschi A, Vitiello G (2014). The origin and the special role of coherent water in living systems. In: Fels D., Cifra M. (Eds.) .Fields of the Cell. Research Signpost 37/661 (2), Fort P.O. Trivandrum-695 023 Kerala, India. pp. 91-107.
Konovalov AI, Ryzhkina IS (2014). Highly diluted aqueous solutions: formation of nanosized molecular assemblies (nanoassociates). Geochem Int52: 1192-1210.
Murtazina LI, Ryzhkina IS, Mishina OA, Andrianov VV, Bogodvid T. Kh, Gainutdinov Kh. L, Muranova LN, Konovalov AI (2014). Aqueous and salt solutions of quinine of low concentrations: self-organization, physicochemical properties and actions on the electrical characteristics of neurons. Biophysics 59: 588–592. doi:10.1134/S0006350914040198
Palmina NP, Chasovskaya TE, Ryzhkina IS, Murtazina LI, Konovalov AI (2009). Water solutions of phenosan potassium salt: Influence on biological membrane structure and conductivity. DoklPhys Chem 429: 301-304. doi: 10.1134/S1607672909060040
Ryzhkina IS, Murtazina LI, Kiseleva Yu.V, Konovalov AI (2009a). Properties of Supramolecular Nanoassociates Formed in Aqueous Solutions of Biologically Active Compounds in Low or Ultra-Low Concentrations.Dokl Phys Chem 428: 196-200. doi: 10.1134/S0012501609100029
Ryzhkina IS, Murtazina LI, Kiseleva Yu.V, Konovalov AI (2009b). Supramolecular Systems Based on Amphiphilic Derivatives of Biologically Active Phenols: Self-Assembly and Reactivity over a Broad Concentration Range. DoklPhys Chem 428: 201–205.
Ryzhkina IS, Murtazina LI, Sherman ED, Pantyukova M.E, Masagutova EM, Pavlova TP, Fridland SV, Konovalov AI (2011a). Physicochemical Substantiation of the Hormetic Response of Biosystems for Wastewater Treatment to the Action of Solutions of N,N-Diphenylguanidinium Bis(hydroxymethyl)phosphinate. DoklPhys Chem 438: 98–102. doi: 10.1134/S0012501611050046
Ryzhkina IS, Kiseleva Yu.V, Murtazina LI, Pal’mina NP, Belov VV, Mal’tseva EL, Sherman ED, Timosheva AP, Konovalov AI (2011b). Effect of α-Tocopherol Concentrations on the Self-Organization, Physicochemical Properties of Solutions, and the Structure of Biological Membranes. Dokl Phys Chem 438: 109–113. doi: 10.1134/S0012501611060042
Ryzhkina IS, Murtazina LI, Konovalov AI (2011c). Action of the External Electromagnetic Field Is the Condition of Nanoassociate Formation in Highly Diluted Aqueous Solutions. Dokl Phys Chem 440: 201–204. doi: 10.1134/S0012501611100058
Ryzhkina IS, Kiseleva Yu.V, Murtazina LI, Konovalov AI (2012). Effect of Ultralow Concentrations and Electromagnetic Fields. DoklPhys Chem 446: 153-157. doi: 10.1134/S0012501612090047
Ryzhkina IS, Sergeeva S.Yu, Murtazina LI, Shevelev MD, Akhmetzyanova LR, Kuznetsova TV, Zaynulgabidinov ER, Knyazev IV, Petrov AM, Konovalov AI (2018). Disperse systems based on chloracetophos in the low concentration range: self-organization, physicochemical properties and influence on representatives of higher plants and hydrobionts. RussChem Bull 67: 792-799.
Ryzhkina IS, Murtazina LI, Shevelev M., Akhmetzyanova LR, GalkinaI.V, Kuznetsova TV, Knyazev IV, Petrov AM, Konovalov AI (2019). Aqueous systems based on organophosphorous compounds in low concentrations: Interconnection of self-organization and biological properties. Phosphorus, Sulfur, and Silicon and the Related Elements. 194: 497-501. https://doi.org/10.1080/10426507.2018.1540485
Ryzhkina IS, Kiseleva Yu.V, Murtazina LI, Kuznetsova TV, ,Zainulgabidinov ER, Knyazev IV, Petrov AM, Kondakov SE, Konovalov AI (2020). Diclofenac sodium aqueous systems at low concentrations: Interconnection between physicochemical properties and action on hydrobionts. J EnvironSci 88: 177-186.
Ryzhkina I, Murtazina L, Gainutdinov K, Konovalov AI (2021a). Diluted Aqueous Dispersed Systems of 4-Aminopyridine: The Relationship of Self-Organization, Physicochemical Properties, and Influence on the Electrical Characteristics of Neurons. FrontChem9: 623860.
Ryzhkina IS, Murtazina LI, Sergeeva S.Yu, Kostina LA, Sharapova DA, Shevelev MD,
Konovalov AI (2021b). Fluorescence characteristics of aqueous dispersed systems of succinic acid as potential markers of their self-organization and bioeffects in low concentration range. EnvironTechnolInnov 21: 101215.
Ryzhkina IS, Murtazina LI, Kostina LA, Sharapova DA, Shevelev MD, Zainulgabidinov ER, Petrov AM, Konovalov AI (2021c). Interrelation of physicochemical, spectral, and biological properties of self-organized multi-component aqueous systems based on N-(phosphonomethyl) glycine in the low concentration range. Russ ChemBull 70: 81-90.
Ryzhkina IS. Murtazina LI, Kostina LA, Dokuchaeva IS, Kuznetsova TV, Petrov AM, Konovalov AI (2021d). Physicochemical and biological properties of aqueous herbicide compositions based on N-(phosphonomethyl) glycine and succinic acid in a range of low concentrations. Russ Chem Bull 70: 1499-1508.
Yakhno T, Yakhno V (2019). A Study of the Structural Organization of Water and Aqueous Solutions by Means of Optical Microscopy. Crystals, 9(1): 52. doi: 10.3390/cryst9010052
Supplementary Material
The Supramolecular Technique – SMT – Structure
A
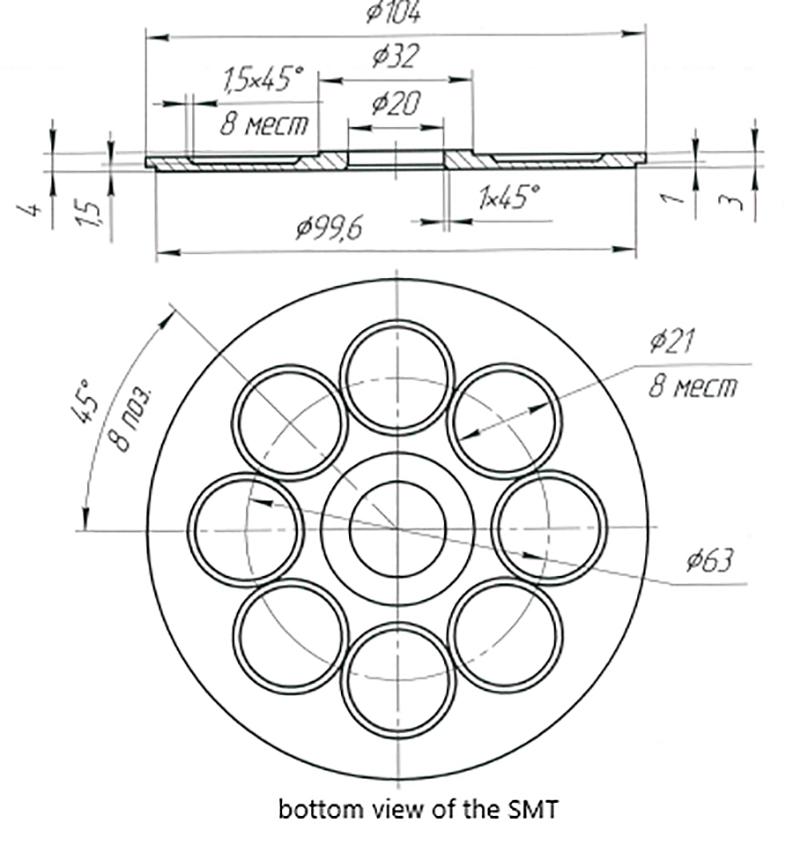
Lower part of the SMT in which eight circular spaces are visible to be used for the transmission of single frequencies to water.
B
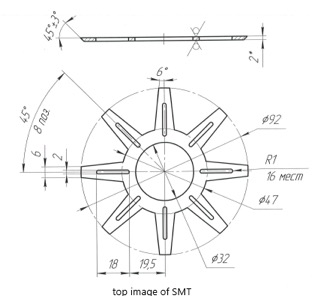
The drawing above depicts the upper part of the SMT in which there are, in correspondence with the lower part, eight other spaces to contain the frequencies inside the SMT.
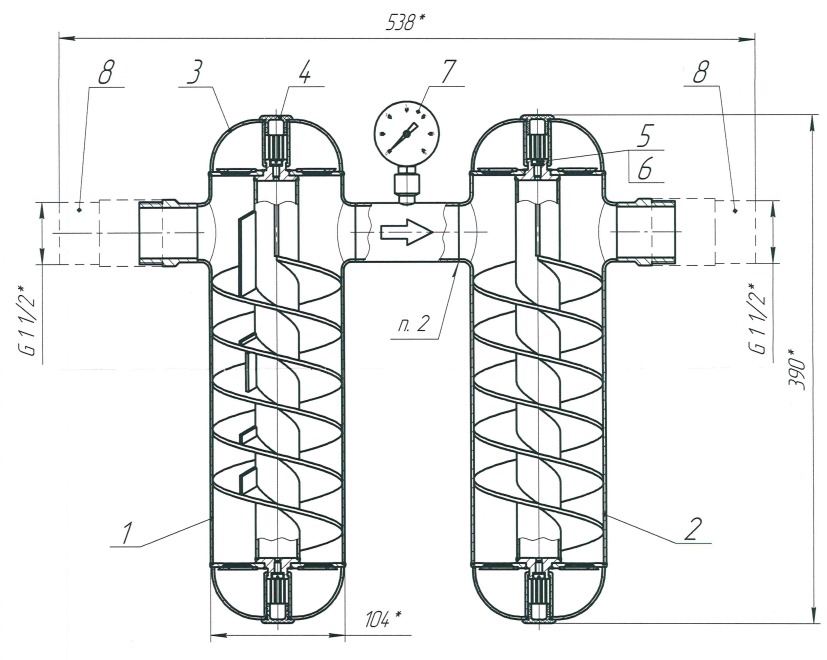
Lateral sectioned view of the SMT in which you can see the spirals for the obligatory path of the water. Between the two cylinders there is (indicated with the number 7) a pressure gauge to maintain the right water pressure.
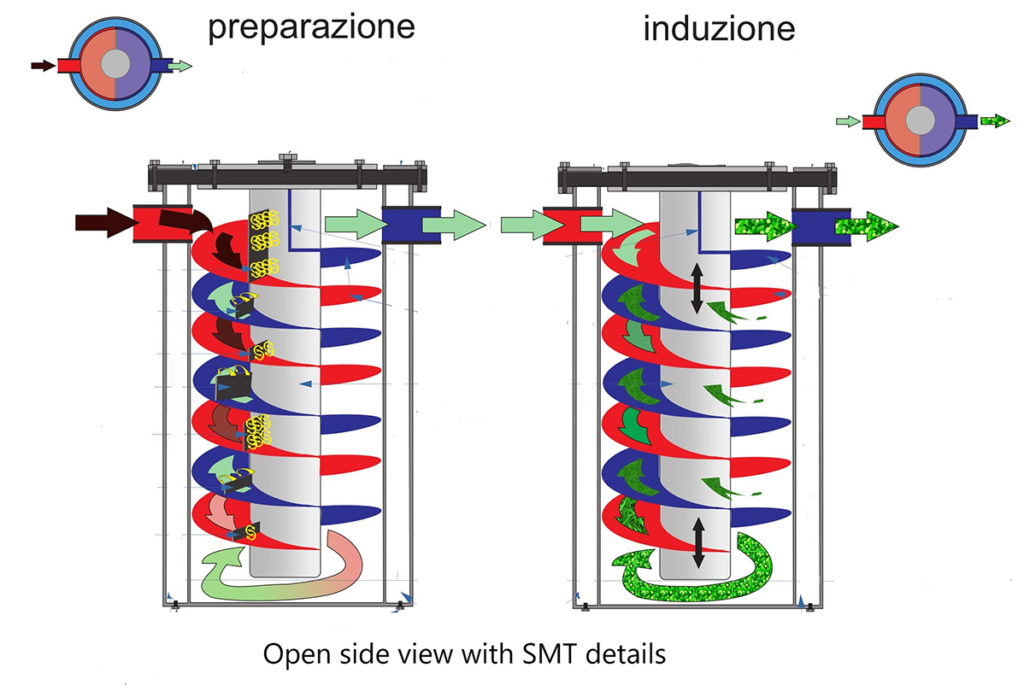
The technological process of S.M.T. is divided into two specific steps:
1. Preparing the fluid (cylinder 1)
2. Fluid computerization (cylinder 2)
Based on the principle of the diamagnetic behavior of the water molecule and the consequent aggregation into macromolecules, which earned Linus Pauling the Nobel Prize in Physics, using the interference method, a spiral helix of cylindrical shape, equipped with generators of turbulent motions with a fixed pitch but with different amplitude, where the fluid is made to pass. With the same principle but using a different passage to cylinder n° 2, the fluid is computerized and then introduced into the irrigation system.
