
 Imaging Cancer and Healthy Cell Sounds in Water by Cymascope, Followed by Quantitative Analysis by Planck-Shannon Classifier
John S. Reid1, Beum Jun Park2, and Sungchul Ji3
1Sonic Age, Ltd., St. John’s-in-the-Vale, Cumbria, England; 2Pharm D/MD candidate, Ernest Mario School of Pharmacy and The Robert Wood Johnson Medical School, Rutgers University, Piscataway, N.J; and 3Department of Pharmacology and Toxicology, Ernest Mario School of Pharmacy, Rutgers University, Piscataway, N.J.
Keywords: Cymascope instrument, Cymascopic, Faraday Waves, Hydrodynamics, Planck-Shannon Classifier, Planckian Distribution Equation, Planckian information of the second kind, Shannon entropy, Raman Spectroscopy, sonified Raman spectral features of cancer cells and healthy cells, tumorectomy.
Submitted: September 30, 2019; Revised: November 6, 2019; Accepted: December 3, 2019; Published: December 24, 2019; Available Online: December 24, 2019.
Abstract
In controlled conditions water can be used as a means of transforming sonic periodicities to water wavelet periodicities, a process that results in the production of Faraday Wave images. The present study uses a Cymascope instrument to render visible the sonic periodicities emitted by cancer cells and healthy cells in human brain tissues, in medical grade water, a step toward developing a real-time surgical procedure support in which the margins of cancerous tissue may be clearly identified for the surgeon during tumor removal. Sound files generated from sonified Raman spectroscopy signals of cancer tissue and healthy tissue are injected into the Cymascope instrument’s fused-quartz, water-filled cuvette. The resulting imagery is captured by digital camera and quantitatively analyzed using a generalized form of the Planck radiation formula, termed Planckian Distribution Equation (PDE). PDE has been found to fit many long-tailed asymmetric histograms (LAH) reported in fields as diverse as atomic physics, protein folding, single-molecule enzymology and in many other fields. The apparent universality of PDE is postulated to be due to the principle of wave-particle duality embedded in PDE that applies not only to quantum mechanics but also to macrophysics. The new classification method referred to as the Planck-Shannon Classifier, which is formulated based on PDE is shown to successfully distinguish between the Faraday Wave images from cancer cell and healthy cell sounds.
Discussion
Neurosurgeons face a significant challenge in the removal of tumors from brain tissues, as the margins of cancerous tissue are often difficult to identify. A device that could support the surgeon in accurately identifying the tumor margins would be highly beneficial. In the paper, “Feature driven classification of Raman spectra for real-time spectral brain tumor diagnosis using sound” Dr. M. Baker et al, discussed a real-time method for differentiating between healthy cells and cancer cells in human brain tissues. Sounds, synthesized from Raman spectra from both types of tissue, would provide auditory feedback for the surgeon. In listening tests, participants were able to discriminate between the different classes of sonified Raman spectra with a mean classification accuracy of 71.1%. The authors point out that such a system would free the surgeons’ visual attention to remain on the patient [1]. A surgeon needs to discriminate between healthy brain tissue and cancerous tissue with extreme accuracy. According to the modality-appropriateness hypothesis, perception gives precedence to the “best” sensory modality for the task at hand; in the case of spatial judgments vision has been shown to be dominant [2]. Therefore, a feedback system that provides real-time visual data to the surgeon, via an integrated head-up visual display, may be advantageous in the process of tumor removal.
This article discusses first steps in creating a real-time system based on visual data provided by a digital Cymascope. A Cymascope is a new type of instrument that uses Faraday Wave technology to render sounds visible in medical grade water. In such a system, signals originating from a Raman spectroscopic probe while scanning brain tissue would provide audio signals (following real-time software processing) to the digital Cymascope, rendering them visible as Faraday Wave images. It is proposed that this visual imagery, displayed to the surgeon, be supported by the results of the PDE calculation in the form of a digital value, which would appear almost instantly in the head-up display, thus clearly delineating healthy tissues from cancerous tissue.
It is established that audible sound can be rendered visible via excitation of particulate matter on a diaphragm or membrane to create an associated pattern. E. F. F. Chladni [3] is generally credited with the discovery of modal patterns. In 1785 he excited a sand-strewn brass plate by playing a violin bow along the edge of the plate, thereby exciting its resonant modes and creating patterns now termed Chaldni Figures [3]. Subsequently, French mathematician, Marie-Sophie Germain, won a prize offered by Napoleon, for mathematically modeling Chladni’s resonant patterns. Later, in 1831, Michael Faraday, inspired by Chladni’s success and by Félix Savart’s experiments with vibrating thin membranes, worked intensively on the effects of vibration on liquids, including water. Faraday termed the resulting patterns “crispations” and today the term “Faraday Waves” is used to describe the excitation of water (and other liquids) into modal patterns by sound and vibration [4]. Typically, the geometry of modal patterns on the surface of liquids enclosed by a receptacle and driven by a vertically oscillating piston relate partly to the nature of the sonic input, for example, whether the vibrations consist of a single frequency or a complex array of frequencies. The geometry is also typically influenced by electro-mechanical resonances in the driving motor, piston and cuvette. The Cymascope instrument, described in the Materials and Methods section, employs electronic filtering to negate the effect of unwanted electro-mechanical resonances and, therefore, creates Faraday Wave imagery that is representative of the sonic input.
In this paper it is shown that the long-tailed asymmetric histograms (LAHs) of cancer cell sounds and healthy cell sounds fit the PDE discovered at Rutgers University in 2008 [5, 6]. There are many natural and human phenomena that generate LAHs [7, 8, 9, 10] and the PDE has been found to fit almost all LAHs across a wide range of scientific disciplines, regardless of their origin, including atomic physics, protein folding, single-molecule enzyme catalysis [11], cancer cell metabolism [12], fMRI (functional magnetic resonance imaging), linguistics, psychophysics, econometrics, social network analysis [10] and cosmology (see Figure 8.6 in [6]). Natural and human-mediated processes that produce the LAHs fitting PDE have been defined as Planckian processes. It was demonstrated in [5, pp. 356-357] that the Planckian process involves various selection mechanisms that separate subsets of events out of all possible randomly accessible events. This paper describes how the PDE can be utilized to classify LAHs into functionally distinct groups; in particular, groups derived from sonified Raman signals from cancer or healthy cells in human brain tissues.
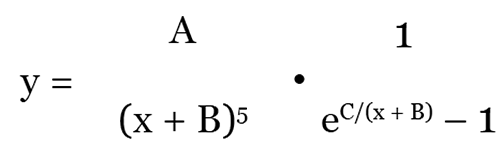
PDE was derived from the blackbody radiation equation discovered by M. Planck (1858-1947) in 1900 [13] by replacing its universal constants and temperature with free parameters, A, B, and C, resulting in Eq. 1 [5, 6, 7].
 (1)
(1)
In the above equation, y is frequency, x is bin number of the histogram, and A, B and C are free parameters.
One way to account for the apparent universality of PDE is to postulate that the principle of wave-particle duality discovered in quantum mechanics is not confined to micro-physics but applies also to macro-physics, including living systems (see Figure 8.6 in [6] and Figure 1 in [7]). Since PDE is isomorphic with Planck’s blackbody radiation equation in mathematical form, it seems reasonable to assume that the first term, (A/(x + B)5 and the second term, (eC/(x + B) -1), of PDE are related, respectively, to the number and average energy of vibrational modes. This assumption is based on the fact that the first and second terms of PDE are also related to the average energy in the system under consideration because PDE is mathematically of the same form as Planck’s blackbody radiation formula.
Materials and Methods
The Cymascope instrument transforms audio input signals to Faraday Wave images by acoustic excitation of a water-filled, circular, fused-quartz cuvette, by means of a voice coil motor (VCM) with vertically driven piston, direct-coupled to the cuvette [14]. The Cymascope laboratory experimental set up is shown in Figure 3 and a block diagram of the signal path is shown in Figure 4.
Faraday Wave patterns are created in the cuvette above a critical threshold termed the point of Faraday Instability [15]. Above this threshold, acoustic energy reflects from the boundary and a Faraday Wave pattern forms, provided the wavelength of the sonic driving frequency can be accommodated within the water area. When sound enters water the sonic periodicities undergo natural compression in a ratio determined by the density of water divided by the density of air in which the sound originally propagated (discovered by J. S. Reid, Sonic Age Ltd, 2015):
Pure water at 20ºC = 0.9982 g/cm3
Air at sea level at 20ºC = 0.001204 g/cm3
Therefore, transformation of airborne periodicities to water wavelet periodicities undergo a compression ratio of approximately 0.9982/0.001204 or 829:1. (It is interesting to consider that such automatic compression may be how the human cochlea is able to detect long wavelength sounds despite being only approximately 30mm when uncoiled.) The automatic compression determines the diameter of cuvette required to permit a Faraday Wave pattern to form for a given input frequency; therefore, the Cymascope utilizes a range of cuvette diameters chosen to accommodate the bandwidth of sounds under study.
The audio signals in WAV format (generated from sonified Raman spectroscopic signals of cancer tissue and healthy tissue, supplied to us by Dr. R. Stables of Birmingham University, UK) were stored on computer 1, as shown in the block diagram, Figure 4 and uploaded into Audacity software, with loop mode selected. The loop used the start point and end point of the signal, providing a continuously repeating sound file. Each sound file was treated in this way and fed into the audio mixer/preamplifier. The line level (775mV) output of the mixer was fed to the input of the compressor-limiter, to control the dynamics of the signal, such that coherent Faraday Wave patterns formed in the Cymascope instrument’s water-filled cuvette. (Without such audio compression the water can be overdriven, resulting in corruption of the resulting Faraday Wave pattern.) The output of the compressor-limiter was fed to the input of a Klark Teknik 30-band graphic equalizer with the settings as shown in Table 1 to create a balanced frequency response for the Cymascope (the frequency characteristic of the Cymascope instrument having been identified by means of a Bruel & Kjaer accelerometer system). The output of the graphic equalizer was fed to one input channel of an Inter-M model QD4240 amplifier with a frequency response of 20 Hz – 20 kHz, THD: <0.1%, over 20 Hz – 20 kHz; 50 watts RMS per channel. The output of the Inter-M amplifier was fed to the input of the Cymascope instrument.
The resulting Faraday Wave imagery was captured in video mode by means of a Blackmagic Cinema production camera and Canon 100mm macro lens set at f 5.6 and 5500K white balance. The frame rate was set to 24 fps with a shutter speed of 1/30th second. An LED light ring, coaxially mounted above the water’s surface, illuminated the cuvette.
The camera was set to record 30 seconds of each sonified Raman spectroscopic signal in RAW video mode, a total of 720 frames. A specific series of sequential video frames were manually selected that represented the full cycle of each given Raman-derived looped signal, which varied according to the length of each sound file. Some sounds required as many as 20 frames, (each frame representing 41.66 milliseconds of Faraday Wave activity) while other signals completed their cycle in as few as 12 frames.
Each RAW frame was individually entered into RawDigger proprietary software, to create a histogram and a .csv file.
The LAHs were fit to the PDE using Solver software available in Excel as exemplified in Figure 1 (e) in [9]. Two numbers can then be computed from the parameters of the histogram-fitting PDE—the Planckian information of the second kind, IPS, and Shannon entropy, H.
There are two ways of quantifying the Planckian information as shown below:
(i) The ratio of the area under the curve (AUC) of PDE to that of Gaussian-like symmetric curves [7, 9].
(ii) The skewedness of the long-tailed histogram [9,16].
The “Gaussian-like” curves are generated by Eq. 2, which is derived from the Gaussian equation by replacing its pre-exponential factor with free parameter A:
y = Ae– (x – µ)^2/(2σ^2) (2)
The degree of mismatch between the AUC of PDE and that of the Gaussian-Like Equation (GLE), Eq. 2, is postulated to be a measure of non-randomness (and hence order and information). GLE is associated with random processes, since it is symmetric with respect to the sign reversal of its exponential term, (x – µ). This measure of order is referred to as the Planckian Information of the first kind, IPF, defined quantitatively by Eq. 3:
IPF = log2 (AUC(PDE)/AUC(GLE)) bits (3)
The rising portion of GLE often completely overlaps with the rising portion of the right-long tailed PDE. To further clarify, PDE fits both right and left long tailed histograms. One example of the left long-tailed histogram is shown in Figure 8.6 (f) in [6]. Right long-tailed and right-skewed PDEs are synonymous. Long-tailed, either left or right histograms, are Long-tailed Asymmetric Histograms. LAH contrasts with long-tailed symmetric histograms.
It has been found that the greater the deviation of PDE from GLE, the greater is the IPF value, since GLE represents randomness and the deviation of PDE from GLE represents non-randomness, order, or information.
The information derived from PDE based on its skewness is referred to as the Planckian information of the second kind, IPS, defined by Eq. 4 to be distinguished from the Planckian information of the first kind defined by Equation 3.
IPS = – log2 (|µ – mode|/σ) (4)
where µ and σ are the mean and the standard deviation of the long-tailed histogram under consideration, and |X| means the absolute value of X [17, 18]. Taking the absolute value of (µ – mode) is necessary because it is negative for left-skewed LAHs.
The Shannon entropy (H) of the PDE-fitting LAHs was calculated based on Eqs. 5 and 6:
H = -Σ pi log2 pi (5)
where pi is the probability of observing the ith event or entity calculated as
pi = yi / Σyi (6)
where yi is the frequency of the ith event of entity and the index i runs from 1 to n, the total number of events or entities.
Thus, the information encoded in a PDE-fitting long-tailed histogram can be visualized as a point in the Planck-Shannon plot (see Figure 3).
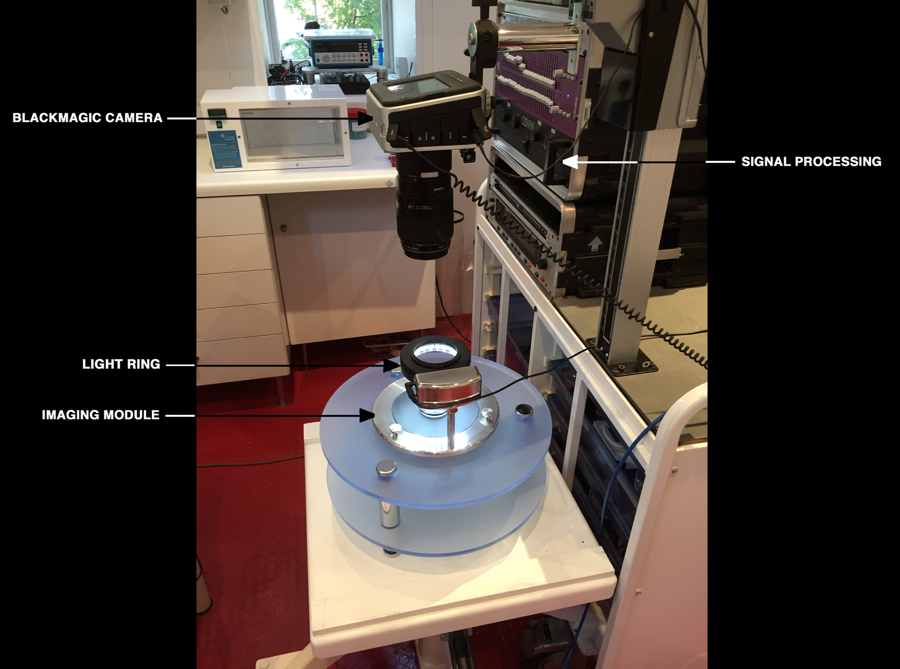
Figure 1. Cymascope instrument experimental laboratory set up.
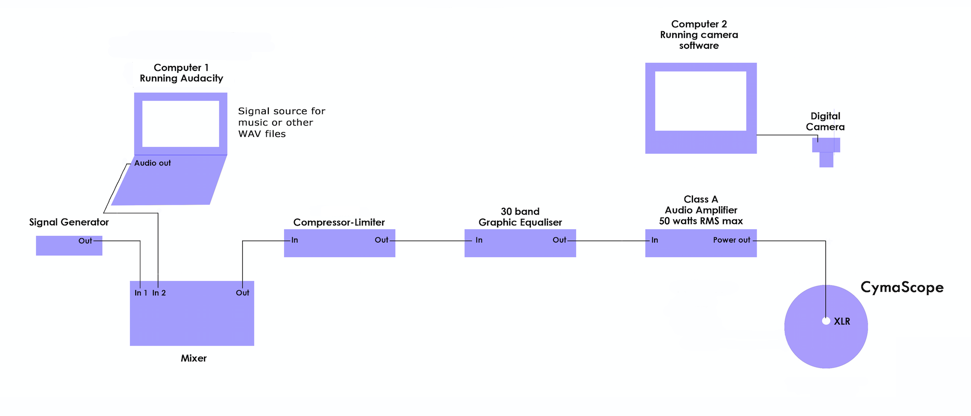
Figure 2. Cymascope signal path block diagram.
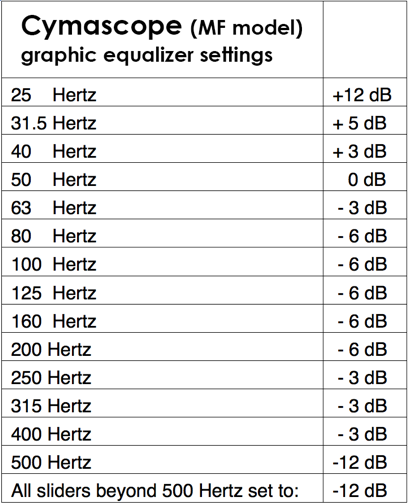
Table 4. Cymascope graphic equalizer settings.
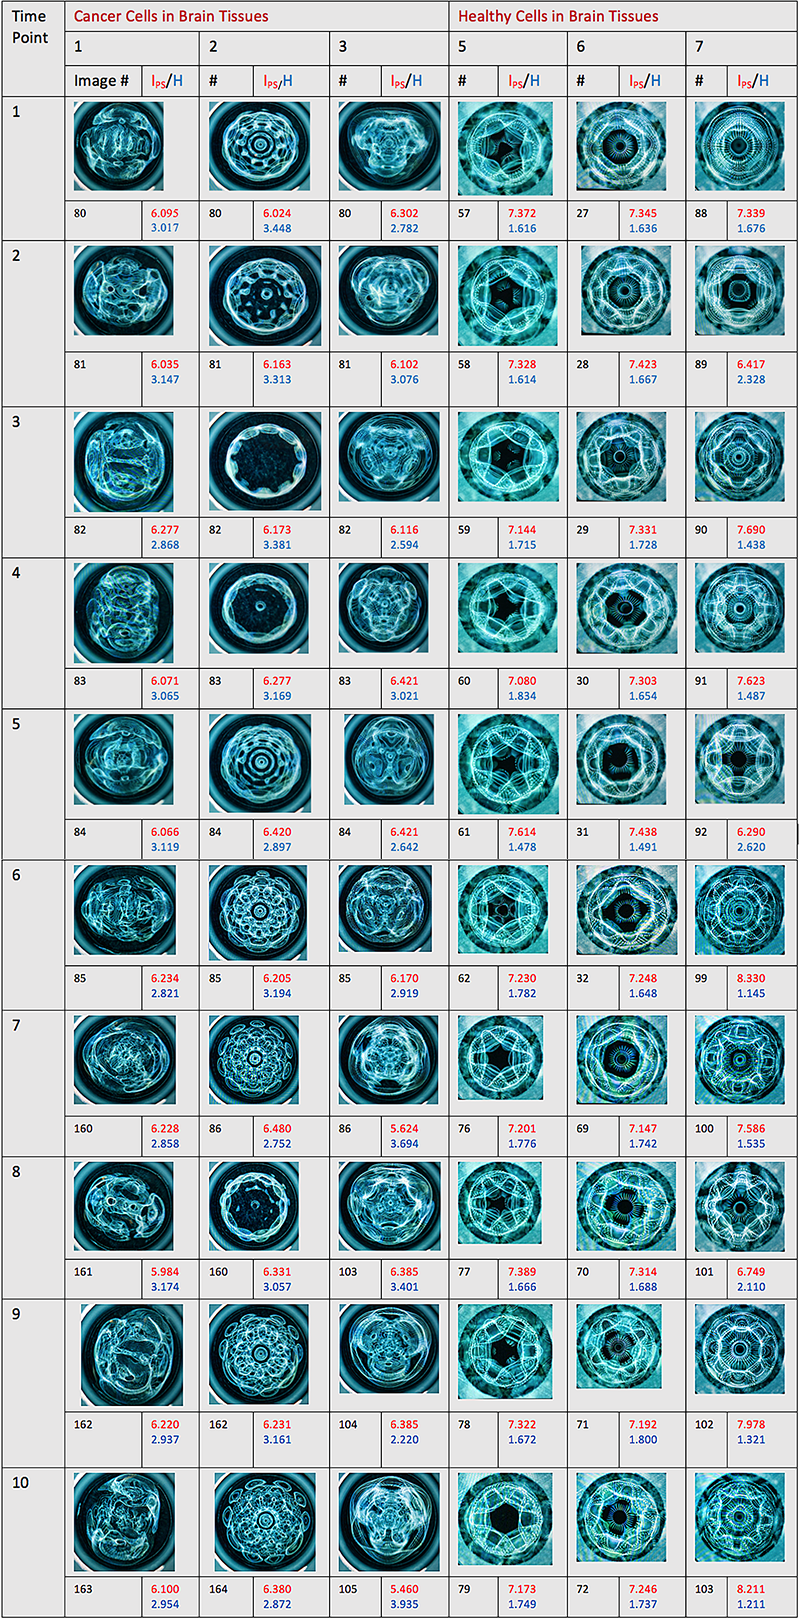
Table 2. The Planck-Shannon Classifier-based analysis of the cymascopic images of the sonified Raman signals from cancer and healthy cells measured by Stables et al. [1]. IPS (Planckian information of the second kind; red numbers) and H (Shannon entropy; blue numbers) were calculated via Eqs. 4 and 5 described in Materials and Methods. Each cymascopic image represents a 41.66 milliseconds time frame, captured by the Blackmagic Cinema camera. Ten images of each cell sample were taken at 10 different time points.
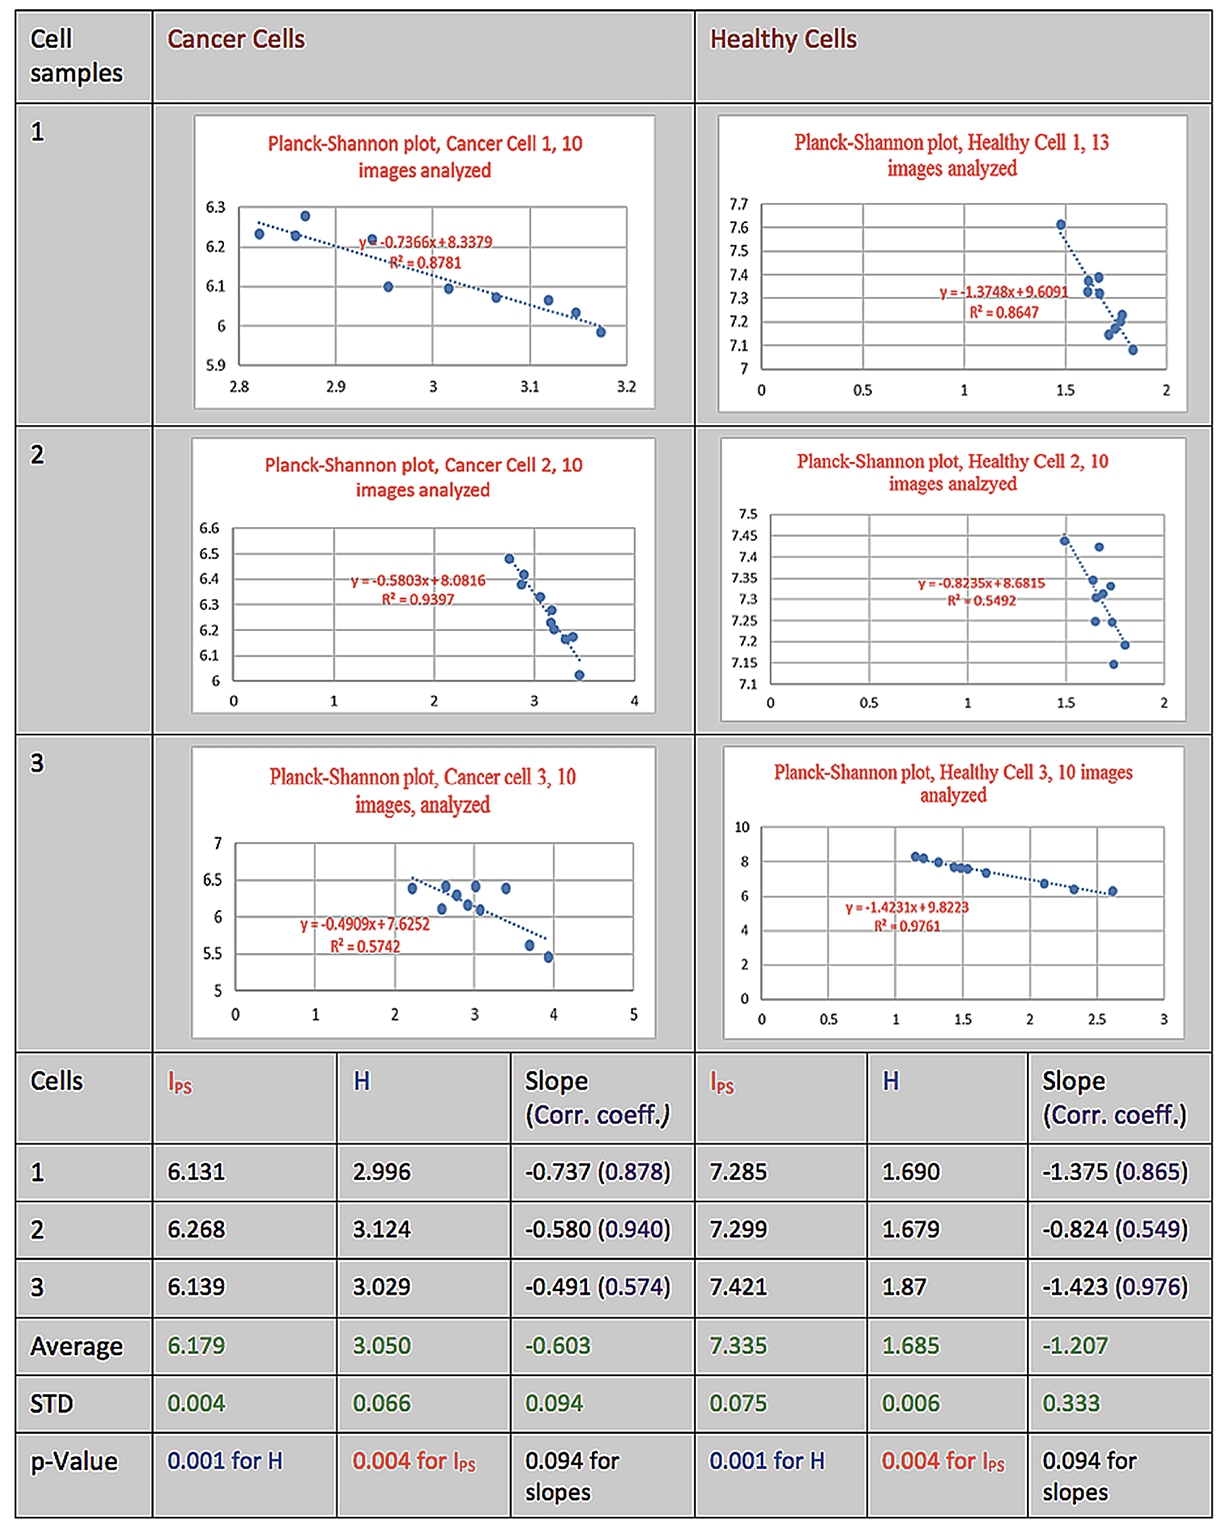
Figure 3. In this table the data set out in Table 1 is plotted as a Planck-Shannon plot, providing a classifier-based analysis of the Faraday Wave images of the sonified Raman signals from cancer and healthy cells in human brain tissues. H and IPS were calculated as described in Materials and Methods.
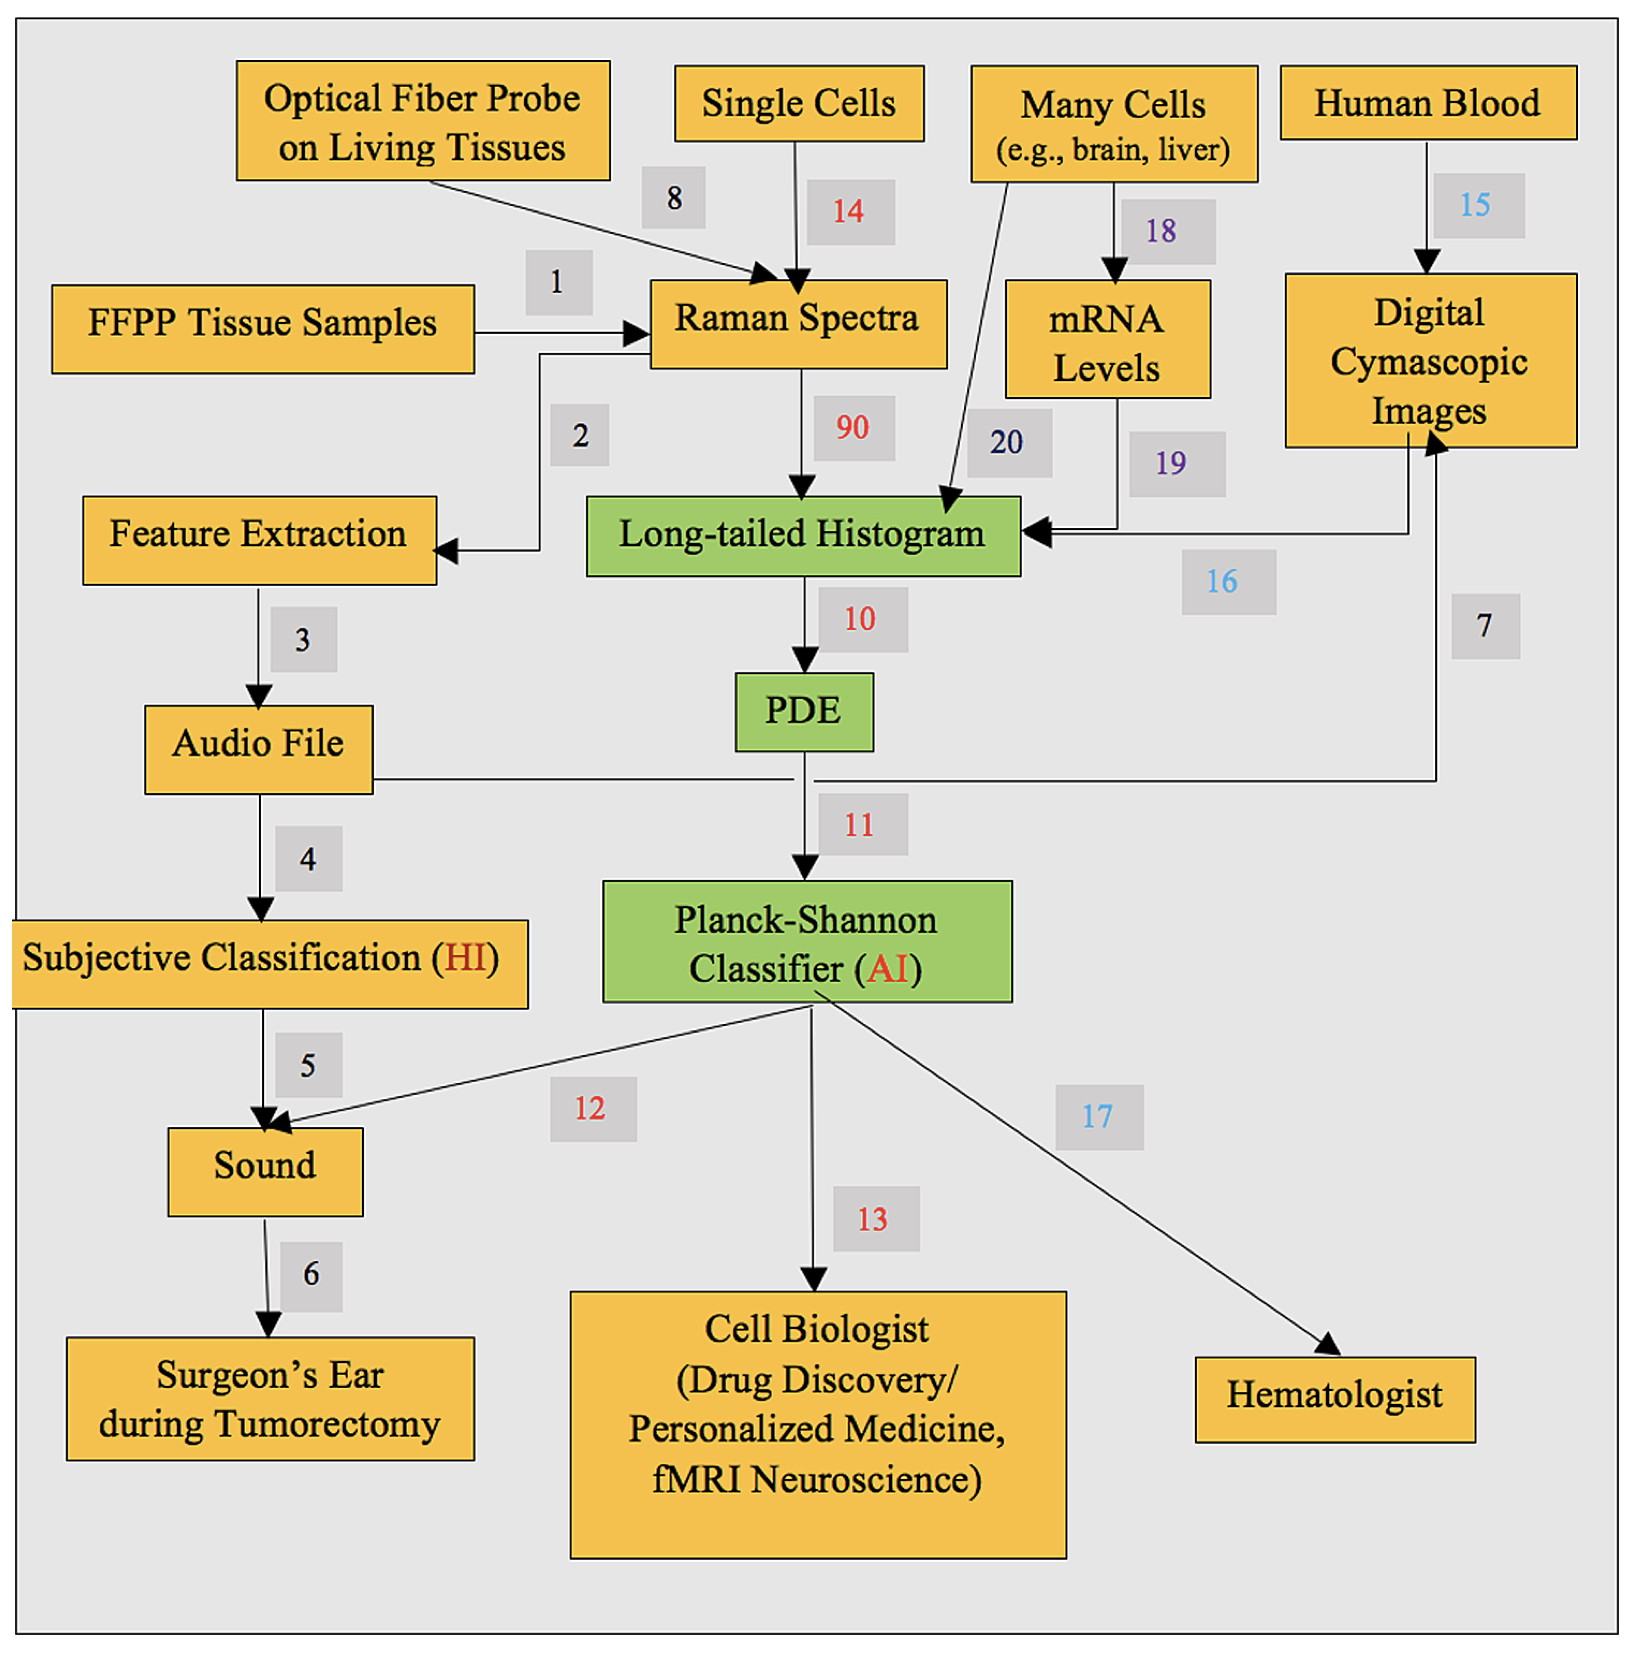
Figure 4. Potential applications of the Planckian-Shannon classifier in tumorectomy, cell biology, and hematology.
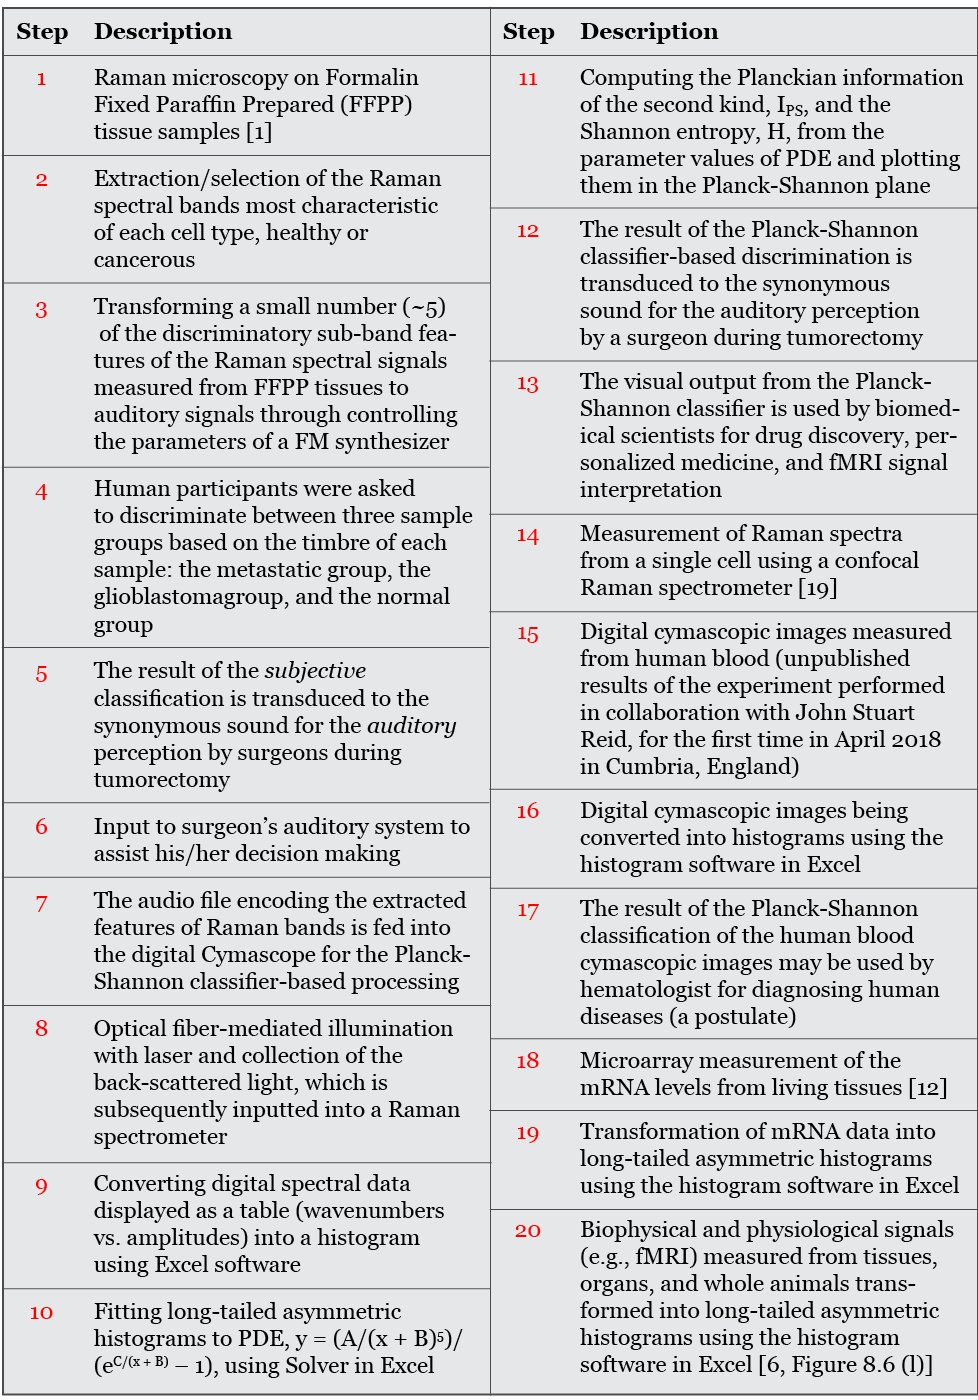
Table 3. Explanations of the steps in Figure 4.
Results
The cymascopic Faraday Wave images and data displayed in Table 1 relate to the first three sonified Raman signals of cancer cells, and the first three sonified Raman signals of healthy cells. The imagery in Table 2 was generated cymascopically from the Raman-derived cancer cell sounds and Raman-derived healthy cell sounds, as discussed in Material and Methods. A visual comparison of the Faraday Wave images in these two classes reveals that many of the frames show skewed geometry for Raman-derived cancer cell sounds and regular geometry for Raman-derived healthy cell sounds.
Conclusions
Between 2017-2018 a novel experimental tool was developed that combines the digital Cymascope and the Planck-Shannon classifier (PSC) to produce what may be referred to as “PSC-based cymascopy,” “PSC cymascopy,” or just PSCC. In this paper, we have demonstrated that PSCC can distinguish between the audio files generated from cancer and healthy cells in human brain tissues that may contribute to eventually developing an AI-based surgical procedure for removing tumors from human brains. In this procedure, the surgeon would wear spectacles with head-up integral display, driven by a species of digital Cymascope, thus revealing a tumor’s margins.
Encouraged by our preliminary results, we have been led to postulate that PSCC can be applied to investigating other complex physical phenomena and biomedical systems, both normal and diseased, including fMRI [6, p. 344], hematology, single-cell metabolism [6, p. 343], single-molecule enzymology [6, p. 344].
Acknowledgements
The authors thank Drs. R. Stables and M. Baker for providing the audio files of Raman signals generated from cancer and healthy cells of human brain tissues, and Sayer Ji of GreenMedInfo, https://www.greenmedinfo.com/, for providing the financial support required to convert the analogue Cymascope instrument to the digital Cymascope instrument in 2017, without which the present research would not have been possible.
References
[1] Stables R., Clemens G., Butler H. J., et al. (2017). Feature driven classification of Raman spectra for real-time spectral brain tumor diagnosis using sound. Analyst 142: 98-109.
[2] Guttman, D., et al, (2005). Hearing What the Eyes See. Auditory Encoding of Visual Temporal Sequences, Psychol Sci. 2005 Mar: 16(3): 228-235.
[3] Ullmann, D. (2007). Life and work of E.F.F. Chladni. The European Physical Journal Special Topics 145 (1): 25–32.
[4] Sheldrake, M., Sheldrake, R. (2017). Determinants of Faraday Wave-Patterns in Water Samples Oscillated Vertically at a Range of Frequencies from 50-200 Hz. Water 9:1-22.
[5] Ji S. (2012). Molecular Theory of the Living Cell: Concepts, Molecular Mechanisms, and Biomedical Applications. Springer, New York.
[6] Ji S. (2018). The Cell Language Theory: Connecting Mind and Matter. World Scientific Publishing, New Jersey.
[7] Ji S. (2015). Planckian distributions in molecular machines, living cells, and brains: The wave-particle duality in biomedical sciences. In: Proceedings of the International Conference on Biology and Biomedical Engineering, Vienna, March 15-17, pp. 115-137.
[8] Ji S. (2017). Waves as the Symmetry Principle Underlying Cosmic, Cell, and Human Languages. Information 8(1), 24, 2017.
[9] Ji, S., Park, B. J., and Reid, J. S. (2020). Planck-Shannon classifier: A novel method to discriminate between sonified Raman signals from cancer and healthy cells. In: Hu Z., Petoukhov S., He M. (eds) Advances in Artificial Systems for Medicine and Education II. AIMEE2018 2018. Advances in Intelligent Systems and Computing, vol 902. Springer, Cham.
[10] Marijuan, P. C., del Moral, R., Ji, S., Lacruz, M. G., andGomez-Quintero, J. D. (2019). Fundamental, Quantitative Traits of the “Sociotypes.” BioSystems 180:79-84.
[11] Lu H. P., Xun L., Xie X. S. (1998). Single-Molecule Enzymatic Dynamics. Science 282: 1877-1882.
[12] Perou C. M., Sorlie T., Eisen M. B., et al. (2000). Molecular portraits of human breast Tumors. Nature 406(6797): 747-52.
[13] Riedl, M. J. (2001). Optical Design Fundamentals for Infrared Systems, Second Edition.
[14] Reid, J. S. (2004). The Science of the CymaScope.
[15] Douady, S. (1990). Experimental study of the Faraday instability. J. Fluid Mech. 221: 383-409
[16] Ji, S. (2015). Planckian Information (IP): A New Measure of Order in Atoms, Enzymes, Cells, Brains, Human Societies, and the Cosmos. In: Unified Field Mechanics: Natural Science beyond the Veil of Spacetime (Amoroso, R., Rowlands, P., and Kauffman, L. eds.), World Scientific, New Jersey, 2015, pp. 579-589).
[17] Ji, S. (2018). RASER Model of Single-Molecule Enzyme Catalysis and Its Application to the Ribosome Structure and Function. Arch. Mol. Med. Genetics 1(1): 31-39.
[18] Ji S. (2019). Planck-Shannon plots (PSP), Superstructures, and Consciousness Quantification. A lecture delivered at the Foundation of Mind Resident Summer School, Siena, Italy, August 26, 2019.
[19] Cheng J.-X., Xie X. S. (2015). Vibrational spectroscopic imaging of living systems: An emerging platform for biology and medicine. Science 350 (6264) aaa8870.