
 Long Term Order in Infrared Absorption Spectra of Water Subjected to Weak Electromagnetic Influence
Korenbaum V1,2*, Chernysheva T3, Sergeev A4, Galay V3, Galay R3 and Zakharkov S1
1Pacific Oceanological Institute, Far Eastern Branch of Russian Academy of Science, Vladivostok, Russia
2Theoretical and Experimental Physics Department, School of Natural Science, Far Eastern Federal University, Vladivostok
3Clinics of Functional Medicine “Manus”, Vladivostok
4Institute for Automation and Control Processes, Far Eastern Branch of Russian Academy of Science, Vladivostok
*Correspondence E-mail: v-kor@poi.dvo.ru
Key Words: Water, Saline solution, Distilled water, Electronic copying, Homeopathy, Hidden control, Infrared absorption spectroscopy, Double blind study, Statistics, Significant differences, Planck’s energy increments
Received May 7th, 2013; Accepted May 10th, 2013; Published May 27th, 2013; Available online June 10th, 2013
Abstract
The ability of water to respond to external influences has been considered for many years. So-called electronic copying, based on this phenomenon, is widely used in complementary medicine. To reject or confirm the validity of the copying phenomenon scientifically has been a challenge. Here, the absorption spectra of electronic copies of seven parent substances were studied using a double blind procedure in three independent series of experiments. The carrier was saline solution or med-ical-grade distilled water (factory-sealed ampoules). Spectral readings of electronic copies were compared with hidden controls. Statistically significant distinctions were found at some wavelengths between 3000 nm and 1400 nm in all three experiments. The wavelengths revealed a kind of order in their positions. Both observations imply long-term response of water to the weak electromagnetic influence involved in electronic copying.
Article Outline
- Introduction
- Materials and Methods
- Results
- Results and Discussion
- Conclusions
- Acknowledgements
- Author’s Contributions
- References
- Discussion with Reviewers
Introduction
The ability of water to respond to external influences during long periods after exposure — the so-called “water memory” phenomenon — has been discussed widely especially with regard to homeopathy [Davenas et al. (1988); Thomas (2007); Roy et al. (2005); Lo et al. (1996)]. Highly diluted water solutions of parent bio-active substances have been used in homeopathy for approximately 200 years, with empirical evidence confirming their effectiveness in treatment of both people and animals [Towsey and Hasan (1995)]. Furthermore, besides homeopathic remedies prepared by the conventional dilution/succussion procedure, homeopathic preparations pre-pared on the basis of electronic copying of parent bio-active substances have received a certain acceptance in complementary medicine (see, for example, [Towsey and Hasan (1995); Pothmann et al. (2001)]. This acceptance has come in spite of a significant deficit of objective scientific data on the biomedical efficacy of electronic copies. Several types of devices for electronic copying are available. The earliest was the “radionic” magneto-geometric copying apparatus, invented by M. Rae [Towsey and Hasan (1995)]. Recently, similar electronic copying technique was developed by J. Benveniste’s team [Thomas et al. (2000); Thomas (2007)] and [Montagnier et al. (2009)]. The physical basis of electronic copying is unclear but there are several suppositions linking it with interaction of external electromagnetic fields [Towsey and Hasan (1995); Montagnier et al. 2009)] and electromagnetic fields generated by the human operator [Korenbaum et al. (2003); Web. ref. 1]. There are few empirical observations on the similarity of biomedical action of electronic copies to their parent substances or to conventional homeopathic preparations of these parent substances [Davenas et al. (1988); Thomas (2007); Towsey and Hasan (1995); Montagnier et al. (2009); Jonas et al. (2006)]. However, the quality of electronic copying was found to be operator dependent [Towsey and Hasan (1995); Montagnier et al. (2009); Jonas et al. (2006)]. Furthermore the specificity (extra placebo effect) is under question now even for conventional homeopathic remedies [Shang et al. (2005)].
Objective physical studies are necessary to reject or confirm the validity of electronic copying. One approach may be the use of absorption spectroscopy of water-based electronic copies (see [Marschollek et al. (2010)] for example). However, this procedure must be strictly double-blind in order to avoid possible bias of experimenters. The present authors previously developed a double-blind experimental procedure and carried out a pilot study [Korenbaum et al. (2006)]. The goal of current study is independent double blind estimation and analysis of differences between water-based electronic copies and blank water carrier in an extended spectral band.
Materials and Methods
The main concept in the experimental design was the comparison of absorption spectra of samples of electronic copies of various parent substances with blank carrier samples. The latter samples are referred to as hidden (blind) controls. All samples were prepared and their spectra were evaluated according to a double blind procedure. Absorption spectra of samples were measured by means of a spectrophotometer. The spectra were compared at each wavelength to look for statistically significant distinctions between the ensemble of samples of electronic copies of each parent substance and the ensemble of samples of hidden controls (acting as a kind of placebo).
Three independent series of experiments with the same parent substances were carried out. In the first and second experiments the carrier was a sterile saline solution (NaCl 9%) while in the third experiment it was medical-grade distilled water. Both were contained in 5-ml factory sealed ampoules.
All parent bio-active substances were water-based homeopathic preparations, encapsulated in tightly sealed glass vials. Seven types of parent bio-active substances were used:
1) DNA-tox (DNA) – indicator of DNA problems caused by exposure of organism to toxic agents (Manus, Russian Federation) – electronic copy of preparation from cassettes for vegetative resonance test produced by IMEDIS, RU [Web. ref. 2];
2) Bacteria (B) – superposition of 75 pathogenic bacteria at 6D potencies (Meripharm GmbH, Germany);
3) Manus (MAN) – harmonizing preparation (Manus, Russian Federation) – electronic copy of 50% tincture of Eleutherococcus;
4) Fungi (FUN) – superposition (Metabolics Ltd, United Kingdom) of 17 pathogenic fungi at 30x potencies (Ainsworth’s Homeopathic Pharmacy London UK);
5) Toxic metal (TM) – superposition (Metabolics Ltd, United Kingdom) of 27 salts of heavy metals and toxic metals at 30x, 200x and 1m potencies (Ainsworth’s Homeopathic Pharmacy London UK);
6) Virus (VIR) – superposition of 41 pathogenic viruses at 6D, 8D potencies (Meripharm GmbH, Germany);
7) Degeneration (DEG) – super-position of 41 oncologic cultures at 6D, 12D, 30D potencies (Meripharm GmbH, Germany).
In each experiment 200 sealed ampoules from one factory lot were randomly numbered from 1 to 190. The remaining ten ampoules were left unnumbered. We produced 19 electronic copies (EC) of each parent substance — a total of 133 ampoules. We also produced 57 ampoules of hidden controls (HC).
The hidden control ampoules were randomly divided into three groups (HC1, HC2, HC3), each consisting of nineteen samples. Every EC and HC ampoule was packed individually in aluminum foil, to protect from external electromagnetic fields. The correspondence between the ampoule number and sample type (ECs, HCs) was recorded in the protocol that was not opened until the completion of spectral analysis and the recording all spectral files. In order to provide a double-blind procedure the persons involved in numbering and copying did not participate in the subsequent spectral measurement and statistical processing. The remaining unnumbered ten ampoules were reserved for use as so-called working controls (not blind blank carrier) needed for double-beam spectrophotometer operation as reference substance.
To make electronic copies of parent substances a «Simulator» (Metabolics Ltd, UK) was used. The simulator is modeled after the original device of M. Rae [Towsey and Hasan (1995)]. The apparatus contains two copper containers, connected in induction loop, one of which (M) is meant to house the parent substance to be copied, whereas the second one (C) is meant to house the prepared electronic copy. In accordance with basic “radionic” hypothesis [Towsey and Hasan (1995)] “the effect of the parent substance is to modulate magnetic field, which in turn structures water crystals of the copy”. We suppose that any such copying action, if real, may be based on weak influence of the electromagnetic field of the human operator, in conjunction with the influence of external natural electromagnetic fields on copied preparations [Korenbaum et al. (2003); Web ref. 1].
The copying procedure was made according to the apparatus’s manual. At first, an operation of “deleting information” was carried out. For this purpose one or two ampoules were sequentially placed into the container “C”, whereas the container “M” was left empty. The operator pressed the appropriate button of the apparatus. No other manipulations were performed with the hidden control ampoules or with the working control ampoules. When preparing the electronic copy, the vial with the parent bio-active substance was inserted into the apparatus container “M,” and the prepared samples (ampoules) were sequentially placed into container “C.” The operator pressed the appropriate button to make the electronic copy. Since the quality of the copying procedure might be operator-dependent [Towsey and Hasan (1995); Web ref. 1; Jonas et al. (2006)], all investigated preparations were made by one and the same person (V.G.) in all three experiments.
The absorption spectra of preparations under study were determined within 5-10 days after completing the electronic copying procedure. Spectral measurements for each experiment were performed over four days due to the large number of samples. Measurements were made by means of a Varian Cary 5000i (Agilent Technologies, USA) double-beam analytical spectrophotometer in the wave band 3000 – 600 nm with intervals of 0.5 nm. (Width of spectral window – 0.5 nm, accumulation time – 0.1 s, scan speed – 300 nm/min, change of detector at 800 nm, change of filters at 1200 nm and 2000 nm). The apparatus was auto calibrated before each experiment. The values of transmission in percents relative to working control, i.e., the difference absorption spectrum of each sample, were written to the hard disk. The assigned number of the file corresponded to the number of the ampoule investigated.
Every ampoule was opened just before measurement, and the contents were injected with a disposable syringe into a measuring cuvette made of quartz. The cuvette was a rectangular parallelepiped 4.5 cm in height, 1 mm wall thickness, and working volume of 3 ml. An identical control cuvette was filled once for every day of measurement with the contents of an arbitrarily taken ampoule of working control. The latter was placed in one chamber of the double-beam spectrophotometer, and left there throughout the entirety of that day’s measurement. The measuring cuvette with investigated contents was placed into the other chamber of the spectrophotometer. A difference absorption spectrum was then recorded. After recording the spectral file, the contents of the measuring cuvette were emptied and the cuvette was flushed with pure carrier solution (saline solution in the first and the second experiments and medical-grade distilled water in the third one). Once the experiment was finished, the numbering protocol was broken and the spectral files were sorted by the parent ECs or HCs. All EC files corresponding to a given parent bio-active substance were collected into one group. During statistical processing each spectral reading of every EC, represented by the ensemble of samples, was compared with every group of HC, represented by the ensemble of samples, using a Mann-Whitney non-parametric U-test (Statistica, StatSoft Inc.). Any wavelengths with significant differences (p < 0.05) between EC and HC were registered. We recorded the Zadj value of the Mann-Whitney non-parametric U-test, describing Z (Normal) statistics being the base for p evaluation (Statistica, StatSoft Inc.). Thereupon we selected those wavelengths in which the significant differences of the same direction indicated in the sign of Zadj were observed when comparing EC with all three groups of hidden controls (HC1, HC2, HC3). Total values of Zadj were evaluated for each selected wavelength. Hidden control groups were also compared to each other in three pairs: HC1 re HC2, HC1 re HC3 and HC2 re HC3. This multiple comparison was a reference test evaluating threshold of essential difference. The procedure for data processing, though not blind, was predetermined and identical for all experiments.
Results
Regarding the hidden controls, we found no wavelengths where we could find significant differences between all three pairs of hidden controls (HC1 re HC2, HC1 re HC3 and HC2 re HC3). There were only some wavelengths where significant differences were observed for two pairs. Thus to provide the threshold of essential difference in evaluation of ECs spectra it is necessary to search wavelengths with significant differences relative to all three HCs.
The wavelengths found in experiment 1 where the carrier was saline solution are summarized in Table 1. Each EC type has some wavelengths where significant differences are observed relative to all three groups of hid-den controls (Table 1). Such differences are statistically significant. Furthermore, the identical direction (sign of Zadj) of differences from all three hidden control groups amplifies the reliability of these distinctions (Table 1). One can see that there are 7 – 17 such wavelengths for every EC type.
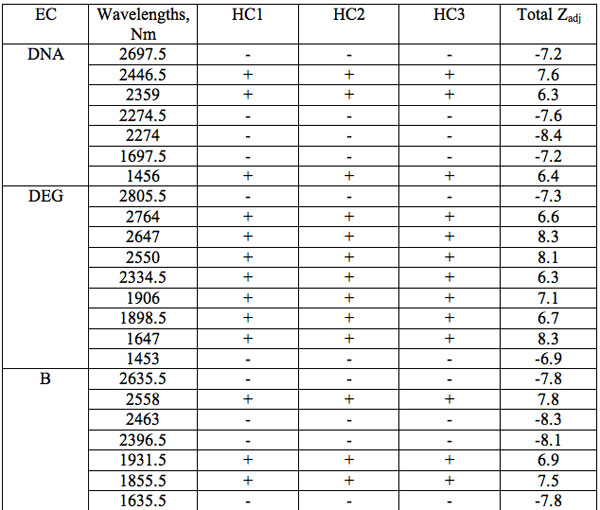
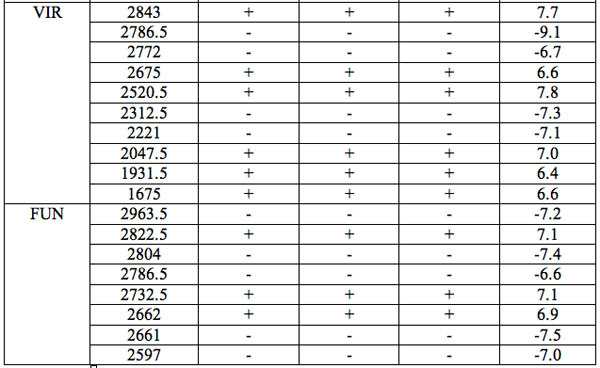
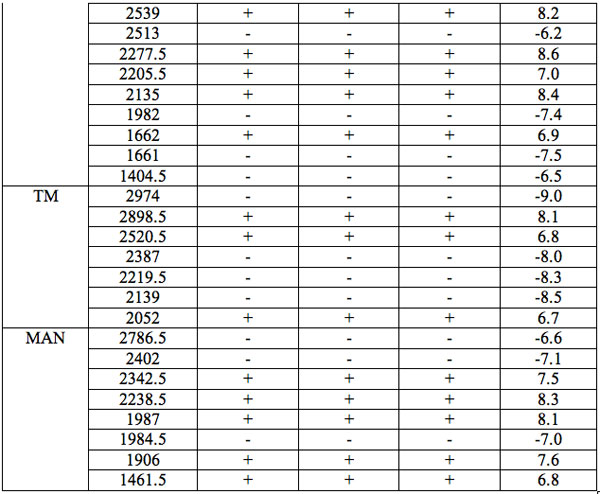
Table 1: Wavelengths of statistically essential distinctions of EC preparations re three hidden control groups (Experiment 1): Zadj – adjusted Z(Normal) Probability Distribution value of Mann-Whitney U-test (Statistica, StatSoft Inc.), + positive sign of Zadj, – negative sign of Zadj, total Zadj is the sum of Zadj obtained in each comparison.
All wavelengths with significant differences (Table 1) found in experiment 1 (saline) are arranged as λi in Table 2a in the order from long to short wavelengths. Analogous data for experiment 2 (saline) are represented in Table 2b; and for experiment 3 (medical grade distilled water) in Table 2c. One can see that wavelengths with significant distinctions are met in all three experiments. They are located in the band of 3000 – 1400 nm. However the number of such wavelengths varies in EC types and in different experiments.
 with significant distinctions relative to three hidden control groups by EC types (experiment 1).")
Table 2a: Ranged wavelengths λi (nm) with significant distinctions relative to three hidden control groups by EC types (experiment 1).
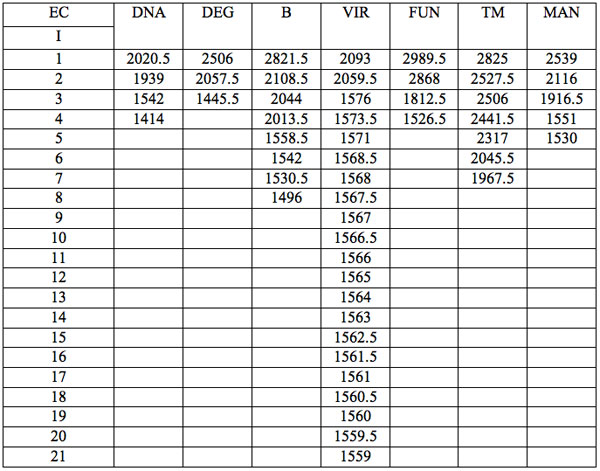

Table 2b: Ranged wavelengths λi (nm) with significant distinctions relative to three hidden control groups by EC types (experiment 2).
To study distribution of wavelengths with significant distinctions in analyzed spectral band irrespective of EC type, histograms were calculated (Microcal Origin, Micro-cal Software Inc.). Resulting counts of histograms obtained in all experiments are represented in Table 3. There are evident maxima of histograms in each experiment. They are located near 1525-1675 nm, 1975-2125 nm, 2275-2425 nm, 2725-2875 nm. However, the location of peaks differs in various experiments. To look for any system in the wavelengths’ position, we calculated the ratios between adjacent ranged wavelengths λi+1/λi for each EC type. Results obtained for experiment 1 (saline) are represented in Table 4. The histogram of all ratios (Microcal Origin, Microcal Software Inc.) is plotted in Figure 1a and its counts are listed in Table 5a. One can see in both Figure 1a and Table 5a that the ratio λi+1/λi ~ 0.965 is seen consistently as a histogram maximum.
 with significant distinctions relative to three hidden control groups by EC types (experiment 3).")
Table 2c: Ranged wavelengths λi (nm) with significant distinctions relative to three hidden control groups by EC types (experiment 3).

Table 3: Counts of histograms of wavelengths with significant distinctions irrespective of EC type.
 by ECs (experiment 1).")
Table 4: Ratios λi+1/λi of wavelengths with significant distinctions (Table 2a) by ECs (experiment 1).

Figure 1a: Histogram of ratios λi+1 / λi summarized for all ECs of experiment 1. Data taken from Table 4.

Figure 1b: Histogram of ratios λi+1 / λi summarized for all ECs of experiment 2.

Figure 1c: Histogram of ratios λi+1 / λi summarized for all ECs of experiment 3.
 in experiment 1 with approximate peaks of Equation 1.")
Table 5a: Count and percentage of histogram of ratios λi+1 / λi (Figure 1a) in experiment 1 with approximate peaks of Equation 1.
 in experiment 2 with approximate peaks of Equation 1.")
Table 5b: Count and percentage of histogram of ratios λi+1 / λi (Figure 1b) in experiment 2 with approximate peaks of Equation 1.
 in experiment 3 with approximate peaks of Equation 1.")
Table 5c: Count and percentage of histogram of ratios λi+1 / λi (Figure 1c) in experiment 3 with approximate peaks of Equation 1.
 according to Eq. 2 between adjacent wavelengths (Table 2a) found in experiment 1.")
Table 6: Increments of Planck’s energy (∆E, J) according to Eq. 2 between adjacent wavelengths (Table 2a) found in experiment 1.

Figure 2a: Histogram of increments of energy ∆E summarized for all ECs of experiment 1. Data taken from Table 5.

Figure 2b: Histogram of increments of energy ∆E summarized for all ECs of experiment 2.
Furthermore the empirical equation:
(1) λi+1≈(0.965)n λi
may be supposed for locations of maxima of this histogram, where n is an integer number. Analogous data are represented in Figure 1b and Table 5b for experiment 2 (saline), and in Figure 1c and Table 5c for experiment 3 (medical grade distilled water). One can see that in all three experiments there are evident histogram peaks whose locations correspond to Equation 1. This ordered spectral feature is similar to a kind of spectral series.
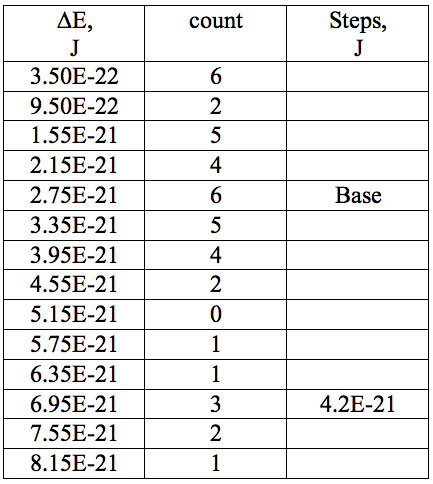
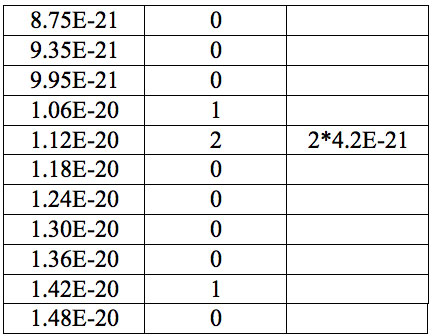
Table 7a: Count and periodic steps of histogram of increments of energy ∆E (Fig. 2a) found in experiment 1.

Figure 2c: Histogram of increments of energy ∆E summarized for all ECs of experiment 3.
 found in experiment 2.")
Table 7b: Count and periodic steps of histogram of increments of energy ∆E (Fig. 2b) found in experiment 2.
Additionally, to analyze the nature of the absorption wavelengths with significant distinctions we calculated increments of Planck’s energy under transition from λi+1 to λi, i.e. between adjacent wavelengths as:
(2) ∆E = hc(1/λi+1 – 1/λi)
where h = Planck’s constant, c = electromagnetic wave speed in a vacuum. These energy increments for experiment 1 are listed in Table 6. They characterize energy absorption of the analyzed substances and may reflect its quantum nature. To reveal this nature the histogram of increments of Planck’s energy was constructed (Fig. 2a, Table 7a), which summarizes results for all EC types in experiment 1. It has a main peak near 2.75E-21 J and evident side lobes with steady periodicity (approximately 4.2E-21 J). Analogous data are represented in the Figure 2b and Table 7b for experiment 2 (saline), in the Figure 2c and Table 7c for experiment 3 (medical distilled water). In experiment 2 (Fig. 2b, Table 7b) the main peak is near 3.9E-22 J and the step is approximately 3.75E-21 J, while in the experiment 3 (Fig. 2c, Table 7c) the main peak is near 1.45E-21 J and periodical lobes with the step of approximately 5E-21 J are observed. The value of energy increments will be discussed below.
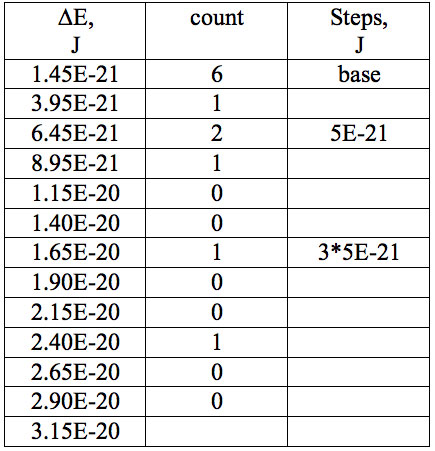
Table 7a: Count and periodic steps of histogram of increments of energy ∆E (Fig. 2c) found in experiment 3.
Results and Discussion
Basic Findings and Their Reliability
Several interesting results were found in this study.
The first is that there are wavelengths with significant distinctions for each EC type in all three independent experiments. Such wavelengths were present irrespective of the carriers used, which were saline solution in the first and second experiments, and medical-grade distilled water in the third experiment. However the number of wavelengths found for different EC types varied considerably. It should be especially noted that observed wavelengths characterize the long term response of water because they were observed 5-10 days after weak electromagnetic exposure (electronic copying).
As for the statistical significance of wavelengths found, we made 24 paired statistical comparisons for every wave-length in each experiment. Therefore, according to Bonferroni’s correction, the significance level must be divided by the number of comparisons p < 0.05/24 = 2.1*10-3. However, the wavelengths in each experiment (see Table 1) were found under the cumulative condition of total |Zadj| > 6, which coordinates to p < 0.053 = 1.25* 10-4, achieved under comparison of an EC type with all 3 HCs. This is at least one order of magnitude better than demanded by Bonferroni’s correction. Furthermore, the statistical significance of spectral distinctions of ECs is enhanced by the fact that there were found no such wavelengths with significant differences in reference tests involving comparison between three pairs of hidden controls (HC1 re HC2, HC1 re HC3 and HC2 re HC3). Identical direction of differences of investigated ECs from all 3 HC groups amplifies the significance of these distinctions too. Thus the chance of accidental revelation of these wavelengths seems vanishingly small.
Another question is whether these distinctions might be due to apparatus error. On one hand, none of the revealed wavelengths (Tables 2a, b, c) are close to the specific wavelengths of changing detector (800 nm) or filters (1200 and 2000 nm) of the spectrophotometer. On the other hand a bias in spectral estimates is possible between two beams of the spectrophotometer or between the cuvette with investigated preparation and cuvette with working control. However all investigated preparations (ECs and HCs) were measured in the same cuvette, and consequently in one beam of the spectrophotometer. The second beam was used only for the working control. The ECs and HCs were poured into the same cuvette and measured in the same chamber of the spectrophotometer but in random order. Thus, the identified wavelengths may not be attributed to any apparatus bias or drift.
The second interesting result is that the revealed wavelengths are located in the band from 3000 nm down to 1400 nm. No wavelengths appeared below 1400 nm.
There are very closely located wavelengths (adjacent spectral readings in 0.5 nm) in each experiment. For example in experiment 1 (Table 2a), there are wavelengths 2274.5 nm and 2274 nm in spectrum of EC DNA. Furthermore, directions of differences relative to hidden controls are identical for these wavelengths (Table 1). Also there are very closely located (1 nm) pairs of wavelengths in the spectrum of EC FUN: 2662 nm and 2661 nm; 1662 nm and 1661 nm, but having various directions of differences relative to hidden control. Has the direction of differences relative to hidden control any system? It is not clear because there is only one EC DEG with apparent domination of one direction (+) in its spectrum (Table 1), while in other ECs spectra directions (+) and (-) are mixed with approximately equal probability. A similar picture is observed in other experiments. Thus, the direction of distinctions seems to be not so important.
Although the wavelengths’ rows (Table 2a) seem to be individual for each EC type, there are identical wavelengths which are identified in various ECs spectra: 2876.5 nm (VIR, FUN, MAN); 1931.5 nm (B, VIR); 1906 nm (DEG, MAN). Additionally there are some wavelengths quite closely located (in limits of about 5 nm) in various ECs: 2805.5 nm – DEG and 2804 nm – FUN; 2221 nm – VIR and 2219.5 nm – TM; 2047.5 nm – VIR and 2052 nm – TM; 1456 nm – DNA, 1453 nm – DEG and 1461.5 nm – MAN. A similar picture is observed in other experiments.
Are the wavelengths’ columns (Table 2a, b, c) specific for each EC type? It seems doubtful because there are many more similar wavelengths (within 5 nm limits) between various ECs in the same experiment than between the same EC types in different experiments. This is the third interesting result of the study. However additional investigations are necessary to look for reproducibility of all these wavelengths for every EC type.
Looking for a System in Positions of Identified Wavelengths
If the revealed wavelengths are non specific to EC type, then we may evaluate their common histograms in each experiment (Table 3) irrespectively of EC type. It is interesting that there are evident peaks of histograms lying close to typical water molecular vibration resonances [Web ref. 3]: 3050 nm (v3 – asymmetric stretch), 2870 nm (v1 – symmetric stretch), 1900 nm (av1 + v2 + bv3, a+b=1 – combined overtone of strectch v1, v3 and bend v2 modes), 1470 nm (av1 + bv3, a+b=2 – combined overtone of strectch v1, v3 modes). However various resonances are more or less dominant for different experiments (Table 3). So in experiment 1 wavelengths positioned close to 2870 and 1900 nm are more frequently represented. Meanwhile in the experiment 2, 1470 nm dominates and in experiment 3, 1900 nm is the most frequent mode. This observation shows good coordination between at least some of the revealed wavelengths and classical water molecule resonances, and additionally underlines the non-accidental character of identified wavelengths. On the other hand, variation of dominant resonances among different experiments may be also treated in favor of non specific effects.
We now consider whether the wavelengths fall into a systematic arrangement. For experiment 1 the calculated ratios between adjacent wavelengths λi+1/λi for each EC type, represented in Table 4, point to a frequent presence of ratio of about 0.96-0.97. If the influence of electronic copying on water is unspecific, we may also analyze all ratios irrespective of EC type. The histogram of all ratios (data from Table 4) is plotted in Figure 1a and its statistics are listed in Table 5a. One can see that the ratio λi+1/λi ~ 0.965 is seen as an evident maximum of the histogram (Fig. 1a, Table 5a). Furthermore, Eq. 1 may be constructed to describe the periodic maxima of this histogram. These periodic maxima cover approximately 58.5% of cases counted (Table 5a). It appears that some order emerges from the random noise. Such behavior of non random part of ratios looks like a spectral series being classical feature of quantum effects. Analogous behavior is also seen in experiment 2 (Fig. 1b, Table 5b), though it is smoothed by the first peak and covers only about 30% of counts. It is also seen in experiment 3 (Fig. 1c, Table 5c) with coverage of more than 50% of counts. Thus, quantum effects analysis must be involved looking for a system in found wavelengths positions.
To do such analysis, we calculate increments of Planck’s energy according to Eq. 2 under transition from λi+1 to λi, i.e. between adjacent wavelengths. For experiment 1 these increments are listed in Table 6. Their histogram (Fig. 2a, Table 7a) summarizes results for all EC types. It has the main peak near 2.75E-21 J and side lobes with steady periodicity (approximately 4.2E-21 J). Similar results are seen in other experiments. In experiment 2 (Fig. 2b, Table 7b) the main peak is near 3.9E-22 J and the step is approximately 3.75E-21 J. In experiment 3 (Fig. 2c, Table 7c) the main peak is near 1.45E-21 J and periodical lobes with the steps of approximately 5E-21 J are observed. Although base levels vary in all experiments the steps of energy increment are close to each other 3.75E-21 – 5E-21 J. Periodic steps of energy increment are well known to be characteristic of quantum effects. However, what are the effects? Perhaps the observed value of increments of Planck’s energy will be useful for explanation.
In Search of a Physical Mechanism
It is known [Web ref. 3] that the water molecule has certain orbitals with predetermined energy levels. Transition between these levels demands minimal energy absorption of order of 1 eV (1.6E-19 J). This value is about two orders of magnitude greater than the observed steps of Plank’s energy increments. Thus, the transition between water molecules orbitals is doubtful as the mechanism of the observed effects.
On the other hand, water molecules in liquid are connected by intermolecular hydrogen bonds. Liquid water consists of a mixture of strong and weak hydrogen bonds with many intermediate between these extremes [Web ref. 3]. There is an estimate [Chumaevskii and Rodnikova (2003)] of energies accumulated in these bonds as 20 – 3.6 kJ/mol. Dividing these values by Avogadro number, we can obtain energies of about 3.3E-20 – 6E-21 J for one water molecule or single hydrogen bond. The lower border of this interval seems to be very close to the above steps of Plank’s energy increments. It looks like that at least a part of found energy transitions between adjacent wavelengths may be attributed to switch on or switch off single hydrogen bonds. Alternative explanation may be found in the fine splitting of energetic levels of typical water molecular vibrational resonances observed in clusters of water molecules [Headrick et al. (2005)]. This splitting is even more subtle than the observed steps of Plank’s energy increments. It should be noted that both possible explanations involves supramolecular behavior.
Due to absence of any identified wavelengths and consequently order in spectra of blank water carrier (HCs), such cooperative effects of water molecules (perhaps in association with salts and impurities) may be the probable cause of phenomena revealed in ECs.
In conformity with the data of works [Lo et al. (1996); Web ref. 3; Chumaevskii and Rodnikova (2003); Headrick et al. (2005); Ponomarev and Fesenko (2000); Del Guidice et al. (1988)], it does not seem so incredible in the context of physics. In fact, according to [Lo et al. (1996)], extremely dilute solutions contain ice-like crystals (groups of water molecules). Called “IE crystals”, they are stable at room temperatures. Steady supramolecular structures are also referred in [Web ref. 3; Chumaevskii and Rodnikova (2003); Headrick et al. (2005)]. According to [Ponomarev and Fesenko (2000)] the dynamic state of liquid water is determined by the presence of a quasi-particle field (excitations, dislocations), so-called solitons, caused by relaxation of excited singlet oxygen molecules. According to [Del Guidice et al. (1988)] water contains long-living, coherent domains in quantum electrodynamic’s sense. All these supramolecular structures obviously may be subjected to influence of weak electromagnetic fields and therefore may be involved in long term response of water to weak electromagnetic influences.
Although there is no conclusive physical-chemical explanation of the revealed effects, the identified features of order in the wavelengths’ position themself enhance reliability of differences found in spectra of ECs and HCs. Thus, statistically significant distinctions of water-based ECs in comparison with a blank water carrier revealed in three independent double blind studies of infrared absorption spectra may be interpreted in favor of the reality of the electronic copying phenomenon. Since electronic copying is considered a version of electromagnetic field influence, the observed spectral phenomena may probably be generalized to other cases of weak electromagnetic field exposure.
Possible Limitations
The dependence of observed wavelengths on time was not studied. Only one human operator carried out the electronic copying, and the influence of the human operator’s individuality on the copying procedure was not investigated. Further, only one type of electronic copying apparatus was involved and only seven types of EC, chosen voluntarily, were analyzed. Reproducibility of the wavelengths specific for EC types as well as for various water solutions need to be investigated further. Thus, additional studies will be required to overcome these limitations.
Conclusions
1. In three independent double blind studies, statistically significant distinctions were revealed in some wavelengths of near-infrared absorption spectra between a blank water carrier and water subjected to weak electromagnetic influence (electronic copying).
2. Some of the identified wavelengths having statistically significant distinctions compared to the blank carrier showed in each study good coordination with classical water molecular vibrational resonances as well as a kind of order in their position.
3. Histograms of Planck’s energy increments between adjacent wavelengths with statistically significant distinctions compared to the blank carrier showed a periodicity.
4. The observed steps of Planck’s energy increments are close by order to the energy of a single intermolecular hydrogen bond in liquid water as well as to fine splitting of energetic levels of typical water molecular vibrational resonances in clusters of water molecules.
5. The conclusions stated above are independent of whether the carrier was saline solution or medical-grade distilled water.
6. Both the statistically significant distinctions of some wavelengths and the signs of order found in the wavelength structure may be considered as favoring the reality of the long-term response of water to weak electromagnetic fields, particularly those involved by electronic copying.
Acknowledgements
Professor Gerald Pollack from the University of Washington (Seattle) is acknowledged for offering constructive comments.
Author’s Contributions
Vladimir Korenbaum: developing design of study involving spectral and statistical analysis, statistical analisys, physical inter-pretations, drafting manuscript.
Tatiana Chernysheva: developing design of study involving studied preparations, editing manuscript.
Alexander Sergeev: spectral analysis.
Victoria Galay: electronic copying, editing manuscript.
Roman Galay: preparing samples, num-bering protocol, editing manuscript.
Sergei Zakharkov: spectral analysis, phy-sical interpretations.
There are no conflicts of interest
References
Chumaevskii NA, Rodnikova MN (2003) Some peculiarities of liquid water structure. J. Molecular Liquids 106: 167-177.
Davenas E, Beauvais F, Amara J, Oberbaum M, Robinzon B, Miadonna A, Tedeschi A, Pomeranz B, Fortner P, Belon P, Saintelaudy J, Poitevin B, Benveniste J (1988) Human basophil degranulation triggered by very dilute antiserum against IgE. Nature 333(6176): 816-818.
Del Guidice E, Preparata G, Vitiello G (1988) Water as a free electric dipole laser. Physical Review Letters 61: 1085-1088.
Headrick JM, Diken EG, Walters RS, Hammer NI, Chritie R, Cui J, Myshakin EM, Duncan MA, Johnson MA, Jordan KD (2005) Spectral signatures of hydrated proton vibrations in water clusters. Science 308: 65-69.
Jonas WB, Ives JA, Rollwagen F, Denman DW, Hintz K, Hammer M, Crawford C, Henry K (2006) Can specific biological signals be digitized? FASEB J 20: 23-28.
Korenbaum VI, Chernysheva TN, Apukhtina TP, Shin SN, Demeniuk VN (2003) Effect of electronic homeopathic copy of biohumus fertilizer on tomato sprout development. Radiats Biol Radioecol 43: 370-374.
Korenbaum VI, Chernysheva TN, Apukhtina TP, Sovetnikova LN (2006) Absorption spectra of electronic-homoeopathic copies of homoeopathic nosodes and placebo have essential differences. Forsch Komplementmed 13: 294-297.
Lo SY, Lo A, Chong LW, Tianzhang L, Hua LH, Geng X (1996) Physical properties of water with IE structures. Modern Physics Letters B 10: 921-930.
Marschollek B, Nelle M, Wolf M, Baumgartner S, Heusser P, Wolf U (2010) Effects of exposure to physical factors on homeopathic preparations as determined by ultraviolet light spectroscopy. Scientific World Journal 8: 49-61.
Montagnier L, Aïssa J, Ferris S, Montagnier JL, Lavallée C (2009) Electromagnetic signals are produced by aqueous nanostructures derived from bacterial DNA sequences. Interdiscip Sci 1: 81-90.
Ponomarev OA, Fesenko EE (2000) Properties of liquid water in electric and magnetic fields. Biofizika 45: 379-388.
Pothmann R, von Frankenberg S, Hoicke C, Weingarten H, Ludtke R (2001) Evaluation of applied kinesiology in nutritional intolerance of childhood. Forsch Komplementarmed Klass Naturheilkd 8: 336-344.
Roy R, Tiller WA, Bell I, Hoover MR (2005) The structure of liquid water; novel insight from materials research; potential relevance to homeopathy. Materials Research Innovations 9: 577-608.
Shang A, Huwiler-Muntener K, Nartey L, Juni P, Dorig S, Sterne JA, Pewsner D, Egger M (2005) Are the clinical effects of homoeopathy placebo effects? Comparative study of placebo-controlled trials of homoeopathy and allopathy. Lancet 366: 726-732.
Thomas Y, Schiff M, Belkadi L, Jurgens P, Kahhak L, Benveniste J (2000) Activation of human neutrophils by electronically transmitted phorbol-myristate acetate. Medical Hypotheses 54: 33-39.
Thomas Y (2007) The history of the Memory of Water. Homeopathy 96: 151-157. Towsey MW, Hasan MY (1995) Homoeopathy – a biophysical point of view. Br Hom J 84: 218-228.
Web References
1. Korenbaum VI, Chernysheva TN. Study of water-based electronic-homeopathic nosodes. Report presented at the 4-th Conference on Physics, Chemistry and Biology of Water. October 22-25, 2009, Grand Summit Resort Hotel & Conference Center, Mount Snow, West Dover, Vermont, USA www.watercon.org/abstracts.html [04-27-2013].
2. Cassettes for vegetative resonance test produced by IMEDIS, RU http://imedis.ru/pages/175?topic=7 [04-27-2013].
3. Chaplin M. Water structure and science: Molecular vibration and absorption of water, Molecular Orbitals for Water (H2O), Hydrogen Bonding in Water. www.lsbu.ac.uk/water/index [04-27-2013].
Discussion with Reviewers
Anonymous Reviewer: From your experiments, could you draw some inference about how long the spectroscopic changes might last?
V. Korenbaum, T. Chernysheva, A. Sergeev, V. Galay, R. Galay and S. Zakharov: Unfortunately we have no information to do any conclusion on duration of the spectroscopic changes induced by electronic copying procedure. To answer the question we should make spectroscopic measurements of identical groups of preparations (synchronously copied) in some time stages. However it is very time consuming and bulky procedure to perform.
Reviewer: While the spectroscopic changes you measured were fairly predictable and consistent, can you speculate on why they were not perfectly predictable? Does this imply that homeopathic substances might have variable effectiveness?
Korenbaum, Chernysheva, Sergeev, Galay, Galay and Zakharov: One of the reasons of not perfect predictability is various initial conditions of solutions used in copying procedure (including season, temperature, lunar phase et al.). Another reason may be various conditions of human operator making copies. Finally stochastic nature of weak spectroscopic signals may be a reason. Really the effect implies that homeopathic substances (especially electronically copied) might have variable effectiveness.