
![]()
Storm Flow Generation in Artificially Drained Landscapes of the US Midwest: Matrix Flow, Macropore Flow, or Overland Flow
Vidon P1*, Hubbard H2, Cuadra PE2, Hennessy M2
1The State University of New York College of Environmental Science and Forestry, 1 Forestry Drive, Syracuse, NY, 13210
2Indiana University-Purdue University Indianapolis, 723 W. Michigan St., Indianapolis, IN, 46202
*Correspondence E-mail: pgvidon@esf.edu
Key Words: sub-surface drainage, watershed, flowpath, hydrograph separation, precipitation events, solutes
Received April 24th, 2012; Accepted December 10th, 2012; Published December 18th, 2012;
Available online Januray 5th, 2013
Summary
This study investigates the relative importance of macropore flow (MPF), matrix flow (MTF), and overland flow (OLF) in stream and tile drain flow (MPF and MTF only) in an artificially drained watershed for storms ranging from 1.02-4.45 cm in bulk precipitation. OLF occurrence was primarily associated with wet antecedent conditions, but not necessarily with high precipitation amounts. In the stream, MPF and OLF contributions to flow ranged from 0-40% and 0-58%, respectively; while MTF accounted for 42-100% of flow (mean = 72%). In tile drains, MTF contributions ranged from 32-63% of total flow (mean = 49%). Overall higher MTF contributions to flow in the stream than in tile drains (by 23%) suggest that even in tile drain dominated systems, a significant amount of water (primarily MTF) may be reaching the stream via upwelling or direct lateral seepage to the stream. Higher SO42- and K+ concentrations in the stream than in tile drains confirmed these results. On an individual storm basis, K+, Mg2+, and SO42- dynamics nevertheless remained highly variable, suggesting that these solute concentration patterns are most useful to infer flowpaths at the watershed scale when used along with other techniques (e.g. hydrograph separation). As strategies are implemented to reduce N loading to streams via tile drains, our results stress the need to also include stream/riparian restoration as a strategy to reduce N loading in tile drain dominated systems, as a significant amount of water likely reaches streams via groundwater upwelling or lateral seepage in these systems.
Article Outline
- Introduction
- Materials and Methods
- Results
- Discussion
- Conclusions
- Acknowledgements
- References
- Discussion with Reviewers
Introduction
Phosphorus, nitrogen, and carbon losses to streams affect aquatic productivity, food web structure, and water quality (Martin et al., 1999; Dalzell et al., 2005). Understanding the processes controlling the delivery of these solutes to streams is therefore of paramount importance in order to develop comprehensive watershed nutrient management strategies.
It is well established that most nutrient exports occur during episodic high flow periods (Royer et al., 2006) and that nutrient concentrations in streams, hydrological processes and flowpaths often change rapidly during precipitation events in response to variations in precipitation intensity/duration and pre-event moisture conditions (Creed and Band, 1998; Sidle et al., 2000; Hangen et al., 2001; Inamdar et al., 2004; Wigington et al. 2005). However, we need to first better characterize the pathways leading to water export in watersheds before tackling the complex issue of nitrogen, phosphorus and carbon dyn-amics in artificially drained landscapes of the US Midwest. Indeed, many fundamental questions remain about the exact nature of the processes regulating stream flow generation in artificially drained landscapes of the US Midwest where artificial drainage is a common practice (Zucker and Brown, 1998), and where heavy soils with limited water infiltration capacity dominate (Fox et al., 2004; Lathrop, 2006). How often and when does overland flow occur? Is overland flow a significant storm flow generating mechanism? What is the importance of macropore flow as a storm flow generating mechanism at the watershed scale?
Although research has shown that preferential flow through soil macropores can be an important transport mechanism to sub-surface drains (a.k.a. tile drains) during precipitation events in artificially drained landscapes of the Midwest (Kung et al., 2000a; Stone and Wilson, 2006), there is a dearth of empirical data documenting the relative importance of overland flow (OLF), matrix flow (MTF), and preferential flow through soil macropores (MPF) during storms at the watershed scale. Kladivko et al. (1991) observed a quick transfer of pesticides into tile drains shortly after application suggesting the occurrence of preferential flow via soil macropores (a.k.a. macropore flow or MPF). Kung et al. (2000a, 2000b) also showed that preferential flow through soil macropores (MPF) in artificially drained Indiana soils led to the quick transfer of both adsorbing and non-adsorbing tracers to the tile drain shortly after precipitation started (less than an hour). White (1985) indicates that although macropores may only occupy a small fraction of the total soil volume, they can have a significant effect on the rate of water movement through soils. Finally, many other studies also document the importance of macropores in water and solute transport in the US Midwest and elsewhere (Shalit and Steenhuis, 1996; Kung et al., 2000a,b; Geohring et al., 2001; Stone and Wilson, 2006; Vidon and Cuadra, 2010). However, these studies generally do not investigate OLF, and especially the relative importance of MPF, MTF, and OLF at generating streamflow during storms.
Empirical evidence of the relative importance of OLF, MTF and MPF flow during storm as a function of storm characteristics (e.g. bulk precipitation), antecedent moisture conditions, and crop development stage are nevertheless critical to inform management of agricultural landscapes of the US Midwest. Indeed, cultural practices (e.g. till vs. no till, winter cover crop, crop rotation) all influence (directly or indirectly) soil structure (soil macropores, water infiltration capacity), and ultimately the relative importance of OLF, MTF, and MPF to stream flow during storms. There are studies that investigate multiple sources or “end-members” (e.g. seep, overland flow, riparian water vs. hillslope water) as possible stream water sources during storms, but those often focus on forested catchments (Burns et al., 1998; Brown et al., 1999; Inamdar and Mitchell, 2006). In most cases, these studies use a variety of hydrograph separation techniques to identify possible sources of water to streams during storms. These include (but are not limited to): mixing diagrams (Brown et al., 1999; Poor and McDonnell, 2007), two end-member mixing analysis (Brown et al., 1999; Liu et al., 2004), three-end member mixing analysis (Hinton et al., 1994; Richey et al., 1998), or “full” end-member mixing analysis (EMMA)(Brown et al., 1999; Inamdar and Mitchell, 2006). In all cases, these hydrograph separation techniques rely on naturally occurring conservative water tracers (at least over the short duration of a precipitation event) such as chloride, electrical conductivity, silica, major cations, sulfate, oxygen-18, deuterium, and in some cases dissolved organic carbon (Brown et al., 1999; McGlynn and McDonnell, 2003; Hood et al., 2006; Stone and Wilson, 2006).
In this study, we investigated the processes that regulate streamflow generation for seven storms in a watershed (Leary Weber Ditch) that typify tile-drained agro-ecosystems of the US Midwest. We first investigated stream flow, tile flow responses to precipitation, and the occurrence of overland flow for 7 storms as a function of antecedent moisture conditions and bulk precipitation. We used the concentration patterns of potassium (K+), magnesium (Mg2+) and sulfate (SO42-) as a function of flow to infer dominant water export mechanisms at both the plot scale (tile drains) and the whole watershed scale (stream). We used mixing diagrams and three end-member mixing analysis to quantify the relative importance of matrix flow (MTF), macropore flow (MPF) and overland flow (OLF) in stream flow at the watershed scale during storms. Specific research questions include:
- How do tile drain flow, overland flow, and stream flow respond to precipitation events for various antecedent moisture conditions and precipitation amounts?
- What is the relative importance of macropore flow, matrix flow, and overland flow (stream only) as storm and tile flow generating mechanisms at the watershed scale for selected storms?
- Do stream solute concentration patterns in tile drains and at the outlet of the watershed reflect the dominant water export mechanism(s) identified using hydrograph separation?
Methods
Site Description
Leary Weber Ditch (LWD) (7.2 km2) is a first order watershed located in the larger Sugar Creek watershed, approximately 20 km east of Indianapolis, Indiana (Figure 1). Climate at the site is classified as temperate continental and humid. The average annual temperature for central Indiana is 11.7º C with an average January temperature of -3.0º C and an average July temperature of 23.7º C. The long-term average annual precipitation (1971 – 2000) is 100 cm (NOAA, 2005). Soils in the watershed are dominated by well-buffered poorly drained loams or silt loams, and typically belong to the Crosby-Brookston association. Crosby-Brookston soils are generally deep, very poorly drained to somewhat poorly drained with a silty clay loam texture in the first 30 cm of the soil profile. Soils in LWD are suited for row crop agriculture such as corn and soybean, but require artificial drainage to lower the water table, removing ponded water, adding nutrients and ensuring good soil tilth. Conventional tillage and a corn/soybean rotation have been implemented consistently for the last 20 years in LWD. Each year, approximately 50% of the watershed is used to grow corn, and the remaining portion is used to grow soybean. Soybean is generally planted early May, with glyphosate applied mid-May. Phosphorus application on soybean generally average 112 kg ha-1. For corn, fertilizer as anhydrous ammonia is generally applied at a rate of 180 kg N ha-1 yr-1, and herbicides atrazine and acetochlor are generally applied in mid-May. Potash (K2O) is applied post-harvest on soybean fields at a rate of approximately 220 kg ha . LWD is representative of many watersheds in the Midwest where poorly drained soils dominate and where artificial drainage is commonly used to lower the water table, and was selected by the US Geological Survey (USGS) as representative of artificially drained landscapes of the US Midwest as part of USGS National Water Quality Assessment Program (Lathrop, 2006).
 monitored for this study in 2009 and 2010.")
Figure 1: Experimental site location. TD1 and TD2 correspond to the two tile drains (TD) monitored for this study in 2009 and 2010.
Hydrological Measurements:
A total of 7 storms were monitored from February 2009 until April 2010. Over the study period, the majority of storms generating a significant increase in discharge in this watershed occurred in spring (March through June each year) when the soil was bare or when crops were just starting to grow (Figure 2). High stream flow events in summer months were rare (Figure 2), and previous work has shown that even large precipitation events (> 3 cm bulk precipitation) often do not generate significant stream or tile flow response in summer and fall in tile-drained agricultural watershed (July through November) (Kladivko et al., 2004; Vidon et al., 2009). Below freezing temperatures and/or significant snow cover between December and early February each year made it impossible to efficiently operate the ISCO samplers for water sampling, consequently all monitored storms occurred between late winter and late spring.
Bulk precipitation for the storms studied was measured using a network of 7 rain gages distributed throughout the watershed. The two tile-drains monitored for this study (TD1 and TD2) are located in the headwaters of the watershed (Figure 1). Each tile-drain is 20.3 cm ID and located approximately 120 cm below the ground surface. TD1 extends 660 m from the stream and drains an area approximately 8.1 ha in size. TD2 extends 710 m from the stream and drains an area approximately 6.1 ha in size. Each tile drain was equipped with a Doppler velocity meter (ISCO 2150) for continuous discharge measurements, and a In-Situ LTC probe (level-temperature-conductivity). Whenever possible (i.e. when the stream water level was below the tile drain), discharge was also measured by hand using the bucket method to validate discharge measurements obtained with the Doppler velocity meters. The occurrence of overland flow was measured using a H-flume inserted into the ground, equipped with a In-Situ LT (level-temperatue) logger. Stream stage at the outlet of the watershed was measured using an In-Situ LTC probe. Discharge was measured biweekly using a handheld Doppler velocity meter (Sontek) so a rating curve could be established. A network of groundwater wells was also established near the overland flow site. Four wells were located at the field edge to capture groundwater quality in the field, while another four wells were located in a grassy area closer to the stream.
Chemistry
Water samples for sulfate (SO42-), magnesium (Mg2+), and potassium (K+) analysis were collected in tile drains 1 and 2 (TD1 and TD2), in overland flow (if any), and in the stream using auto samplers (ISCO 6712). In tile drains, the sample collection line from each ISCO sampler was located at least 1m into the tile drains and Doppler velocity measurements confirmed that no flow reversals occurred in the tile drains during the storms studied, therefore guaranteeing that tile samples were not contaminated by stream water when the tiles were submerged during storms. Each sampler was triggered manually before the beginning of each storm and generally set to collect water samples every 20 minutes during the rising limb of the hydrograph or the first 24 hours of the storm. Each 1L sample was a composite of 3 samples taken 20 minutes apart (1 bottle per hour = 24 hours). Sampling interval was extended to 2 hours (3 samples taken 40 minutes apart per bottle) on the falling limb of the hydrograph. Although all water samples collected on the rising limb of the hydrograph and around peak flow were analyzed, not all samples were necessarily analysed on the falling limb of each hydrograph to limit cost. Additional water samples were also collected in groundwater wells (immediately before each storm) and in rain gages (immediately after each storm) and were analyzed for SO42-, Mg2+, and K+. Water samples were never left more than 24 hours in the field and were immediately filtered using GF/F Whatman 0.7 µm filter upon return to the laboratory.
 in the stream at the outlet of the study watershed (Leary Weber Ditch) between November 2008 and May 2010. Storms 1 through 7 are the storms during this period for which water samples were collected in the watershed.")
Figure 2: Mean daily discharge (L/s) in the stream at the outlet of the study watershed (Leary Weber Ditch) between November 2008 and May 2010. Storms 1 through 7 are the storms during this period for which water samples were collected in the watershed.
Triplicate analysis of 10% of all samples and analysis of check standards every 10 samples were performed to assess measurement error, and check for accuracy and precision of measurement techniques. The standard error on reported solute values was typically less than 10% for all solutes. Sulfate concentrations were determined colorimetrically using standard methods (Clesceri et al., 1998) on a Konelab 20 Photometric Analyzer (EST Analytical). Major cation concentrations were determined on a Dionex DX500 Ion Chromtograph equipped with a a CS15 analytical column and methasulfonic acid eluent (Clesceri et al., 1998).
Hydrological Data Analysis and Hydrograph Separation
In this study, the start of each event was defined when a perceptible rise in discharge in the stream was observed. The end of the event was defined when flow in the stream returned to pre-event flow values or when a new event started, which ever occurred first. Seven and fourteen day antecedent discharges (7dQ and 14dQ, respectively) in the stream were calculated as the mean discharge during the 7 and 14 days preceding each event. Time to peak in tile drains or the stream was defined as the time between the start of the main rising limb and the peak in discharge in tile drains or the stream, respectively. Because the surface area of the stream is less than 1% of the surface area of the watershed, direct precipitation interception by the stream was considered to be a negligible contribution to stream flow.
We use SO42- vs. K+ mixing diagrams to identify potential sources of water (i.e precipitation, stream baseflow, overland flow) influencing the composition of tile water and stream water during the selected storms. Although we plot groundwater on the mixing diagrams, we use stream baseflow as the end-member corresponding to pre-event water. This approach is often used in studies using hydrograph separations techniques to identify event and pre-event water because 1) the chemical signature of groundwater samples collected at select locations for analysis may not be representative of the groundwater in the entire watershed, and 2) stream base flow is primarily composed of groundwater and is therefore considered to be representative of the average chemical signature of groundwater or pre-event water at the watershed scale (Sklash, 1990). As hydrograph separations are conducted in this study, another assumption is that preferential flow through soil macropores (macropore flow or MPF) is equivalent to event water (Steenhuis et al., 1994). We believe that this assumption is valid in our watershed because the quick transfer of event or new water to tile drains during storms cannot be explained through passive diffusion of surface water (i.e. event water) through the soil matrix (Stone and Wilson, 2006). Indeed, using the one-dimensional form of Darcy’s law in the vertical dimension with an estimated saturated soil hydraulic conductivity of 60 cm/day (Dingman, 2002) and a soil porosity of 45% (Dingman, 2002), it would take at least 22 h for new water to reach the tile drains at an average depth of 1.2 m in the absence of preferential transfer via soil macropores. In the study watershed, tile drain response to storms generally occurs in a matter of a few hours, suggesting that new water contributions to tile drains are the result of macropore flow, as opposed to passive diffusion through the soil matrix (Stone and Wilson, 2006; Vidon and Cuadra, 2010). Finally, the chemical composition of tile water clearly indicates that it is a mixture of stream baseflow water (equivalent to MTF) and precipitation water (equivalent to MPF) (see mixing diagrams in result section). It does not appear to be influenced by OLF. This indicates that precipitation water or new water (and not OLF-like water as one may think) is the best proxi for macropore flow water contribution to flow in this watershed.
Aside from MTF and MPF, overland flow (when is occurs) is also considered to be a third possible end-member for stream water at the watershed scale. SO42- vs. K+mixing diagrams (see result section) clearly allow for the differentiation of overland flow (OLF), matrix flow (MTF) and macropore flow (MPF) waters based on SO42- and K+concentrations during storms. Based on these findings, the following equations are used to determine the relative proportions of OLF, MPF and MTF waters in tile water and stream water durign storms. By definition, and as confirmed by mixing diagrams (see results section), OLF contributions to tile water and stream water for storms without OLF is set at zero.
(1) 1 = QOLF + QMPF + QMTF
(2) CSO4 = CSO4OLF QOLF + CSO4MPF QMPF + CSO4MTF QMTF
(3) CK = CKOLF QOLF + CKMPF QMPF + CKMTF QMTF
where Q represents the proportion (as a precentage) of each end-member (MPF, MTF, or OLF) in either tile drain flow or stream flow; CSO4 and CK represent the mean SO42- and K+ concentration in the stream or tile drain water during the storms studied; CSO4OLF, CSO4MPF, CSO4MTF represent the mean sulfate concentration in overland flow (OLF), precipitation water (equivalent to MPF), and stream base flow (equivalent to MTF); and CKOLF, CKMPF, CKMTF represent the mean potassium concentration in overland flow (OLF), precipitation water (MPF), and stream base flow (MTF) for each of the storms studied.
Aside from SO42- vs. K+ mixing diagrams, we also use the concentration patterns of SO42-, Mg2+, and K+ in the stream and tile drains during storms to confirm the results of the hydrograph separations for each of the storms studied. Indeed, Mg2+ is typically exported via groundwater flow and dilution trends in Mg2+ concentration are often observed as stream discharge increases (Reid et al., 1981; Elwood and Turner, 1989; Kahl et al., 1992; Hill, 1993; Hood et al., 2006). Conversely, K+ is applied to the soil surface in this watershed as K2O (see site description above), and Baker et al. (2006) showed that K+ concentration is generally associated with overland flow (if any) or surface water in this watershed. A decrease in Mg2+ concentration as discharge increases is therefore assumed to be consistent with the dilution of pre-event water by event water as discharge increases. An increase in K+ concentration in flow during storms is assumed to indicate an increase in surface water contributions to flow.
Results
Storm Characteristics and Associated Watershed Hydrological Response

Table 1: Precipitation amounts and antecedent moisture conditions before each storm for storm 1 (Feb. 26, 2009), storm 2 (Apr. 1, 2009), storm 3 (Apr. 29, 2009), storm 4 (Jun. 11, 2009), storm 5 (Mar. 29, 2010), storm 6 (Apr. 8, 2010), and storm 7 (April 26, 2010).
Legend: Bulk P = bulk precipitation, TD1 = tile drain 1, TD2 = tile drain 2, WT BGS = water table depth below ground surface, 7dQ = 7-day antecedent discharge, 14dQ = 14-day antecedent discharge.
Storm bulk precipitation ranged from approximately 1cm (storm 5) to 4.5 cm (storm 3), with overland flow occurring for storms 3, 5, and 6. Antecedent water table depth and antecedent stream and tile flow conditions before each of the 7 storms studied here are presented in Table 1. With the exception of storms 2 and 3, tile drains were not flowing before the storms. Antecedent water table depths (in cm below ground surface) were highest for storms 3, 5, and 6 (125 cm < WT < 97 cm), and lowest for storm 2 (167 cm). Seven and 14-day antecedent flow conditions in the stream were also consistently higher for storms 3, 5, and 6 (Q > 117 L/s) than for any of the other storms (Q < 88 L/s) (Table 1).
Maximum flows in the stream and in tile drains were generally highest for storms 3, 5, and 6 (Table 2). Nevertheless, the lowest maximum flow was recorded for storm 1 in both TD1 and TD2, and for storm 7 in the stream. The three highest mean flows in the stream were also associated with storms 3, 5, and 6. However, the three highest mean flows occurred for storms 4, 6 and 7 in TD1, and for storms 5, 6, and 7 in TD2. Times to peak in tile drains varied from storm-to-storm from approximately 2 hours for storm 2, to approximately 6 hours for storms 6. In general, the times to peak in tile drains were 2 to 6 times shorter than in the stream (Table 2). As indicated above, overland flow (OLF) occurred for storms 3, 5 and 6 (Table 2).

Table 2: Overland flow occurrence, and stream and tile drain responses to storm 1 (Feb. 26, 2009), storm 2 (Apr. 1, 2009), storm 3 (Apr. 29, 2009), storm 4 (Jun. 11, 2009), storm 5 (Mar. 29, 2010), storm 6 (Apr. 8, 2010), and storm 7 (April 26, 2010).
Legend: OLF = overland flow; TD1 = tile drain 1, TD2 = tile drain 2.
Water Chemistry
Median sulfate (SO42-), potassium (K+) and magnesium (Mg2+) concentrations in the stream and groundwater before each storm, and in precipitation, TD1, TD2, the stream, and overland flow (if any) during storms 1-7 are shown in Table 3. Variability in Mg2+, SO42- and K+ concentrations during the storms is shown in the chemographs (see Figures 3 and 4 below), and on the mixing diagrams presented further (Figure 5). Regardless of the storm, SO42- and Mg2+ are generally higher in groundwater (SO42- = 29.2 mg/L, Mg2+ = 23.3) than at any other location (Table 3). Sulfate concentrations in the stream during storms (6.1-14.2 mg/L) are generally lower (5-49% lower) than in the stream before the storm, except for storms 4 and 5 when SO42-concentration increased by 39.2% and 1%, respectively. A similar pattern is observed for Mg2+, whereby Mg2+ concentrations in the stream during storms are generally 2-14% lower than in the stream before the storm, except for storm 1 for which stream Mg2+ concentration was slightly lower before the storm than during the storm. When tile drains and stream water samples are compared, SO42- concentrations in tile drains during the storms are generally ower (mean median SO42- concentration in TD1 and TD2 for all storms = 6.55 mg/L) than in the stream (mean median SO42- concentration = 9.64 mg/L); however no significant difference (p>0.05) was observed for Mg2+ concentrations between tile drains (16.8 mg/L) and the stream (17.2 mg/L). When overland flow (OLF) occurred, SO42--concentrations in OLF (< 1mg/L) were lower than at any other location in the watershed (except for a few precipitation water samples). Mg2+ concentrations were also lower in OLF (2.5 mg/L < Mg2+ < 5.0 mg/L) than at any other location in the watershed, except for precipitation water where Mg2+ concentrations were consistently less than 1.1 mg/L.
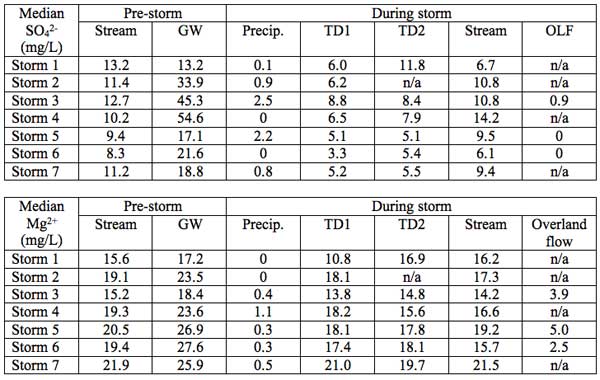
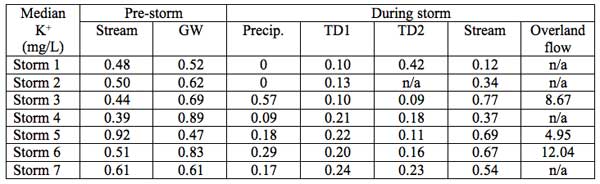
Table 3: Median sulfate (SO42-), magnesium (Mg2+) and potassium (K+) concentrations (mg/L) before and during storm 1 (Feb. 26, 2009), storm 2 (Apr. 1, 2009), storm 3 (Apr. 29, 2009), storm 4 (Jun. 11, 2009), storm 5 (Mar. 29, 2010), storm 6 (Apr. 8, 2010), and storm 7 (April 26, 2010).
Legend: GW = groundwater, Precip. = precipitation, TD1 = tile drain 1, TD2 = tile drain 2; OLF = overland flow, n/a = not applicable.
Unlike Mg2+ and SO42-, median K+ concentrations were significantly (p<0.05) higher in overland flow (mean K+ = 8.55 mg/L) than at any other location in the watershed by one order of magnitude. Median K+ concentrations in the stream were higher for storms when overland occurred (storms 3, 5 and 6) (0.67 mg/L < K+ < 0.77 mg/L) than for other storms (0.12 mg/L< K+ < 0.54 mg/L). Mean median K+ concentration in tile drains during storms (0.19 mg/L) was similar (p<0.05) to the mean median K+ concentration in precipitation (0.19 mg/L), but significantly lower (p<0.05) than in groundwater (mean median K+ = 0.66 mg/L), stream baseflow (mean median K+ = 0.55 mg/L) or stream storm flow (mean median K+ = 0.50 mg/L).
High temporal resolution concentration patterns for K+, Mg2+ and SO42- in the stream, TD1 and TD2, in relation to stream flow during storms 1-7 are shown on Figures 3 and 4. Potassium concentration patterns in the stream were significantly affected by the occurrence of overland flow (OLF). For storms 3, 5, and 6, for which OLF occurred, stream K+ concentrations showed a sharp increase with flow, with maximum K+ concentrations reached with or slightly after the peak in discharge. In tile drains, K+ concentrations in TD1 and TD2 did not show a consistent dilution or concentration pattern as a function of flow. K+ increased with flow in both TD1 and TD2 for storm 6, but not for storms 3 or 5. For storms when no overland flow occurred (i.e. storms 1, 2, 4 and 7), no consistent concentration or dilution patterns were observed as a function of flow for K+ in either TD1, TD2, or the stream.
 (solid line), and potassium (K+), magnesium (Mg2+)")
Figure 3: Stream discharge (L/s) (solid line), and potassium (K+), magnesium (Mg2+), and sulfate (SO42-) concentrations in the stream (watershed outlet) and in tile drain 1 (TD1) and tile drain 2 (TD2) for storms 1, 2 and 3. (* = Equipment malfunction did not allow for sample collection to occur where data points are missing in tile drains).
For storms 3, 5 and 6, a decrease in stream Mg2+ concentration was observed in the stream, TD1, and TD2 as discharge peaked in the stream. For storms 1, 2, 4, and 7, a small decrease in Mg2+ concentration was also observed in the stream, but no clear concentration or dilution pattern was observed for Mg2+ in either TD1 or TD2 for these storms. With the exception of storm 1 for which sulfate concentration patterns were almost opposite between the stream and tile drains, sulfate concentration patterns (not absolute concentration values) were generally similar in tile drains and the stream. SO42- concentrations exhibited a clear dilution pattern as stream discharge peaked for storm 6. SO42- concentrations increased as discharge peaked for storms 4, and showed no clear dilution or concentration patterns as a function of flow for storms 2, 3, 5, and 7.
Figure 4: Stream discharge (L/s) (solid line), and potassium (K+), magnesium (Mg2+), and sulfate (SO42-) concentrations in the stream (watershed outlet) and in tile drain 1 (TD1) and tile drain 2 (TD2) for storms 4, 5, 6 and 7.
Hydrograph Separations
For storms when overland flow occurred (storms 3, 5 and 6), OLF water clearly separated from other water sources because of higher K+ concentrations and low SO42- concentrations (Figure 5). Similarly, precipitation water separated from other water sources because of low K+ and SO42- concentration relative to other water samples. Regardless of the storm, SO42- concentrations in groundwater were generally extremely variable relative to sulfate concentrations at other locations, but groundwater still clearly separated from water at those other locations because of higher SO42- concentrations. Similarly, stream baseflow clearly separated from overland flow, precipitation, and ground-water on these mixing diagrams because of mid-range SO42- and K+ concentrations relative to other water sources (Figure 5).
 vs. potassium (K+) mixing diagrams for storms 1-7. Centroids indicate mean solute concentrations during storms. Error bars indicate one standard deviation.")
Figure 5: Sulfate (SO42-) vs. potassium (K+) mixing diagrams for storms 1-7. Centroids indicate mean solute concentrations during storms. Error bars indicate one standard deviation.
For all storms, stream and tile water during storms are bounded by overland flow water, precipitation water, and stream base flow water (our three end-members). The only exception is storm 5 for which a high mean K+ concentration in the stream during the storm put stream water outside the mixing triangle formed by precipitation water (MPF), stream baseflow (MTF), and overland flow (OLF). However, for this storm, variability along the K+ axis is high. We therefore use the orthogonal projection of the stream water on the OLF – MTF or stream baseflow dilution line to perform the hydrograph separation (Brown et al., 1999).
Mixing diagrams indicate that tile drain water during storms is generally on a dilution line between precipitation water (equivalent to MPF) and stream baseflow water (equivalent to MTF). For storms without OLF, stream storm water is also generally on a dilution line between precipitation water and stream baseflow water (Figure 5). Hydrograph separation results in Table 4 indicate that MPF contributions to tile flow during storms vary from 37% to 68% of total flow (mean = 51%), with lowest contributions for storms 3 and 4 (37%) and the highest contribution for storms 2 (68%). In the stream, MPF contributions for storms 1, 2, 4, and 7 (no overland flow) vary from 0%-40% (mean = 21%), and MTF contributions average 79% of total storm flow for these storms. For storms with overland flow (OLF) (storms 3, 5 and 6), MPF contributions vary from 0%-27%, MTF contribution from 42%-83%, and OLF contributions from 0%-58%.
, matrix flow (MTF), and overland flow (OLF) contributions")
Table 4: Mean macropore flow (MPF), matrix flow (MTF), and overland flow (OLF) contributions (% of total flow) to tile drain flow and stream flow over the duration of the storm for storm 1 (Feb. 26, 2009), storm 2 (Apr. 1, 2009), storm 3 (Apr. 29, 2009), storm 4 (Jun. 11, 2009), storm 5 (Mar. 29, 2010), storm 6 (Apr. 8, 2010), and storm 7 (April 26, 2010) (n/a = not applicable).
Discussion
How do tile drain flow, overland flow and stream flow respond to precipitation events for various antecedent moisture conditions and precipitation amounts?
Previous work in this watershed indicates that in spring, as antecedent moisture conditions do not vary significantly, and the soil is bare or the vegetation only in the early stage of its development, bulk precipitation is positively significantly correlated to mean tile flow, maximum tile flow, and time to peak (Vidon and Cuadra, 2010). However, Vidon and Cuadra (2010) also indicate that antecedent water table depth is significantly correlated (p<0.05) to mean tile flow and maximum tile flow, indicating that even small variations in antecedent water table depth (<20 cm) can significantly impact tile flow response to precipitation. For the storms studied here, bulk precipitation is not significantly correlated (p>0.05) to mean tile flow, maximum tile flow or maximum stream flow. Antecedent water table depth is however significantly correlated (p<0.05) to tile drain and stream flow (both maximum and mean values during the storms studied). Although in slight contrast with previous work in this watershed in 2008 (Vidon and Cuadra, 2010), these results are consistent with our current understanding of the impact of antecedent moisture conditions on watershed response to storms. Indeed, several studies indicate that changes in antecedent moisture conditions have a significant effect on soil and watershed response to storms (Troch et al., 1993; Sidle et al. 2000; Poor and McDonnell, 2007; Vidon et al., 2009). Also, when Vidon and Cuadra (2010) indicate that the primary factor driving tile flow response to precipitation was bulk precipitation for a series of spring storms in 2008, antecedent water table depth between storms only varied by < 20 cm. Here, antecedent water table depth varied by approximately 70 cm, indicating much more variable antecedent moisture conditions for the storms studied here than in the Vidon and Cuadra 2010 study. Conversely, bulk precipitation varied from 2.17 cm to 10.82 cm in the Vidon and Cuadra 2010 study, but only between 1.02 cm and 4.45 cm in this study, which is consistent with bulk precipitation having a stronger effect (i.e. a significant correlation) in the Vidon and Cuadra 2010 study, than for the series of storms presented here. Together, results from these two studies suggest that both bulk precipitation and antecedent moisture conditions are important in regulating watershed response to precipitation, and that the relative importance of bulk precipitation and antecedent water table depth can vary significantly from year to year based on inter-annual variability in storm characteristics and antecedent moisture conditions. These results are in agreement with results by Macrae et al. (2010) stressing the non-linearity and complex hydrological response of watersheds to precipitation as a function of antecedent hydrologic conditions (i.e. pre-event water table position, pre-event stream flow, precipitation, and season). Ultimately, it is difficult to determine the relative importance of antecedent water table depth and bulk precipitation on watershed hydrological response to storms over the long term, as the relative importance of these two variables clearly varies for each storm depending on hydrological conditions for that storm.
At the watershed scale, the time to peak in the stream is significantly negatively correlated (p<0.05) to antecedent water table depth, and significantly positively correlated (p<0.05) to 7 and 14-day antecedent discharges, which indicates that times to peak are significantly shorter under dry antecedent conditions than wet antecedent conditions. Although it is certain that the occurrence of overland flow is likely to be positively correlated with the occurrence of large storms (i.e. > 5 cm bulk precipitation) over the long run, it is not significantly correlated with bulk precipitation for the storms studied (p>0.05). It is however significantly corr-elated (p<0.05) with antecedent water table depth, stream baseflow, and 7 and 14-day antecedent stream flow conditions. This suggests that for medium size storms (1 cm < bulk precipitation < 4.5 cm), variations in antecedent moisture conditions are likely more important than bulk precipitation in triggering overland flow.
What is the relative importance of macro-pore flow, matrix flow and overland flow as storm flow generating mechanisms at the watershed scale?
One key assumption in performing hydrograph separations is that the chemical signature of end-members does not vary over the duration of the storm (Sklash et al., 1990). This assumption is commonly made for precipitation water, and stream baseflow or groundwater (Sklash et al., 1990). However, it has been less tested for overland flow, as the concentration of solutes in overland flow has the opportunity to vary over the duration of the storm. Error bars on mixing diagrams (Figure 5) illustrate the variability of K+ and SO42- concentrations as measured in overland flow for the storms studied (see storms 3, 5, and 6). Although solute concentrations do vary, especially K+, overland flow water remains significantly different (error bars do not overlap) from all other water sources during the storms studied. We therefore believe that in this case, overland flow can be used as a possible end-member for hydrograph separations.
Secondly, one common concern of using precipitation water as an equivalent to new water contribution to tile drains (i.e. MPF), as determined using conservative tracers over the short duration of a storm (a few hours) such as K+ or SO42-, is that new water will immediately increase its ionic content as it enters in contact with the soil surface. For this reason, one may think that overland flow water is a more reasonable proxy than precipitation water to establish new water contribution to tile drains (macropore flow) during storms. Data for storms 3, 5, and 6 for which both precipitation water and overland flow water were collected do not support this hypothesis. Indeed, mixing diagrams indicate no contribution of “overland flow like” water to tile drains during storms. To the contrary, tile flow water generally falls on a dilution line between precipitation water and stream baseflow (i.e. pre-event water) indicating that precipitation water is the more appropriate end-member to identify event water contributions to tile flow during storms.
All new water contributions to tile flow during storms are therefore considered to be chemically similar to precipitation water. As indicated in the methods section, new water contributions are also assumed to be equivalent to macropore flow because the quick transfer of new water to tile drains during storms cannot be explained through the passive diffusion of surface water through the soil matrix (Stone and Wilson, 2006) (see calculations in the materials and methods section). Consequently, although hydrograph separation results are by nature only approximations of the relative importance of each end-member to flow, we believe that the assumptions made in this study for calculating the relative importance of OLF (if any), MTF and MPF to flow during storms at both the plot scale (tile drains) and the whole watershed (stream) are valid.
With the exception of storm 5 for which extremely high stream K+ concentrations indicate significant OLF contributions to the stream (58% of total stream flow) (Table 3, Figure 4), stream flow is generally dominated by matrix flow contributions (59-100%). This is consistent with results published elsewhere indicating that in most settings, storm flow is dominated by pre-event water, or in our case, matrix flow (Hinton et al., 1994; Stone and Wilson, 2006; Kienzler and Naef, 2008). With the exception of storm 5 for which overland contributions are large, overland flow contributions are therefore either nil (storm 3) or limited (14%)(storm 6). The importance of overland flow contributions to stream flow during storms does not appear to be related to storm bulk precipitation amounts (Table 1), as storm 5 (high OLF contribution) was only a 1.02 cm bulk precipitation storm, whereas storm 3 (low OLF contribution) was a 4.45 cm bulk precipitation storm. However, aside from occurring for the three storms with the wettest antecedent moisture conditions of the 7 storms studied (i.e. storms 3, 5 and 6, Table 1), the relative importance of OLF contributions to flow for these three storms is also directly related to differences in antecedent moisture conditions between these storms. The highest OLF contribution to flow (58%) occurs for the storm with the wettest antecedent moisture conditions (storm 5)(Table 1), followed by storms 6 (14%) and storms 3 (0% or <1%). These storms present progressively drier antecedent moisture conditions based on water table depth before the storm and antecedent flow conditions (Table 1). Although OLF contributions appear to be very variable from one storm to the next, previous work in the watershed by Baker et al. (2006) also reported extremely high variability in OLF contributions to stream flow for 7 storms in 2003 and 2004, with OLF contributions varying from <1% to 44%. Overall mean contributions of OLF to stream flow are comparable between that study (mean OLF contribution = 18%) and our study (mean OLF contribution = 24%), suggesting that our results are overall consistent with previous work in the watershed.
In tile drains, macropore flow (MPF) contributions between 37% and 68% are consistent with previous work in the watershed, where MPF contributions to total tile drain flow between 11% and 51% have been reported (Stone and Wilson, 2006; Vidon and Cuadra, 2010). However, it is of importance to note that MPF contributions to flow are consistently higher in tile drains than in the stream during storms (Table 4). One possible explanation for these differences is that the tile drains chosen for this study are not representative of other tile drains in the watershed. Although there is no absolute way of ruling out this explanation, SO42- , K+ and Mg2+ concentrations and concentration patterns in TD1 and TD2 are similar to each other, which at least shows good repeatability between TD1 and TD2 (Table 3 and Figures 3, 5). Further, in order to assess the representativeness of TD1 and TD2 for tile drains in the rest of the watershed, we measured electrical conductivity (as an indicator of overall ionic content of tile water) in 11 other tile drains in the watershed on March 17, 2010. Electrical conductivity (EC) in TD1 and TD2 that day was 489 μS/cm and 543 μS/cm for the other 11 tile drains where EC was measured. These results do not suggest that TD1 and TD2 are drastically different from other tile drains in the watershed, at least in term of ionic content. We therefore believe that the more likely explanation for the higher contributions of MPF to flow in tile drains than in the stream during storms, is that a significant input of pre-event water or matrix flow (MTF) not accounted for in tile flow contributes to stream flow during the storms. These MTF contributions to the stream could include groundwater upwelling in the streambed itself, or lateral groundwater seepage to the stream during storms as the water table rises near the stream. This suggests that even in tile drain dominated watersheds; a significant amount of water likely bypasses the tile drains and enters the stream via direct seepage into the stream.
Do stream solute concentration patterns in tile drains and at the outlet of the water-shed reflect the dominant water export mechanism(s) identified using hydrograph separation?
The overall dilution patterns for Mg2+ in stream flow as discharge peaked for most storms is consistent with inputs to the stream of either OLF water (storm 5), MPF water (storms 1, 2, 3, 4, 7) or a combination of both (storm 6), as both OLF and MPF present low Mg2+ concentration relative to MTF (i.e. stream baseflow)(Table 3). The drop in Mg2+ concentration by approximately 10-40% depending on the storm is also consistent with Mg2+ rich-MTF (pre-event water) remaining the dominant source of water to the stream during the storms studied (average MTF contribution to stream flow during storms = 72%) (Table 4).As indicated in the result section, SO42-concentration patterns strongly resemble those of Mg2+, which is consistent with SO42- being primarily exported via a similar flow path as Mg2+, i.e. matrix flow (MTF). Overall greater SO42- concentrations in the stream than in tile drains during storms are also consistent with the greater contribution of matrix flow (MTF) to the stream than to tile drains, since MTF (i.e. stream baseflow) generally presents higher SO42- concentrations than precipitation water (equivalent to macropore flow) (Table 3).
Potassium (K+) concentration patterns are more complex than those of Mg2+ or SO42-; however, on a storm per storm basis, K+ concentration patterns still confirm hydrograph separation results. For storms 1, 2, 4, and 7 (no overland flow), K+ did not show any consistent concentration or dilution pattern across all storms, which is consistent with the absence of a strong source of K+ to the stream (e.g. OLF). For storm 5, the overall OLF contribution to stream flow (58% of flow) is on the high end of reported values in the literature (Baker et al., 2006); however, a high OLF contribution for this storm is consistent with the high K+ values observed in the stream for this storm (Figure 4). For storm 6 where OLF contributions to stream flow are limited (14%), K+ concentration in the stream also increases sharply with flow (Figure 4), but in this case, this increase in K+ concentration in the stream is paralleled by a proportional increase in K+ concentration in tile drain flow. Vidon and Cuadra (2010) observed similar increases in K+ concentration with flow in tile drains for some storms in 2008, and attributed this short term increase in K+ concentration in tile drains to the transfer to tile drains of surficial soil particles rich in K+ via macropores during storms. For storm 3, a sharp increase in K+ concentration in the stream is observed during the storm (Figure 3), but this increase is neither paralleled by an increase in K+ concentration in tile drains (as in storm 6) or by a significant OLF contribution to stream flow (as in storm 5). With the exception of storm 3 for which K+ concentration remain complex, K+ concentration patterns in the watershed can therefore be explained when described in association with hydrograph separation results. However, our results stress complex relationships between flow paths (MPF, MTF, OLF) and K+ concentration patterns, suggesting that K+ concentration patterns should not be used single handedly to identify flow paths, and differentiate between OLF and MPF contributions to streams. Overall, the K+, Mg2+, and SO42- concentration patterns in this watershed are nevertheless consistent with the results of the hydrograph separations performed on stream and tile waters. However, solute concentration patterns alone are often not enough to infer flow path on a storm-to-storm basis as individual solute concentration patterns can be unusual (e.g. K+ for storm 3 – see discussion above). This is therefore only in combination with other techniques (e.g. hydrograph separation) that a detailed analysis of major anion and cation concentration patterns can be really useful to infer flow paths at the plot scale (tile drain) or the whole watershed (stream).
Beyond the relationship between hydrograph separation results and solute concentration patterns in the watershed, the examination of high temporal resolution water quality data for TD1, TD2, and stream flow over this series of storms also shed light on the suitability of using tile water quality data to characterize stream water quality in artificially drained landscapes of the Midwest. Indeed, it is often assumed that in artificially drained watersheds of the US Midwest, stream water quality is primarily regulated by tile drain hydrology; however, very few studies, if any, provide data on the similarities and differences between tile drain hydrology and stream flow hydrology. In this study, the differences in the K+, Mg2+, and SO42- concentration values and patterns in tile drains and the stream during storms (Table 3, Figures 3, 4), and in the relative importance of matrix flow in stream flow and tile drain flow (Table 4) raise the important question of the suitability of tile drain data to quantify the impact of agricultural land use on watershed hydrology. Many studies in tile-drained landscapes focus on tile hydrology (Kung et al. 2000a; Kladivko et al., 2004; Vidon and Cuadra, 2010) or stream water quality in headwaters of tile-drained watersheds (Royer et al., 2004; Morgan et al., 2006; Wagner et al., 2008), but few investigate both concomitantly. This strongly limits our ability to integrate results obtained at the plot scale (tile drains) with those obtained at the watershed scale (stream) in these systems. By showing clear differences in solute concentration dynamics, and macropore and matrix flow contributions to flow between tile drains and the stream, our data stress the need to measure water quantity and quality both in tile drains and in streams, so results can be integrated across scales. Further, because the contribution of matrix flow to total flow is higher in the stream than in the tile drains feeding into it, our results also suggests that the importance of tile drains in defining stream hydrology and solute content (K+,SO42-, Mg2+) may be over-estimated. This implies that the importance of processes other than tile flow capable of impacting the chemical signature of the stream water, such as upwelling of groundwater in the stream bed or lateral groundwater seepage into the stream, may be underestimated at the watershed scale. As cultural practices (e.g. tillage vs. no-tillage, cover crop, reduction of fertilizer inputs) are implemented in agricultural watersheds to reduce N loading to streams via tile drains, our results stress the need to also implement strategies to improve hyporheic and riparian zone N removal capacity, as those likely contribute a significant amount of water (by definition not accounted for by tile drain flow measurement) to the stream during storms. Based on hydrograph separations results, the stream receives on average 23% more MTF or pre-event water than tile drains, suggesting that effective riparian zones with 90% or more nitrate removal efficiencies, could reduce N concentration in the stream by approximately 21% (assuming no N removal before riparian zone implementation, and that most N is exported via MTF to the stream). Together with other best management practices (e.g. tillage vs. no-tillage, cover crop, reduction of fertilizer inputs), riparian zones, stream, and/or hyporheic zone restoration, if widely implemented, could therefore likely add up to significant N reductions in streams in artificially drained landscapes of the US Midwest and elsewhere where tile drainage is a dominant feature of the landscape.
Conclusions
This study is one of the first studies investigating the relative importance of macropore flow, matrix flow, and overland flow in flow generation during storms in artificially drained landscape of the US Midwest, and critically assesses to what extent tile drains are representative of the hydrology and ionic content of stream flow in these watersheds. At the watershed scale, matrix flow is the dominant source of water to the stream during most storms, with an average contribution of 72% of total stream flow over the 7 storms studied. Overland flow contributions to total stream flow vary widely for storms when overland flow occurred from 0% to 58% (average = 24%) and appear to be related to antecedent moisture conditions (e.g. antecedent water table depth, 7 day and 14 day-antecedent flow) more so than to bulk precipitation, at least for the range of storms studied (1.02 cm < bulk P < 4.45 cm) in spring as the soil is bare and/or vegetation low. Results also revealed clear differences in the SO42- and K+ content of tile water and stream water, with tile water generally presenting significantly (p<0.01) lower SO42- and K+ concentrations than stream water. These differences were reflected in the results of the hydrograph separations that indicate that macropore flow contributions to flow are consistently higher in tile drains (51% of total flow) than in stream flow (18% of total flow). These results suggest that tile drain measurements in artificially drained landscapes of the Midwest may not always be adequate proxies to characterize watershed hydrology in these systems. Additional data analysis is underway to determine to what extent these differences in hydrological processes between tile drains and streams affect nitrogen, phosphorus and carbon dynamics at the watershed scale.
Acknowledgements
The project described in this publication was supported by grant/cooperative agreement number # 08HQGR0052 to P. Vidon from the United States Geological Survey (USGS). Its contents are solely the responsibility of the authors and do not necessarily represent the official views of the USGS. Additional funding was also provided by an Indiana University–Purdue University, Indianapolis RSGF grant to P. Vidon and a Mirsky Fellowship to P.E. Cuadra. The authors would like to thank Lani Pascual, Vince Hernly and Bob E. Hall for help in the field and the laboratory, and Jeff Frey and Nancy Baker from the USGS Indianapolis Office for their help in the development phase of the project.
References
Baker NT, Stone WW, Wilson JT, Meyer MT (2006). Occurrence and transport of agricultural chemicals in Leary Weber Ditch Basin, Hancock County, Indiana, 2003–04. US Geological Survey Scientific Investigations Report 2006-5251, 44.
Burns D, Hooper RP, McDonnell JJ, Freer JE, Kendall C, Beven K (1998). Base cation concentrations on subsurface flow from a forested hillslope: The role of flushing frequency. Wat Resour Res 34(12): 3535-3544.
Brown VA, McDonnell JJ, Burns DA, Kendall C (1999). The role of event water, a rapid shallow flow component, and catchment size in summer stormflow. J Hydrol 217: 171–190.
Creed IF, Band LE (1998). Export of nitrogen from catchments within a temperate forest: Evidence for a unifying mechanism regulated by variable source area dynamics. Wat Resour Res 34 (11): 3105–3120.
Clesceri LS, Greenberg AE, Eaton AD (1998). Standard Methods for the Examination of Water and Waste Water, 20th ed., American Public Health Association, Washington, DC; 2005– 2605.
Dalzell BJ, Filley TR, Harbor JM (2005). Flood pulse influences on terrestrial organic matter export from an agricultural watershed. J Geophys Res 110, G02011. DOI:10.1029/2005JG00004.
Dingman SL (2002). Physical Hydrology, 2nd ed., Prentice Hall Inc.: Upper Saddle River, NJ: 641.
Elwood JW, Turner RR (1989). Analysis of Biogeochemical Cycling Processes in Walker Branch Watershed Johnson, VanHook DW (ed). Springer-Verlag, New York, 301–350. Chapter: Streams: water chemistry and ecology
Fox GA, Malone R, Sabbagh GJ, Rojas K (2004). Interrelationship of macropores and subsurface drainage for conservative tracer and pesticide transport. J Environ Qual 33: 2281-2289.
Geohring LD, McHugh OV, Walter MT, Steenhuis TS, Akhtar MS, Walter MF (2001). Phosphorus transport into subsurface drains by macropores after manure applica- tions: implications for best manure management practices. Soil Sci 166(12): 896–909.
Hangen E, Lindenlaub M, Leibundgut C, Von Wilpert K (2001). Investigating mechanisms of stormflow generation by natural tracers and hydrometric data: a small catchment study in the Black Forest, Germany. Hydrol Proces 15: 183–199.
Hill AR (1993. Base cation chemistry of storm runoff in a forested headwater wetland. Wat Resour Res 29(8): 2663– 2673.
Hinton MJ, Schiff SL, English MC (1994). Examining the contributions of glacial till water to storm runoff using two and three-component hydrograph separations. Wat Resour Res 30(4): 983–993.
Hood E, Gooseff MN, Johnson SS, (2006). Changes in the char- acter of stream water dissolved organic carbon during Xushing in three small watersheds, Oregon. J Geophys Res 111: G01007.
Inamdar SP, Christopher SF, Mitchell MJ (2004). Export mechanisms for dissolved organic carbon and nitrate during summer storm events in a glaciated forested catchment in New York, USA. Hydrol Proces 18: 2651–2661.
Inamdar SP, Mitchell MJ (2006). Hydrologic controls on DOC and nitrate exports across catchment scales. Wat Resour Res 42: W03421.
Kahl JS, Norton SA, Haines TA, Rochette EA, Heath RH, Nodvin SC (1992). Mechanisms of episodic acidification in low- order streams in Maine, USA. Environ Poll 78: 37– 44.
Kienzler PM, Naef F (2008). Subsurface storm flow formation at different hillslopes and implications for the “old water paradox”. Hydrol Proces 22: 104-116
Kladivk EJ, Van Scoyoc GE, Monke EJ, Oates KM, Pask W (1991). Pesticide and nutrient movement into subsurface tile drains on a silt loam soil in Indiana. J Environ Qual 20: 264–270.
Kladivko EJ, Frankenberger JR, Jaynes DB, Meek DW, Jenkinson BJ, Fausey NR (2004). Nitrate leaching to subsurface drains as affected by drain spacing and changes in crop production system. J Environ Qual 33: 1803– 1813.
Kung KJS, Steenhuis TS, Kladivko EJ, Gish TJ, Bubenzer G, Helling CS (2000a). Impact of preferential flow on the transport of adsorbing and non-adsorbing tracers. Soil Sci Soc Amer J 64: 1290–1296.
Kung KJS, Kaldivko EJ, Gish TJ, Steenhuis TS, Bubenzer G, Helling CS (2000b). Quantifying preferential flow by breakthrough of sequentially applied tracers: silt loam soil. Soil Sci Soc Amer J 64: 1296–1304.
Lathrop TR (2006). Environmental setting of the Sugar Creek and Leary Weber Ditch Basins, Indiana, 2002–04. U.S. Geological Survey Scientific Investigations Report 2006- 5170; 27.
Liu F, Williams MW, Caine N (2004). Source waters and flow paths in an alpine catchment, Colorado Front Range, United States. Wat Resour Res 40: W09401.
Macrae ML, English MC, Schiff SL, Stone M (2010). Influence of antecedent hydrological conditions on patterns of hydrochemical export from a first-order agricultural watershed in Southern Ontario, Canada. J Hydrol 389: 101-110.
Martin TL, Kaushik NK, Trevors JT, Whiteley HR (1999). Review: Denitrification in Temperate Climate Riparian Zones. Wat Air Soil Poll 111:171-186.
McGlynn BL, McDonnell JJ (2003). Role of discrete landscape units in controlling catchment dissolved organic carbon dynamics. Wat Resour Res 39(4): 1090.
Morgan AM, Royer TV, David MB, Gentry LE (2006). Relationships among nutrients, chlorophyll-a, and dissolved oxygen in agricultural streams in Illinois. J Environ Qual 35: 1110–1117.
NOAA (2005). Climatological data, Indianapolis. National Oceanic and Atmospheric Administration, National Climatic Data Center. http://www.crh.noaa.gov/ind/climatenormals.txt. Accessed 16 Jan 2005.
Poor CJ, McDonnell JJ (2007). The effect of land use on stream nitrate dynamics. J Hydrol 332: 54–68.
Reid JM, MacLeord DA, Cresser MS (1981). Factors affecting the chemistry of precipitation and river water in an upland catchment. J Hydrol 50: 129–145.
Richey DG, McDonnell JJ, Erbe MW, Hurd TM (1998). Hydrograph separations based on chemical and isotopic concentrations: a critical appraisal of published studies from New Zealand, North America and Europe. J Hydrol (NZ) 37(2): 95-111.
Royer TV, Tank JL, David MB (2004). Transport and fate of nitrate in headwater agricultural streams in Illinois. J Environ Qual 33:1296–1304.
Royer TV, David MB, Gentry LE (2006). Timing of riverine export of nitrate and phosphorus from agricultural watersheds in Illinois: implications for reducing nutrient loading to the Mississippi River. Environ Sci Technol 40:4126–4131.
Shalit G, Steenhuis T (1996). A simple mixing layer model predicting solute flow to drainage lines under preferential flow. J Hydrol 183:139–149.
Sidle RC, Tsuboyama Y, Noguchi S, Hosoda I, Fujieda M, Shimizu T (2000). Stormflow generation in steep forested headwaters: a linked hydrogeomorphic paradigm. Hydrol Proces 14: 369–385.
Sklash MG (1990) Process Studies in Hillslope Hydrology. Anderson MG, Burt TP (eds). John Wiley and Sons Ltd., 410–435. Chapter: Environmental isotope studies of storm and snowmelt runoff generation.
Steenhuis TS, Boll J, Shalit G, Selker JS, Merwin IA (1994). A simple equation for predicting preferential flow solute concentrations. J Environ Qual 23: 1058–1064.
Stone WW, Wilson JT (2006). Preferential flow estimates to an agricultural tile drain with implications for Glyphosate Transport. J Environ Qual 35: 1825–1835.
Troch PA, De Troch FP, Brutsaert W (1993). Effective water table depth to describe initial conditions prior to storm rainfall in humid regions. Wat Resour Res 29(2): 427–434.
Vidon P, Hubbard LE, Soyeux S (2009). Seasonal solute dynamics across land uses during storms in glaciated landscape of the U.S. Midwest. J Hydrol 376: 34-47.
Vidon P, Cuadra PE (2010). Impact of precipitation characteristics on soil hydrology in tile-drained landscapes. Hydrol Proces 24: 1821-1833.
Wagner LE, Vidon P, Tedesco LE, Gray M (2008). Stream nitrate and DOC dynamics during three spring storms across land uses in glaciated landscapes of the Midwest. J Hydrol 362: 177-190.
Wigington PJ, Moser TJ, Lindeman DR (2005). Stream network expansion: a riparian water quality factor. Hydrol Proces 19: 1715–1721.
White RE (1985). The influence of macropores on the transport of dissolved and suspended matter through soil. Adv Soil Sci 3: 95–120.
Zucker LA, Brown LC (1998). Agricultural drainage: water quality impacts and subsurface drainage studies in the Midwest. Ohio State University Extension Bulletin 871. The Ohio State University. Accessed online at http://ohioline.osu.edu/b871/ on January 10, 2012.
Discussion with Reviewers
Anonymous Reviewer: The contribution of the 3D geometric effects, such as in the hyporheic exchange, is poorly accounted for and is hardly discussed, as is the possible interception of water by the ground matrix.
P. Vidon, H. Hubbard, P. E. Cuadra and M. Hennessy: We agree with this reviewer that hyporheic exchange flow, 3D flow patterns in the soil matrix, and other diffusion / dispersion questions are not directly measured in this study, and ultimately not discussed in detail. This study is primarily based on an interpretation of natural tracer movements in the watershed (in both tile drains and the stream) to infer flowpaths through end-member mixing analysis (EMMA).
Although EMMA is designed to quantify the net contribution of various water sources to the point of measurement at various points in time, it does not directly measure hydrological processes (e.g. hyporheic exchange) taking place in the watershed. We believe that discussing these processes in details would be too speculative. Instead, we opted to summarize the relative contribution of overland flow (OLF), matrix flow (MTF), and macropore flow (MPF) in the stream and tile drains (MTF and MPF only) for the storms studied (Table 4). We estimate (for discussion purposes only) the potential contribution of hyporheic and riparian processes to stream flow by differences between the proportion of MTF and MPF in the stream and tile drains for the storms studied.
Anonymous Reviewer: In the Hydrograph Separations section, the three end members (overland flow/OLF, precipitation water, and stream base flow) are sometimes referred to as themselves and other times referred to as MPF or MTF. I find this confusing. If MPF is always precipitation water then define it once and call it MPF.
Vidon, Hubbard, Cuadra and Hennessy: Overland flow, stream baseflow, ground-water, and precipitation are the actual water “reservoirs” sampled for the identification of potential end-members, and tile drain and stream flow, the actual locations in the watershed where water samples are collected to conduct hydrograph separations. Macropore flow (MPF), Matrix flow (MTF) and overland flow (OLF) are the flowpaths that the water takes in the watershed to reach either the tile drains or the stream. When the words overland flow, stream baseflow and precipitation are used, we are referring to potential end-members or reservoirs. When the words MPF, OLF or MTF are used, we are referring to hydrological processes taking place in the watershed.