
 Effect of the Addition of Proteins and Hydrocolloids on the Water Mobility in Gluten-Free Pasta Formulations
Larrosa VJ1, Lorenzo G1,2*, Zaritzky NE1,2 and Califano AN1
1 Centro de Investigación y Desarrollo en Criotecnología de Alimentos (CIDCA), Facultad de Cs. Exactas,
UNLP-CONICET. 47 y 116, La Plata (1900), Argentina
2 Área Departamental Ingeniería Química, Facultad de Ingeniería, UNLP, Argentina
*Correspondence E-mail: lorenzogabriel@gmail.com
Key Words: Differential Scanning Calorimetry, Gluten-Free Pasta, Mixture Design, Hydrocolloids, Surface Response Methodology
Received February 8th, 2012; Accepted March 25th, 2012; Published June 24th, 2012; Available online June 30th, 2012
Summary
In a gluten free pasta formulation (suitable for celiac people), the influence of each constituent has a major importance on the final product quality, especially water and hydrocolloids contents used to replace the gluten matrix. The presence of hydrocolloids and proteins in dough may modify the availability of water to interact with starch in the gelatinization process.
The aim of the present work was to investigate the effect of the addition proteins and hydrocolloids addition on the water-starch interaction using a triangular mixture design. Basic dough formula consisted in a mixture of corn starch and flour (4:1, 53.5%), 1%NaCl, and 3% sunflower oil, water (35.48-39.5%), gums (xanthan and locust bean gums, 2:1 ratio, 0.512-2.519%), and proteins (dry egg and ovoalbumin mixtures, 10:1 ratio, 0.683-6.704%) Combinations of gums, proteins, and water were used in a simplex-centroid design with constrains.
Modulated differential scanning calorimetry was used to study starch gelatinization and the amount of unfrozen water in the samples; thermograms were obtained between -50ºC and 140ºC (heating rate 5ºC/min, modulated at ±1ºC, period of 60s). Regarding the process of gelatinization, a biphasic endotherm was observed; when the free water content of the dough was progressively reduced (0.94 to 0.42g H2O/ g dough), endotherms shifted to higher temperatures (onset from 56.7ºC to 63.1ºC, first peak from 75.1ºC to 77.6ºC) following a linear relationship. The response surface analysis of the unfrozen water content of the complex composite system as a function of the concentration of proteins, hydrocolloids, and water led to a “saddle” type surface, involving interactions between components.
Article Outline
Introduction
Materials and Methods
Results and Discussion
Conclusions
References
Discussion with Reviewers
Introduction
The raising demand of gluten-free products in recent years, have led to an important technological research for replacing the gluten matrix in the production of high quality gluten-free foods. Many of the products currently in the market are of low quality, exhibiting poor structure, mouthfeel, and flavor (Gallagher et al. 2004). There are many works on improving gluten-free breads (Gallagher et al. 2004; Lazaridou et al. 2007), but only a few on other type of gluten-free products such as pasta. In the production of gluten-free pasta analogues, wheat flour was substituted with rice or buckwheat flour, precooked rice flour, or pregelatinized rice starch (Ikeda and Asami 2000; Ikeda et al. 2005; Tan et al. 2009). Like starches, gums provide viscosity and texture, and could be used separately or in combination to create certain effects. Hydrocolloids may enhance textural aspects of the dough turning them practically indispensable to formulate any kind of gluten-free dough. Xanthan-locust bean gum (XG-LGB) mixtures are used industrially as thermoreversible gelling agents (Zhan et al. 1993).
There are several methods used to study water interactions in the polymeric matrix of the dough, such as swelling power, water-binding capacity, pasting properties by Brabender Viscoamylograph (Tan et al. 2009), crystalline structure by X-ray pattern (Eliasson, 2004), small deformation rheology (Chiotelli et al. 2000; Chiotelli et al. 2002; Jiménez-Avalos et al. 2005, Ortega-Ojeda et al. 2004), and differential scanning calorimetry (Biliaderis et al. 1980; Califano and Añón 1990; Donovan 1979; Ferrero et al. 1996; Fukuoka et al. 2002; Karlsson and Eliasson 2003; Kruger et al. 2003; Lelievre 1976; Pravisani et al. 1985; Sopade et al. 2004; Wootton and Bamanuarachichi 1979a; Wootton and Bamanuarachichi 1979b), which have been widely used to study starch gelatinization. DSC has been also widely used to evaluate the frozen fraction of water from the endothermic peak that corresponds to the melting of free water.
Recently, modulated differential scanning calorimetry (modulated DSC) has opened new ways for the thermal characterization of materials. Using this technique, the product experiences a sinusoidal temperature modulation (oscillation) overlaid on the conventional linear heating or cooling ramp. (Coleman and Craig 1996) This technique provides the benefits of separating reversible and irreversible thermal events, improving resolution of closely occurring or overlapping transitions, and giving a good precision in heat capacity (Gallagher 1997). The total, reversing and non-reversing heat flows can then be quantified during transition of the sample. The reversing and non-reversing signals reveal the thermodynamic and kinetic characteristics of the transitions, respectively.
Gelatinization of starch in pure water is generally thought of as a swelling-driven process. In this formulation, stress applied to the semi-crystalline lamellae due to the expansion of the amorphous growth ring, results in crystallite disruption (Donovan 1979). In excess of water, the degree of swelling and resulting disruption is sufficient to fully gelatinize the granule. It was proposed by Donovan (1979) that on reducing the amount of water, a point is reached at which the limited extent of swelling is insufficient to disrupt the granule completely. Further double helical order is disrupted at a higher temperature by a more conventional melting transition. The relative amounts of swelling-driven disruption and higher temperature melting are dependent on the amount of water present and the extent to which the amorphous regions are plasticized (Blanshard 1987; Donovan 1979; Jenkins et al.1994; Liu et al. 1991; Zobel et al. 1988). Gelatinization is therefore thought of as varying from all swelling-driven in excess water, to all melting at very low levels of water and at higher temperatures. It is well-known that the addition of sugars and other polyols to starch-water systems elevates the starch gelatinization temperature, with the elevation being greater the higher the concentration of the aqueous solution and the larger the molecular weight of the added solute. Thus, Hirashima et al. (2005) reported informed that the starch gelatinization temperature was shifted to higher temperatures with increasing sucrose concentration and gelatinization was not completed in the presence of excessive sucrose.
Salts have been reported to cause an elevation or depression of gelatinization temperature and gelatinization enthalpy (Wootton and Bamunuarachchi 1980), depending on the types of salt and their concentrations used (Ahmad and Williams 2002; Chungcharoen and Lund 1987; Jane 1993; Jyothi et al. 2005; Maaurf et al. 2001; Oosten 1982, 1983, 1990). It has been reported that NaCl and CaCl2, at low concentrations, slightly increased the peak temperature of sago starch (Ahmad and Williams 2002; Maaurf et al. 2001) and onset temperature of corn starch (Jane 1993). Generally as the concentration of NaCl increase the gelatinization temperature increase to a certain level and then decrease as the concentration increase. When a swelling-inhibitor (e.g. NaCl) is added to a starch suspension some protons of the alcohol groups in the starch granule become exchanged by Na ions. These alcoholates are better dissociated, thus causing a rise in the Donnan potential. However the exchange capacity of starch for the sodium ions is limited, so the increase of the gelatinization temperature is also restricted. When the concentration of NaCl is raised beyond a certain level, the influence of the anion becomes dominant; this would contribute to a decrease in the gelatinization temperature of starch (Oosten 1982, 1983, 1990; Maaurf et al. 2001).
The presence of gums have been reported to modify the gelatinization enthalpy of starch-water systems (Chaisawang and Suphantharika 2006; Viturawong et al. 2008).
Gluten-free doughs are mixed dispersed systems; the dispersion medium contains several types of dispersed particles, with two main construction materials: polysaccharides and proteins. Four levels of structural hierarchy in dispersed food systems can be distinguished: submolecular, molecular, supermolecular and macroscopic. Structural functions of a biopolymer depend upon its place in the structural hierarchy of the product (Tolstoguzov 2000).
The aim of the present work was to investigate the effect of proteins and hydrocolloids addition on water-starch interaction during gelatinization in gluten free doughs using a triangular mixture design, through the analysis of thermograms obtained by modulated differential scanning calorimetry (MDSC). The amount of unfrozen water, water melting temperature, and glass transition temperature for each formulation were obtained, and their relationship with dough composition was also analyzed.
Materials and Methods
Ingredients
Corn starch (12.5% moisture, 0.3% protein) was obtained from Droguería Saporiti (Argentina). Corn flour and commercial 100% sunflower oil (Molinos Río de La Plata SACIFI, Buenos Aires) were purchased from a local supermarket and used without further treatment. Dry egg power (6% moisture, 38% lipids) and ovoalbumin were kindly provided by Tecnovo S.A. (Argentina). Xanthan (XG) and locust bean (LG) gums (Sigma Chemical Co., St. Louis, MO), and analytical grade NaCl were used.
Dough Preparation
The method for dough preparation was proposed by Lorenzo et al. 2008. Basic dough formula consisted in a mixture of corn starch and corn flour (4:1 ratio), NaCl, sunflower oil, a mixture of dry egg power and ovoalbumin in a 10:1 ratio, and a mixture of xanthan (XG) and locust bean (LG) gums in a 2:1 ratio (which is considered as a synergistic ratio, (Web ref. 1). Distilled water was used in all formulations. Dry ingredients were premixed for 1 minute in a commercial food processor (Universo, Rowenta, Germany) at 400 rpm using a kneading attachment. With the processor still running, oil was slowly added and mixed for one more minute. Finally, water was added and the dough was mixed for 5 more min to combine the ingredients. The dough was briefly kneaded by hand, wrapped in a film, put in a tightly sealed container and kept refrigerated (4°C) for 24 hours to let the starches hydrate and to let the dough consistency stabilize (Manley 2001). After a resting time of 24 hours, dough was rolled out using a rolling machine (Pastalinda, Argentina) to give a sheet of 2 mm thick.
Experimental Design
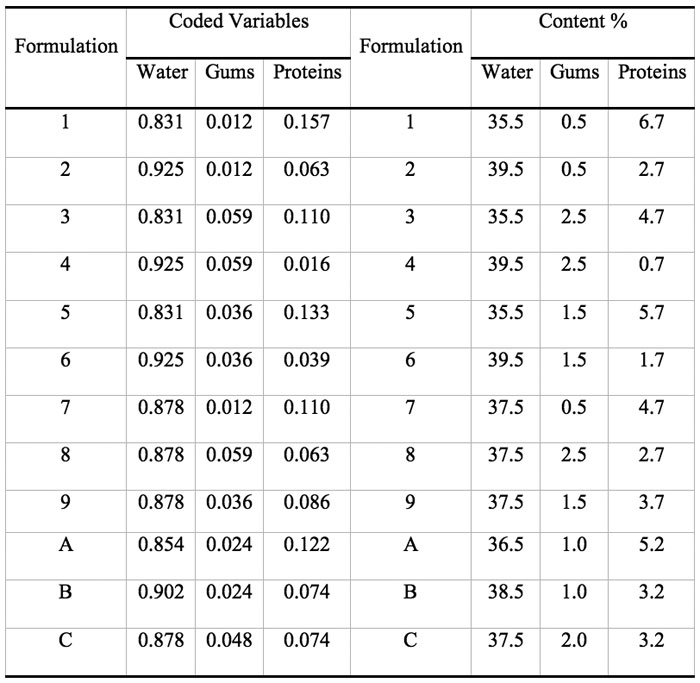
Mixture designs are a special category of response surface designs particularly useful when it is not the literal amounts of a component (factor) that matter but the proportion of the whole made up by each component and they take into account the interdependence of factors by assuming that the factors must sum to equal a constant value (Cornell 2002). When a mixture design is employed, the purpose of the experiment is to model the blending surface either to predict the response for any combination of the ingredients or to determine the influence on the response of each component individually and in combination with the other components. In the present work a simplex-centroid augmented design with constrains was chosen to study the effect of adding gums, protein, and water to a dough formulation containing fixed mass fractions of corn starch and corn flour (53.5 %), NaCl (1.1 %), and sunflower oil (2.7 %). The formulations combined gums (0.51-2.52 %), proteins (0.68-6.70 %), and water (35.5-39.5 %). The initial design consisted of nine runs: four points at the extreme vertices of the feasible region (1, 2, 3, 4), four points at the edge centroids (5, 6, 7, 8), and one point at the overall centroid (9) (Cornell 2002). Three more points (A, B, C) were added to evenly cover the experimental region. Figure 1 displays the actual design points represented as filled circles expressed as coded variables.
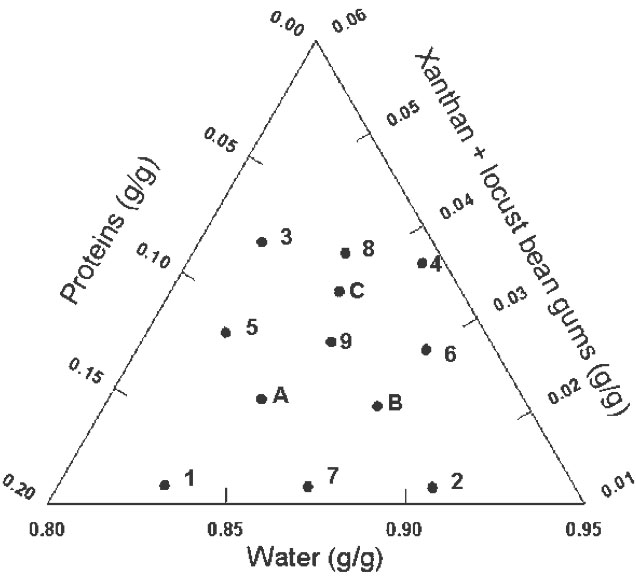
Figure 1: Simplex-centroid augmented design; mass fractions are expressed as coded variables.
Some previous work indicated that it was not advisable to allow these factors to take values anywhere in the range of possible values, e.g. mass fraction of water = 0, and constrained mixtures designs are particularly useful if there are restrictions on the values that each factor (or linear combination of factors) can take; in addition to the overall constraint that factors must sum to 1. Besides the fact that the sum of gums (G), protein (P), and water (W) must constitute 42.7% of the formulation, there are further constraints on each of the factors that are shown in Table 1. Table 2 shows the actual and coded compositions of the 12 formulations studied.
Table 1: Constraints used on the simplex-centroid augmented design.
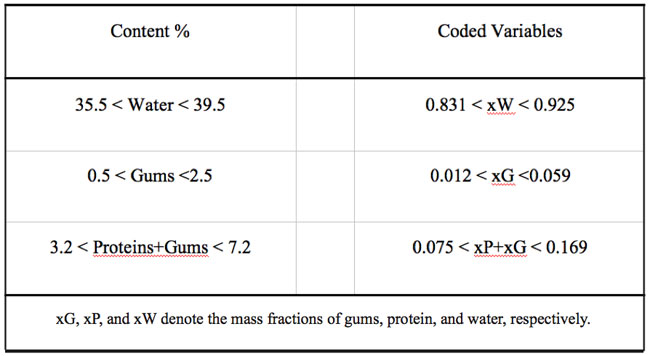
Table 2: Assayed formulations expressed as mass fraction of the pseudocomponents (coded variables) and as percent composition (% = g/100g dough).
Differential Scanning Calorimetry (DSC)
Small parts of dough were sampled from the center. A small circular cutting mold was used to cut the dough, and the dough samples (20±5 mg) were weighed into aluminum DSC pans and hermetically sealed. The equipment was calibrated with indium (m.p. = 156.61ºC and ΔH = 28.54 J/g) and an empty pan was used as a reference. Thermograms were performed from -50ºC to 140ºC, at a heating rate of 5ºC/min, with a modulation of ±1ºC and a 60s period, using a modulated DSC (model Q100, TA Instruments).
At least two replicates were conducted for all samples. Thermograms of doughs were obtained and data were analyzed with Universal Analysis 2000 Windows 2000/XP v. 4.1D (TA Instruments, USA). These curves allowed obtaining the water melting and starch gelatinization enthalpies for each sample. For each endotherm, onset (To), melting (Tm), and conclusion (Tc) temperatures of the gelatinization phenomena, as well as the glass transition temperature (Tg) of each sample were also determined.
The same procedure was used for a mixture of corn starch and water in a (5g: 3.17g) ratio. This ratio was calculated considering that the total water content was equally available to interact with all the solids (proteins, starch, salt, and gums) present in the system; regarding that total water content included water incorporated in the “dry” ingredients.
Total Water Content Determination
Total amount of water present in dough was determined by piercing the DSC pans, and by drying them in an oven at 105ºC until constant weight. Samples were weighed on an analytical balance (0.01 mg).
Determination of the Unfrozen Water Fraction by DSC
The latent heat of melting for each product (ΔHm, J/g sample), was determined as indicated by Roos (1986). The ΔHm was obtained by integrating the melting peak of the thermograms; this value was later used to estimate the unfrozen water fraction in the food material. The temperature integration limits of the peak were chosen when a clear separation between curve and base line was detected.
The weight fraction of frozen water, nw (g water/g dough), was evaluated by method proposed by Ross (1978) from the following expression:
(1) 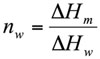
Where ΔHm is the melting enthalpy of the sample (J/g dough) and ΔHw is the latent heat of ice melting (333.9 J/g water). By using Eq. 1 the unfrozen water content (nuw), was determined as the difference between the total water content and the frozen water content (nw).
The amount of water bounded to solutes and solids, b, was estimated as (Eq. 2):
(2) 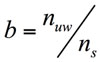
Where ns represents the total fraction of the solids and solutes in the food (g solid/g dough).
Determination of Glass Transition Temperature
The first derivative of the thermogram was used to determine the temperature at the inflection point which was assigned to the glass transition temperature (Tg) of the sample.
Statistical Analysis
Surface response analysis was used to determine the relationship of the unfrozen water of this composite system:
(3) 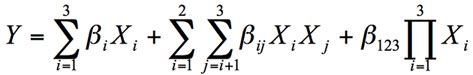
Where Y is the corresponding response variable, Xi are the coded process variables (G, P, W) and β are the regression coefficients. The same methodology was followed with the peak temperature of water melting. The quality of the mixture models were judged by analysis of variance of the regression results. The statistical analyze was accomplished using the SYSTAT software (SYSTAT, Inc, Evanston, IL).
Results and Discussion
Effect of Dough Composition on the Freezing of Water
Water is a primary plasticizer used in processing and manufacturing starch and its products and greatly affects various properties of starch. In a starch–water system, some water interacts directly or indirectly with starch and has detectable property differences from bulk phase water. Roos (1995) called the water that remains unfrozen even at subfreezing temperature “unfrozen water” or “bound water”.
For all the formulations assayed in this work, thermograms show the characteristic water melting peak between -5 and -8ºC and above 65ºC starch gelatinization transition was noticeable (Figure 2).
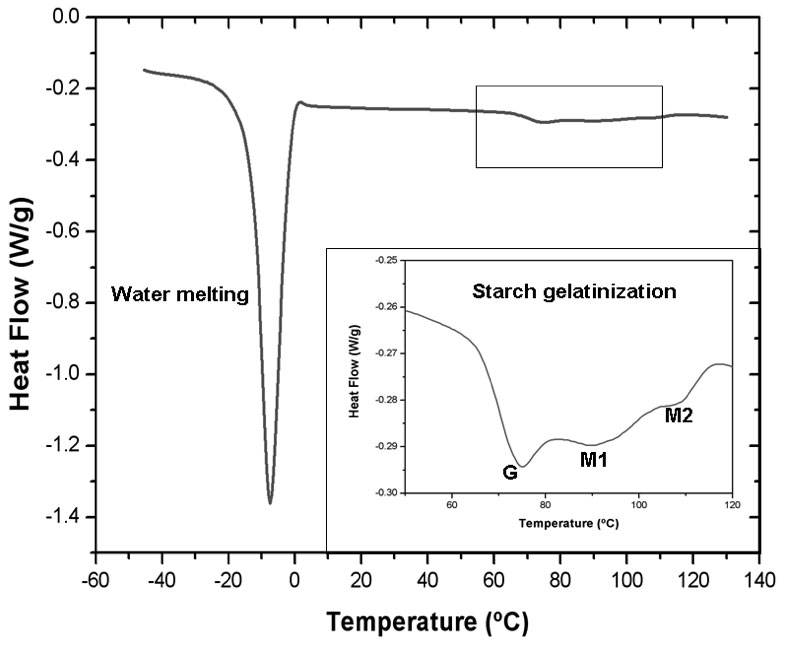
Figure 2: Complete DSC thermogram corresponding to sample 9. The insert shows the gelatinization transitions (G) and (M1) and the melting of the amylose-lipid complexes (M2).
Response surface methodology was successfully applied to a complex system such as gluten-free dough to analyze the effect of each component on the thermal behavior of the dough and to reveal interactions between them. Usually, the addition of hydrocolloids in frozen dough tends to lower water melting enthalpy, indicating a decrease in the frozen water content due to the binding of free water, and helps to control moisture migration. However, in the present work, the unfrozen water of this composite system cannot be predicted by a simple additive rule approach; instead, an equation need to be developed to include complex interactions involving proteins, gums and water fractions to better predict the nuw value of the composite mixture. The response surface analysis of led to a “saddle” type surface, involving several interactions between components (Figure 3).
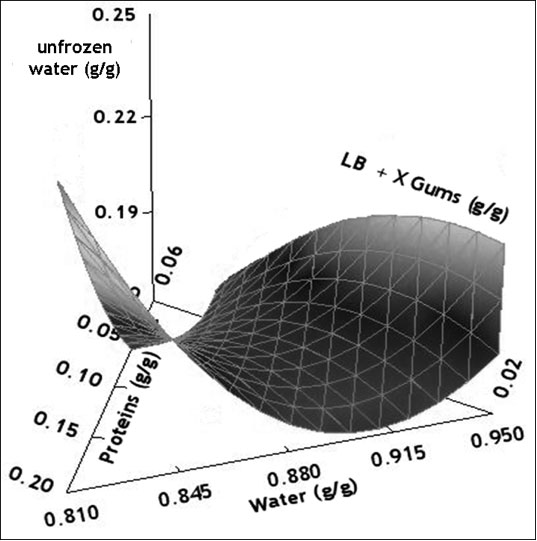
Figure 3: Surface response of the unfrozen water content (g/g total water) as a function of mass fractions of total water, proteins and gums expressed as coded variables (xwater+ xgums + xproteins = 1).
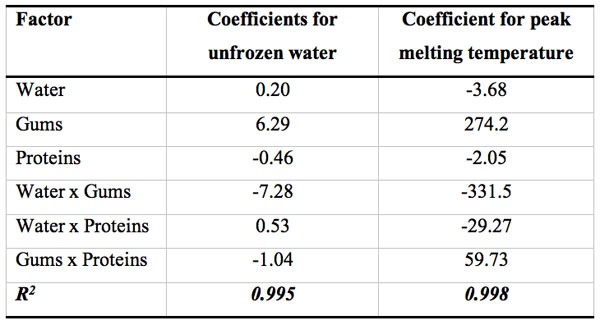
Table 3 shows the regression coefficients for the polynomial model that describes the relationship between the unfrozen water content with gluten-free dough composition. Within the linear contributions, the variable gums content has the largest effect on nuw exhibiting a positive correlation. However, water-gums negative interaction mainly controlled the unfrozen water content on the dough. The negative value of the interaction coefficient suggests the presence of an antagonistic effect between hydrocolloids and water fractions, that is, the effect of gum content of the nuw is not the same for different levels of water.
Table 3: Estimated regression coefficients for the polynomial model used to describe the unfrozen water content (g/g dough) and the peak melting temperature (ºC) as a function of dough composition. Variables were coded according to Table 2.
The mixture of solutes and water, results in altered properties of both constituents. Hydrophilic groups cause changes in the structure and mobility of adjacent water and water causes changes in the reactivity, and sometimes structure of hydrophilic groups (Fennema 1996). Ions and ionic groups of organic molecules hinder mobility of water molecules to a greater degree than do any other types of solutes. From a conceptual standpoint it is useful to think about unfrozen water as “water that exists in the vicinity of solutes and other nonaqueous constituents, and exhibits properties that are significantly altered from those of bulk water in the same system”.
The dependence of peak melting temperature (Tmw) on water, proteins, and hydrocolloids content also showed a saddle-like effect, as could be observed in Figure 4. The same trend as in unfrozen water content was found for the regression coefficient in Tmw, with the largest contribution of the water-gums interaction. However, as expected, Tmw also showed a tendency to increase when the total amount of frozen water in the formulation increased (figure not shown).
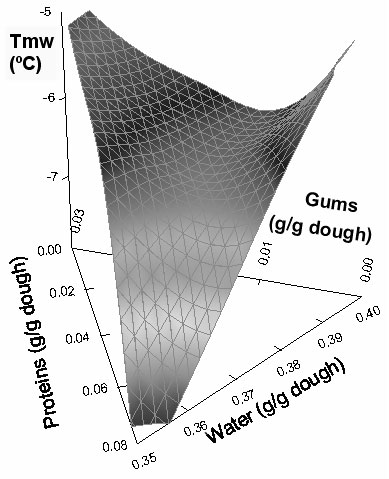
Figure 4: Effect of composition on peak melting temperature (Tmw) of the doughs.
Molecular mobility is an attribute of foods that deserves attention because it is related to many important diffusion-limited properties of foods that contain, besides water, substantial amounts of amorphous, primarily hydrophilic molecules, ranging insides from monomers to polymers. At a sufficiently low temperature or limited content of plasticizer, molecular motion becomes restricted as a glassy solid is formed. On heating or plasticizer addition, the mobility of the amorphous polymers increases and the material becomes flexible or rubbery. Thus, the glass transition denotes a change from brittle to rubbery behavior at a temperature Tg. The Tg depends on molecular characteristics, composition and compatibility of the components in the amorphous matrix (Kalichevsky and Blanshard, 1992; Roos and Karel, 1991), and this is obvious in complex systems such as foods and biomaterials.
The temperature location of the Tg, is dependent on the thermal history of the material, the molecular weight of the polymer chains, the presence of a plasticizer (e.g. water), the degree of crystallinity and the composition of a sample (e.g. miscible polymer blends) (Liu et al.1991; Roos and Karel 1991; Slade and Levine 1995). Glass transition temperatures found in this work were around -26ºC (from -24 to -29ºC) for all the tested formulations. As an example, Figure 5 shows the glass transition of sample 6 (39.5% water, 1.5% gums, 1.7% proteins). These temperatures were influenced by the quantities of water added in the different dough formulations.
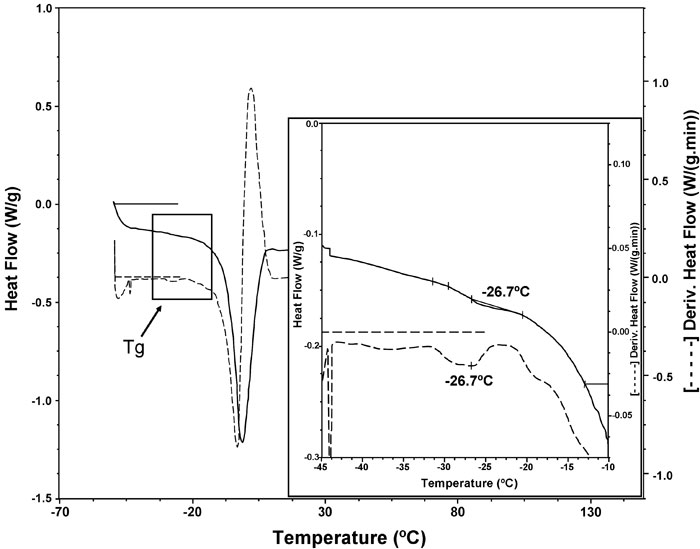
Figure 5: DSC thermogram corresponding to water melting of sample 6 (______ line) and the first derivative ( – – – – – ). The insert shows the glass transition region.
Figure 6 shows a plot of measured Tg vs. frozen water content (g /g dough). It can be observed that increasing the amount of water available to freeze in the dough produced a decrease in (Tg) (P< 0.05). This occurs because the average molecular weight of the mixture decreases.
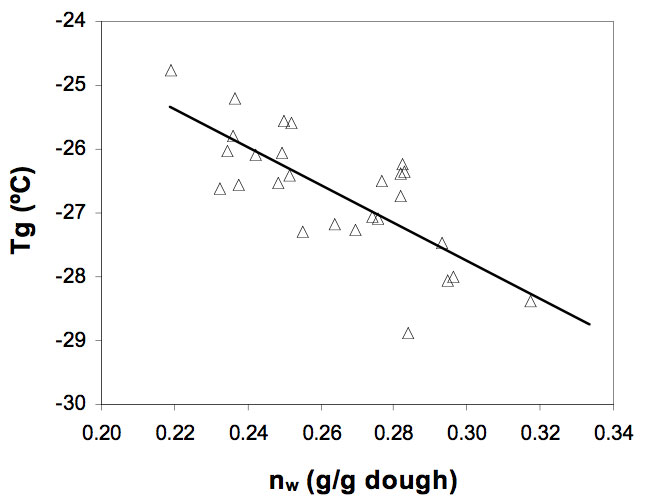
Figure 6: Effect of the frozen water content, nw (g water/g dough) on the glass transition temperature, Tg (ºC) of the gluten-free doughs.
Effect of Dough Composition on Starch Gelatinization
Gelatinization is a term used to describe the molecular events associated with heating starch in water. Starch is converted from a semi-crystalline, relatively indigestible form to (eventually) an amorphous (readily digestible) form. The gelatinization process (in excess water) is believed to involve primary hydration of amorphous regions around and above glass transition temperature (Tg), with an associated glassy-rubbery transition. This in turn facilitates molecular mobility in the amorphous regions (with reversible swelling) which then provokes an irreversible molecular transition. This irreversible step involves dissociation of double helices (most of which are in crystalline regions) and expansion of granules as the polymers (and granule interstices) hydrate.
For starch/water system it was found that the onset temperature (To) reflected the initiation of this process; it was followed by a peak (Tp) and concluded at Tc. After Tc, all amylopectin double helices have dissociated, although swollen granule structures will be retained until more extensive temperature have been applied (Tester and Debon 2000). Particularly, in this work, when corn starch/water mixtures were studied, values of 60.6ºC, 66.9°C, and 74.0ºC were obtained for To, Tp, and Tc, respectively. The temperature range Tc–To = 13.4ºC represents the so called gelatinization period. Sandhu et al. (2004) informed that the To, Tp, and Tc of corn starches-water mixture ranged from 60 to 69.3ºC, 71.5 to 73.1 ºC and 76.5 to 78.0ºC, respectively. For starches of five open pollinated corn populations, White et al. (1990) found the gelatinization period between 8.7ºC and 16.4ºC. For the formulations of gluten-free doughs assayed in this work, To ranged from 67.1ºC to 69.2ºC, Tp from 75.1ºC to 78.2ºC , and Tc from 81.9ºC to 88.1ºC, and the gelatinization period varied between 14.0ºC and 18.9ºC.
In the present study when the dough was heated, starch underwent a series of thermal transitions which involved gelatinization showing a characteristic biphasic endotherm: peak G which has been assigned to the swelling of the starch amorphous region and a cooperative mediated melting of starch crystallites and peak M1 which corresponds to the melting of the most stable crystallites. Peak M2 is assigned to the melting of the amylose–lipid complexes. The appearance of peaks G and M1 demonstrates that there was not enough water available in the system for the gelatinization process.
It is generally accepted that the aqueous media of cooked starch can be described as biphasic systems, formed by a continuous and a disperse phase. In many practical situations, swollen starch particles are the dominant structural feature (Steeneken 1989). In mixed systems such as gluten-free doughs, the situation remains the same, but a further complication arises since the continuous phase is itself an aqueous mixture of amylose and added hydrocolloid; without considering the possible solubilization of the amylopectin during pasting (Tecante and Doublier 1999). Depending on the ratio of the biopolymers and the gelling technique, one of the biopolymers forms a continuous phase into which the other is dispersed, or two continuous networks in a bicontinuous system can be formed (Autio et al. 2002). The picture is further complicated by the presence of the added proteins.
Once all the available water that is external to the granule has been exhausted, the cooperative plasticization process is arrested, and further gelatinization depends upon increased levels of molecular mobility and granular swelling that are initiated and enhanced by heat. These conditions demand heating to higher temperatures than in excess of water. Gelatinization is about breakage (endothermic) and formation (exothermic) of hydrogen bonds in the starch; therefore it is reasonable to accept that there would be more breakage of intramolecular bonds when more water is present, which penetrates and swells the amorphous region thereby increasing mobility. Figure 7a shows that for a given water content the addition of hydrocolloids caused a significant increase (P<0.05) of peak G, this was probably the result of the interaction starch-hydrocolloid, that produced a more stable structure, needing a higher temperature for disorganization.
The presence of hydrocolloids in the dough causes the union of the protons (H+) of water and also the linkage of the amylose chains with this hydrocolloid, which in consequence, promotes certain inhibition in the gelatinization, causing an increase of its Tp (Rojas et al., 1999). Ribotta et al. (2004) found that non-frozen dough with guar gum had a higher To than non-frozen dough without additives.
On the other hand, peak G temperature decreased when the amount of water increased, maintaining constant gums concentration, that is, more water was available to penetrate the granule and mediate in the gelatinization process (Figure 7b).
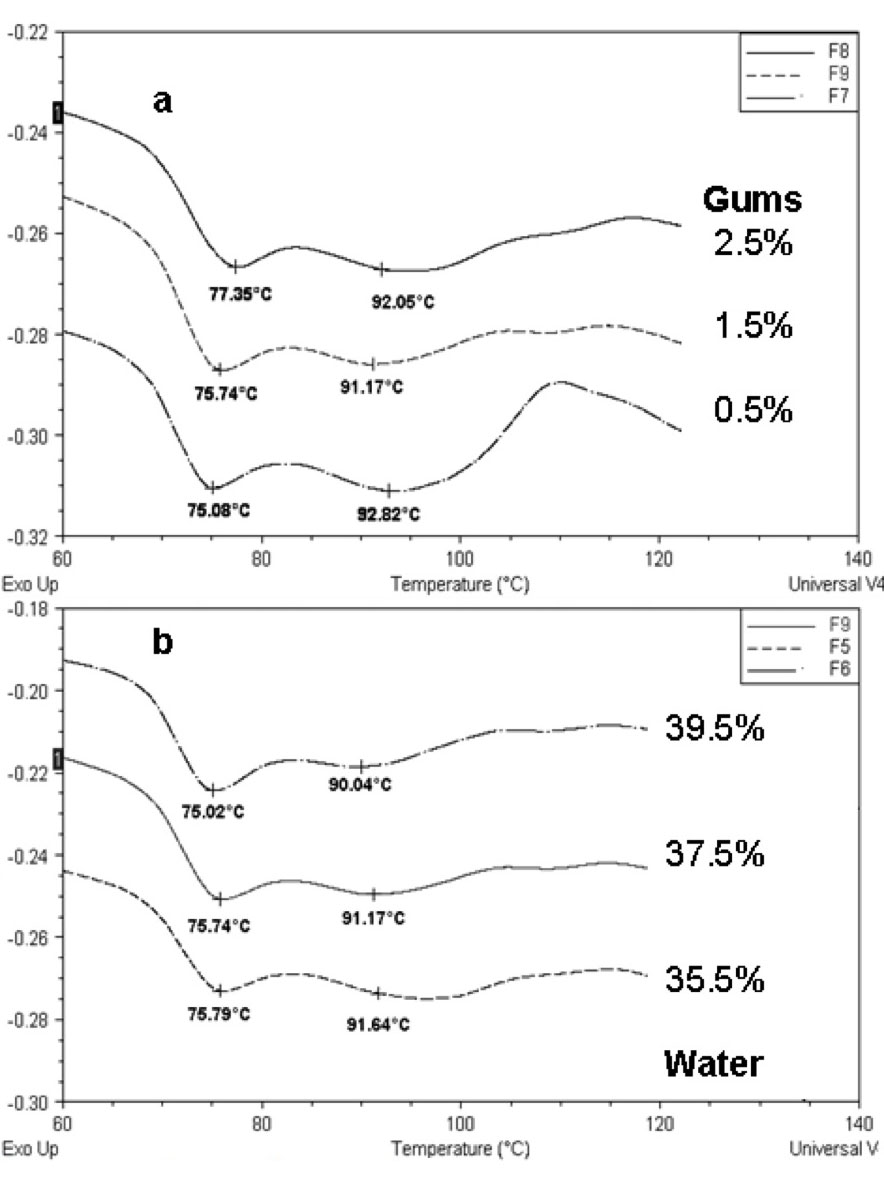
Figure 7: Thermograms corresponding to the gelatinization transition for (a) Samples 7, 8, 9 (37.5% water) and (b) Samples 5, 6, 9 (1.5% gums). Key for the formulations is given in Table 2.
When the frozen water content of the dough was progressively reduced (0.334 to 0.219g water/g dough), endotherms shifted to higher temperatures (peak G from 74.98 to 77.34ºC) as less water was available (Figure 8); and a linear relationship between maximum temperature of peak G and frozen water content was found. As the amount of unfrozen water increased, the amount of water capable of freezing in the conditions of the DSC experiments decreased; water mobility diminished and the water-diffusion mediated step of the transition (peak G) needed more energy to occur.
With respect to the gelatinization enthalpies no significant differences (P>0.05) were observed among the samples studied.
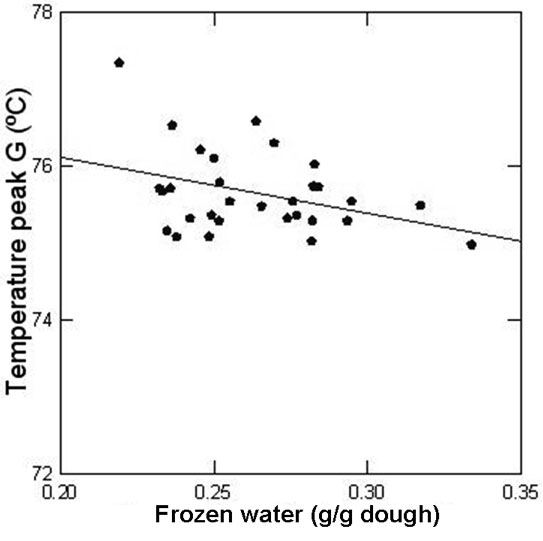
Figure 8: Relationship between the temperature of peak G and the amount of frozen water in the dough determined by DSC.
These results support the hypothesis that the reduced level of solvent plasticization, resulting from the addition of non-aqueous solutes to the pure water system, produces the elevation of the gelatinization temperature. Reduced level of solvent plasticization of the amorphous growth ring regions requires the input of a greater amount of thermal energy before the starch granule swells and begins to gelatinize.
Conclusions
The effect of proteins and hydrocolloids content on the water availability in a gluten-free pasta formulation was studied using differential scanning calorimetry.
The analysis revealed significant interactions between components in the mixture. Predictive regression models were used to plot mixture response surfaces of unfrozen water content and melting temperature of water as a function of composition. Water-gums negative interaction mainly controlled the unfrozen water content on the dough. The response surface methodology led to a “saddle” type relationship between the unfrozen water and the dough composition showing the complex interactions between single components.
Increasing the amount of water in the dough available to freeze produced a decrease in glass transition temperatures of the systems reflecting the higher mobility of macromolecules present.
A biphasic endotherm was observed in the gelatinization transition for all formulations and a significant displacement to higher temperatures of the endotherms was observed when the hydrocolloids content was increased or water content decreased. As the amount of unfrozen water increased, freezable water and thus water mobility decreased and the water-diffusion mediated step of the transition (peak G) needed more energy to occur.
Acknowledgements
The authors are grateful to Tecnovo, S.A., Argentina, who provided the dried egg and the ovoalbumin protein for this study. The financial support of the Consejo Nacional de Investigaciones Científicas y Tecnológicas (CONICET), Agencia Nacional de Promoción Científica y Tecnológica and Universidad Nacional de La Plata are also acknowledged.
References
Ahmad FB, Williams PA (2002) Gelatinisation properties of sago starch in the presence of salts, in The Gums and Stabilisers for the Food Industry 11: 145–157
A. Williams & G. O. Phillips (Eds.) Royal Society of Chemistry. Cambridge, UK
Autio K, Vesterinen E, Stolt M (2002). Rheological properties of mixed starch-k-carrageenan gels in relation to enzymatic digestibility. Food Hydrocoll 16: 169–174
BeMiller JN, Whistler RL (1996). Carbohydrates, in OR Fennema (Ed.) Food Chemistry 157-224. Marcel Dekker. New York.Inc.195
Biliaderis CG, Maurice TJ, Vose JR (1980) Starch gelatinisation phenomena studied by differential scanning calorimetry. J Food Sci 45: 1669–1680.
Blanshard, JMV (1987). In T. Galliard, Starch: Properties and potencial: 17-18. Willey
Califano AN, Añón MC (1990) Differential Scanning Calorimetry of Mung Bean Starch. J Food Sci, 55: 771-773
Chaisawang M, Suphantharika M (2006). Pasting and rheological properties of native and anionic tapioca starches as modified by guar gum and xanthan gum. Food Hydrocoll 20: 641–649.
Chiotelli E, Rolée A, Le Meste M (2000) Effect of sucrose on the thermomechanical behavior of concentrated wheat and waxy corn starch–water preparations. J Agric Food Chem 48: 1327–1339
Chiotelli E; Pilosio G; Le Meste M (2002) Effect of sodium chloride on the gelatinization of starch: a multimeasurement study. Biopolym 63: 41-58.
Chungcharoen A, Lund DB (1987). Influence of solutes and water on rice starch gelatinization. Cereal Chem 64: 240–243.
Coleman NJ, Craig QM (1996) Modulated temperature scanning calorimetry: a novel approach to pharmaceutical thermal analysis. Int J Poly Pharmaco 135: 13–299
Cornell JA. (2002) Experiments with Mixtures: Designs, Models, and the Analysis of Mixture 22-95, 132-220. John Wiley & Sons. New York
Donovan JW (1979) Phase transitions of starch–water system, Bioploym 18: 263–275.
Eliasson AC (2004) Starch in food: Structure, function and applications Boca Raton, Boston, New York, Washington, DC; CRC Press: 64-71, 295–300, 334–336, 578
Fennema OR (1996) Water and Ice, in OR Fennema (Ed.) Food Chemistry 17-94. Marcel Dekker. New York.Inc.195
Ferrero C, Martino MN, Zaritzky NE (1996) Effect of hydrocolloids on starch thermal transitions, as measured by DSC. J Therm Anal 47: 1247-1266
Fukuoka M, Ohta KI, Watanabe H, (2002) Determination of the terminal extent of starch gelatinisation in a limited water system by DSC. J Food Eng 53: 39-42.
Gallagher E, Gormley TR, Arendt EK (2004). Recent advances in the formulation of gluten-free cereal-based products. Trends Food Sci & Technol 15: 143-152.
Gallagher PK (1997) Thermo-analytical instrumentation, techniques and methodology, in Thermal Characterization of Polymeric Materials (A. Turi, Ed), Academic Press, New York, NY. 2–203.
Hirashima M, Takahashi, R Nishinari K (2005) Changes in the viscoelasticity of maize starch pastes by adding sucrose at different stages. Food Hydrocoll 19: 777–784.
Ikeda K, Asami Y (2000) Mechanical characteristics of buckwheat noodles. Fagopyrum 17: 67-72
Ikeda K, Asami Y, Linj R, Honda Y, Suzuki T, Arap R, Yasumoto K (2005) Characterization of buckwheat noodles with various dough-binders with respect to mechanical characteristics. Fagopyrum 22: 63-69
Jane JL (1993). Mechanism of starch gelatinization in neutral salt solutions. Starch 45: 161–166.
Jenkins PJ, Cameron RE, Donals AM, Bras W, Derbyshire GE, Mant GR, Ryan AJ (1994). In situ simultaneous small and wide angle X-ray scattering: a new technique to study starch gelatinisation. J Poly Sci Phys 32: 1579-1583
Jiménez-Avalos HA, Ramos-Ramírez EG, Salazar-Montoya JA (2005) Viscoelastic characterization of gum arabic and maize starch mixture using the Maxwell model. Carbohyd Polym 62: 11–18
Jyothi AN, SasikiranK, Sajeev MS, Revamma R, Moorthy SN (2005). Gelatinisation properties of cassava starch in the presence of salts, acids and oxidising agents. Starch 57: 547–555.
Kalichevsky MT and Blanshard JMV (1992) A study the effect of water on the glass transition of 1:1 mixtures of amylopectin, casein and gluten using DSC and DMTA. Carbohyd Polym 19: 271–278.
Karlsson ME, Eliasson AC (2003) Gelatinization and retrogradation of potato (Solanum tuberosum) starch in situ as assessed by differential scanning calorimetry (DSC).LWT Food Sci Tech 36: 735–741.
Kruger A, Ferrero C, Zaritzky NE (2003) Modelling corn starch swelling in batch systems: effect of sucrose and hydrocolloids. J Food Eng 58: 125-133
Lazaridou A, Duta D, Papageorgiou M, Belc N, Biliaderis C (2007) Effects of hydrocolloids on dough rheology and bread quality parameters in gluten-free formulations. J Food Eng 79: 1033-1047.
Lelievre J (1976) Theory of gelatinisation in starch–water solutes systems. Polymer 17: 854-857.
Liu H, Lelievre J, Ayong-Chee W (1991). Study of starch gelatinisation using differential scanning calorimetry. X-ray and birefringence measurements. Carbohyd Res 210:79-87
Lorenzo G, Zaritzky NE, Califano AN (2008) Optimization of non-fermented gluten-free dough composition based on rheological behavior for industrial production of ‘‘empanadas’’ and pie-crusts. J Cereal Sci 48: 224–231.
Maaurf AG, Che Man YB, Asbi BA, Junainah AH, Kennedy JF (2001) Gelatinisation of sago starch in the presence of sucrose and sodium chloride as assessed by differential scanning calorimetry. Carbohyd Polym 45: 335–345.
Manley D (2001). Biscuit, cracker and cookie recipes for the food industry. Woodhead Publishing Ltd. Cambridge, England 155-174.
Oosten BJ (1982) Tentative hypothesis to explain how electrolytes affect the gelatinization temperature of starches in water. Starch 34: 233–239.
Oosten BJ (1983). Explanations for phenomena arising from starch–electrolytes interactions. Starch 35: 166–169.
Oosten BJ (1990). Interactions between starch and electrolytes. Starch 42: 327–330.
Ortega-Ojeda FE, Larsson H, Eliasson AC (2004) Gel formation in mixtures of amylose and high amylopectin potato starch. Carbohyd Polym 57: 55–66
Pravisani CI, Califano AN, Calvelo A (1985) Kinetics of starch gelatinization in potato. J Food Sci 50: 657–660
Ribotta PD, Pérez GT, León AE, Añón MC (2004) Effect of emulsifier and guar gum on micro structural, rheological and baking performance of frozen bread dough. Food Hydrocoll 18: 305–313
Rojas JA, Rosell CM, Benedito de Barber C (1999) Pasting properties of different wheat flour-hydrocolloid systems. Food Hydrocoll 13: 27-33
Ross KD (1978). Differential scanning calorimetry of nonfreezable water in solute-macromolecules-water systems. J. Food Sci 43:1982-1915.
Roos, YH. (1986). Phase transitions and unfreezable water content of carrots reindeer meat and white bread studied using differential scanning calorimetry. J. Food Sci. 51, 684-686.
Roos YH and Karel M (1991) Water and molecular weight effects on glass transition in amorphous carbohydrates and carbohydrate solutions. J Food Sci 56: 1676–1681.
Roos, YH (1995) Phase Transitions in Foods, Academic Press, New York, 19-47, 73-103.
Slade L and Levine H (1995). Glass transitions and water-food structure interactions. Adv Food Nutr Res. 38: 103-179.
Sandhu KS, Singh N, Kaur, M (2004) Characteristics of the different types and their grain fractions: Physicochemical, thermal, morphological, and rheological properties of starches. J Food Eng 64: 119–127.
Sopade PA, Halley PJ, Junming LL (2004) Gelatinisation of starch in mixtures of sugars. II. Application of differential scanning calorimetry Carbohyd Polym 58: 311-321
Steeneken PAM (1989) Rheological properties of aqueous suspensions of swollen starch particles. Carbohyd Polym 11: 23–42.
Tan H-Z, Li Z-G, Tan B (2009) Starch noodles: History, classification, materials, processing, structure, nutrition, quality evaluating and improving. Food Res Int 42: 551–576
Tecante A, Doublier JL (1999) Steady flow and viscoelastic behavior of crosslinked waxy corn starch-κ-carrageenan pastes and gels. Carbohyd Polym 40: 221–231.
Tester RF, Debon SJJ (2000) Annealing of starch — a review. Int J Biol Macromol. 27: 1-12.
Tolstoguzov VB (2000). Foods as dispersed systems. Thermodynamic aspects of composition-property relationships in formulated food. J Therm Anal Calorim 61: 397-409
Viturawong Y, Achayuthakan P, Suphantharika M (2008) Gelatinization and rheological properties of rice starch/xanthan mixtures: Effects of molecular weight of xanthan and different salts. Food Chem 111: 106–114
White PJ, Abbas IR, Pollak L, Johnson LJ (1990). Intra and interpopulation variability of thermal properties in maize starch. Cereal Chem 67: 70–73.
Wootton M, Bamunuarachchi A (1979a) Application of differential scanning calorimetry to starch gelatinisation. I. Commercial native and modified starches. Starch 31: 201–204.
Wootton M, Bamunuarachchi A (1979b) Application of differential scanning calorimetry to starch gelatinisation. II. Effect of heating rate and moisture level. Starch 31: 262–264.
Wootton M, Bamunuarachchi A (1980) Application of differential scanning calorimetry to starch gelatinisation. III. Effect of sucrose and sodium chloride. Starch 32: 126–129.
Zhan DF, Ridout MJ, Brownsey GJ, Morris VJ (1993) Xanthan-locust bean gum interactions and gelation. Carbohyd Polym 21: 53-58.
Zobel HF, Yong SN, Rocca LA (1988) Starch gelatinisation: an X-ray diffraction study. Cereal Chem 65: 443-446
Web References
1.) BeMiller, FS, Daniels, JR, 2002. Guar–xanthan interactions. Available from: http://www.cfs.purdue.edu/class/F&N630/Virt_Class_2/guarandLBG.htm. Accessed December 4, 2010.
Discussion with Reviewers
Anonymous Reviewer: The main point is that starch gelatinization was studied using DSC. It seems that the variation in water content was minor and probably not sufficient to have effects on measured properties to beyond natural variation.
V. Larrosa, G. Lorenzo, N. Zaritzky & A. Califano: The variation of water content in dough formulation was chosen keeping in mind that above 39.5% it was very difficult to handle or knead the samples and roll them into a sheet; below 35.5% the dough was extremely brittle, resisting only very small deformations under elongation tests (Lorenzo, Zaritzky and Califano, 2008).
However, these small variations were enough to show significant differences in DSC peak temperatures.
Reviewer: The formulation design software is not very appropriate to study gelatinization temperatures.
Larrosa, Lorenzo, Zaritzky & Califano: We do not understand what the reviewer means by “formulation design software”. There are several softwares that can deal with mixture designs and Systat 12 is certainly one of them. The software simplifies the prediction of the compositions that should be studied in order to minimize the errors in the predictions.
If the reviewer is referring to the mixture design chosen; mixture designs are a special category of response surface designs particularly useful when it is not the literal amounts of a component (factor) that matter but the proportion of the whole made up by each component and they take into account the interdependence of factors by assuming that the factors must sum to equal a constant value (Cornell 2002). The fact that the proportions must add up to one is the key attribute of mixture designs.
Sometimes a factorial design is employed because of its simplicity to establish the compositions of the nodes, but if, as in this case, two components are varied, the third component changes automatically. This effect is not considered in the usual factorial designs. The main distinction between mixture experiments and independent variable experiments is that with the former, the input variables or components are non-negative proportionate amounts of the mixture, and if expressed as fractions of the mixture, they must sum to one. If for some reason, the sum of the component proportions is less than one, the variable proportions can be rewritten as scaled fractions so that the scaled fractions sum to one.
We found that the mixture design with constrains used in the present work was suitable to predict the surface response of the desired variables since using this approach the parameters of the polynomial regressions were calculated with minimum errors.
Reviewer: The authors should mention that the calculation of unfrozen water using melting heats is only indicative as it does not take into account the melting temperatures etc.
Larrosa, Lorenzo, Zaritzky & Califano: We agree with the Reviewer that ice formation changes solute concentration in the formulation and that the latent heat of fusion is the average heat of melting over the temperature range. According to published results the effective latent heat of fusion of ice decreased with increasing concentration of the solution (Kumano et al., 2007). These authors reported that that effective latent heat decreased in aqueous solutions, and the amount of the decrease in latent heat depended on the solute. It was also found that effective latent heat of fusion in aqueous solutions could be calculated by considering the effects of freezing point depression and dilution heat in each aqueous solution. Exothermic or endothermic reactions occurred when the solution was diluted with water due to melting of ice, and then effective latent heat of fusion varied.
However enthalpy variation is small in diluted solutions: for example in the case of NaCl solution as the concentration of solute increases from 0 to 5% w/w the enthalpy decreased only from 333.9 J/kg to 330 J/kg (lower than 1 %). Therefore we assumed for our calculations of frozen water fraction the enthalpy of pure water.
The fraction of frozen water was obtained according to the method of Weast and Astle (1981) as the ratio between the latent heat of melting determined for the material and the heat of melting of pure water, 333.9 J/g.