
 Equilibrium and Thermodynamic Studies for Adsorption of Crystal Violet onto Spent Tea Leaves (STL)
Sunil Kumar Bajpai1* and Arti Jain2
1 Polymer Research Laboratory, Dept. of Chemistry, Govt. Model Science College (Auton.) Jabalpur (M.P.) 482001 India
2 Dept. of Chemistry, Shri Ram Institute of Science & Technology, Jabalpur (M.P.) 482001 India
*Correspondence E-mail: sunil.mnlbpi@gmail.com
Key Words: Adsorption, Crystal violet, Isotherm, Gibbs free energy
Received November 22nd, 2011; Accepted July 23rd, 2012; Published November 11th, 2012; Available online November 15th, 2012
Summary
In this work, equilibrium sorption of crystal violet (CV) has been carried out onto spent tea leaves at different temperature in batch experiments. The specific surface area (BET) of spent tea leaves is 1.141 m2/g. The adsorption is found to be favored at higher temperature. The order to fitness of various isotherm models, when applied on equilibrium uptake data, was found to be Langmuir = Temkin > Freundlich. The values of Langmuir constants, Qo(mg g-1)and b(lmol-1)ere found to be 114.94 and 80457.6;185.18 and 52795.2;285.71 and 41983.2 at 25º, 37º and 50ºC respectively. The value of sorption mean free energy from the Dubinin-Radushkevich isotherm was found to be in the range of 9.45 to 11.11 kJ mol-1, indicating ion-exchange mechanism. Thermodynamic quantities, i.e. ∆Gºads, ∆Hºads and ∆Sºads have also been evaluated using Langmuir isotherm model. The negative ∆Gºads values indicated spontaneous nature of the adsorption process.
Article Outline
- Introduction
- Materials and Methods
- Results and Discussion
- Conclusions
- References
- Discussion with Reviewers
Introduction
Crystal violet (CV), a basic dye, is most widely used for the dyeing of cotton, wool, silk, nylon, paper, leather etc., among all other dyes of its category (Tahir and Rauf 2006) In fact, basic dyes, such as crystal violet, are the brightest class of soluble dyes whose tinctorial values are very high; less than 1 mg L-1 of the dye produces an obvious coloration. The coloration of water by these dyes may have an inhibitory effect on photosynthesis, thus affecting aquatic eco-systems. Dyes may also be problematic if they are broken down anaerobically in the sediment as toxic amines which are often produced due to incomplete degradation by bacteria. Some of the dyes or their metabolites are either toxic or mutagenic and carcinogenic. (Hamdaoui and Chiha 2007) Many processes have been applied for the removal of synthetic dyes from wastewater. These include: solar photo-fenton degradation (Duran et al. 2008), photo catalytic degradation (Sun et al. 2008), integrated chemical-biological degradation (Sudarjanto et al. 2006), electrochemical degradation (Fan et al. 2008) and adsorption (Hameed 2009). Activated carbon adsorption appears to be one of the most widely used techniques for dye removal (Karaca 2008), but in view of the high cost and associated problems of regeneration, there has been a constant search for alternate low cost adsorbents. Such types of adsorbents include bentonite clay (Wei et al. 2009), montomorillonite clay (Almeida et al. 2009), coconut husk (Jain and Shrivastava 2008), Moroccan clay (Karim et al. 2009), sawdust (Batzias and Sidiras 2007), palm ash (Ahmad et al. 2007), pumpkin seed hull (Hameed and El-khaiary 2008), activated desert plant (Bestani et al. 2008); rice straw (Gong 2007) and etc.
In the previous study we have used spent tea leaves (STL) as a cost-effective biosorbent for the removal of crystal violet and documented the results of dynamic sorption studies (Bajpai and Jain 2010). However, the equilibrium sorption isotherms are of fundamental importance in the design of adsorption systems. In batch systems, equilibrium is established between the liquid phase (free sorbate solution) and the solid phase (adsorbent attached solute) (Bajpai and Jain 2010). In general, isotherm models are used frequently not only to describe the distribution of solute between sorbate and sorbent but they reflect the mechanistic aspects of sorption process for a particular sorbate/sorbent system. Therefore, in the present study we have investigated the equilibrium uptake of crystal violet onto sorbent spent tea leaves (STL). In continuation of our previous investigations, we hereby report the results of equilibrium sorption studies for uptake of CV onto STL sorbent at different temperatures.
Materials and Methods
Crystal violet (mol. formula C25H30ClN3 structure as shown in Fig.1) was received from HiMedia Chemicals, Mumbai, India and used as received. In order to prepare the sorbent spent tea leaves (STL), tea dust was purchased from a local manufacture (Flora Tea company, product code, U33C2, India) and it was continuously extracted with hot water until it gave up to produce color and then finally dried in a dust free chamber at 50ºC until constant weight. The dried powder was passed through standard sieve to get particles with average geometrical diameter of 250-211 μm. The sorbent was kept in air tight container for further use.
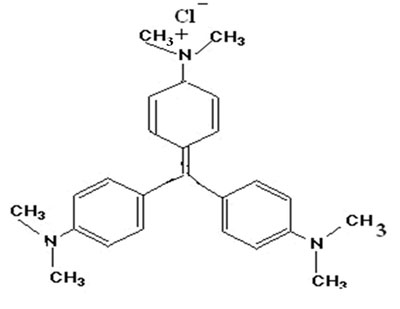
Figure 1: Crystal violet (mol. formula C25H30ClN3) structure.
The dried powder was passed through a standard sieve to get particles with an average geometrical diameter of 250-211 μm. The sorbent was kept in an airtight container for further use.
Characterization of Adsorbent
The physico-chemical parameters were determined using methods reported in our previous work. (Bajpai and Jain 2010) The point of zero charge, pHpzc of adsorbent was determined by the method described elsewhere. (Tan et al. 2008) In brief, 50 ml of 0.01M NaCl solutions were placed in various Erlenmeyer flasks. Their pH was adjusted to different values between 2 to 10 by the addition of 0.1 M HCl or NaOH solutions. Now 0.2 g of adsorbent powder was added into each solution and the final pH of these solutions was recorded after 48 hours.
The pHpzc is the point where the curve pHfinal verses pHinitial intersects the straight line corresponding to pHinitial = pHfinal. The crystalinity of adsorbent particles, before and after the adsorption process, was determined by XRD analysis using minislex II desktop X ray diffraction JAPAN. The surface morphology of the adsorbent particles was determined using a JOELJSM840A (Japan) scanning electron microscope. The FTIR spectra of plain and dye crystal violet loaded STL was recorded using a FTIR spectrophotometer (Shimadzu, 8400S).The percent of carbon, hydrogen, nitrogen and oxygen were also determined at the Indian Institute of Technology, Mumbai, India.
Equilibrium Sorption Studies
Equilibrium uptake experiments were carried out by contacting 0.01g of sorbent with 50 ml of CV solution of different initial concentrations (5 to 50 mg L-1) under the controlled pH value of 8.0. Here it is noteworthy that in our previous report on the same adsorbent/adsorbate system (Bajpai and Jain 2010) it was found that maximum dye uptake occurred in the vicinity of pH 8.0 of the sorption system. A series of Erlenmeyer conical flasks was shaken at a constant speed of 100 rpm in a shaking water bath with temperatures, 298, 310 and 324 K respectively. After 1 hour, the samples were centrifuged and the left out concentration in the supernatant solution was analyzed at 583 nm using spectrophotometer (Thermoscientific spectrophotometer U.S.A.). It is to be noted that in a series of preliminary experiments we determined the adsorption capacity of STL by agitating at different times. It was found that a period of 1 hour was sufficient for the attainment of equilibrium. The data, obtained in batch mode studies, was used to calculate the amount of sorbate sorbed in mg per gram of sorbent using the formula given below:
(1) 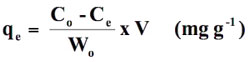
where Co and Ce are concentrations (mg L-1) of CV solutions in the beginning and at the end of adsorption experiment respectively, V is the volume of sorbate solution (in liter) taken in adsorption study and Wo is the amount (g) of sorbent taken. All the experiments were carried out in triplicate and average values have been reported in the data. In order to evaluate the suitability of the different isotherm models, the following error functions were used.
Error Analysis
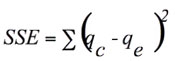
In order to confirm the best fit model for the equilibrium sorption data, it is necessary to analyze the data using error analysis. The following error functions were used (Gimbert et al 2008):
• The sum of the squares of the errors (SSE)
(2) 
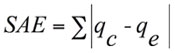
• The sum of the absolute errors (SAE)
(3) 
• The average relative error (ARE)
(4) 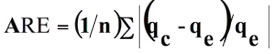
where n is the number of experimental data points, qc is the predicted (calculated) quantity of dye adsorbed according to the isotherm equations and qe is the experimental data.
The various error functions, namely SSE, SAE, ARE and R2 obtained for different isotherm model at 25, 37 and 50ºC are given in Table 1.
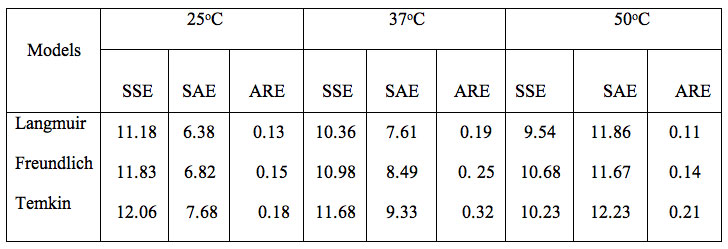
Table 1: Values of error functions about isotherm models.
A close observation of the different values indicates that the Langmuir isotherm model demonstrates a maximum value of R2 and minimum of other three error functions. This suggests that out of the three models studied the Langmuir model is found to be most suitable for the experimental equilibrium uptake data.
Results and Discussion
Physico-chemical Analysis of the Adsorbent
The various physico-chemical parameters are shown in Table 2.
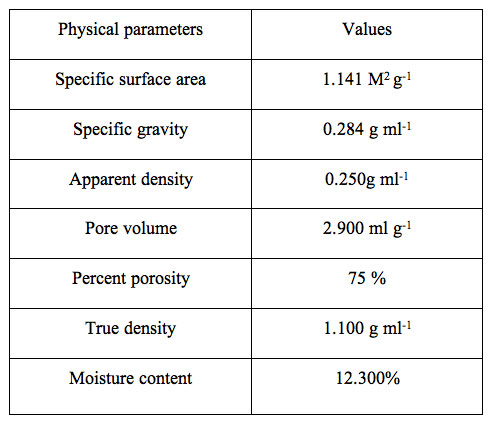
Table 2: Physical parameters of spent tea leaves sorbent (STL).
The values displayed reveal the porous nature of the adsorbent. The CHNO estimation profile is also shown in Figure 2 along with the experimental condition.
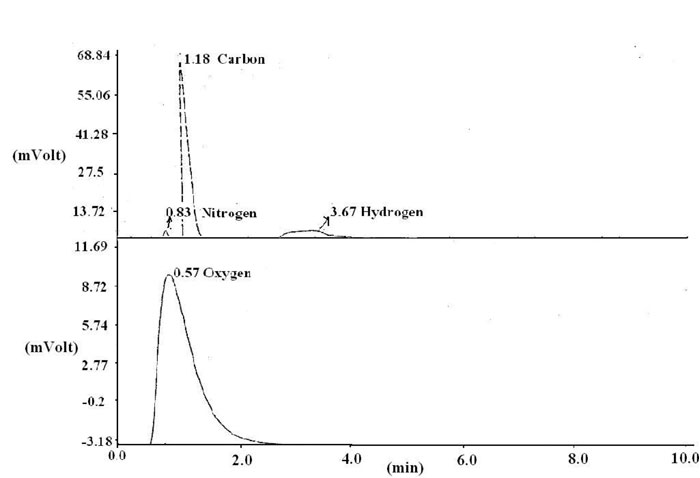
Figure 2: CHNO profile for elemental analysis.
It is clear from the values displayed the percentages. The related parameters used for calculation of % composition of various constituents are given in Table 3. The percentages of carbon, hydrogen, nitrogen and oxygen were found to be 44.42, 6.37, 3.42 and 27.02 respectively.
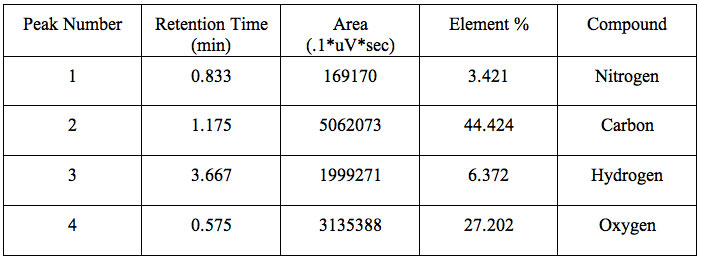
Table 3: CHNO elemental analysis.
SEM Analysis
The surface texture of the sorbent is shown in Figure 3a. It is clear from Fig. 3a that particles are almost irregular in shape but on an average they exhibit more or less the same size. On further magnification, as shown in Figure 3b, the surface can be seen to seem to posses a porous texture as is clear in the image obtained with x 800 magnification.
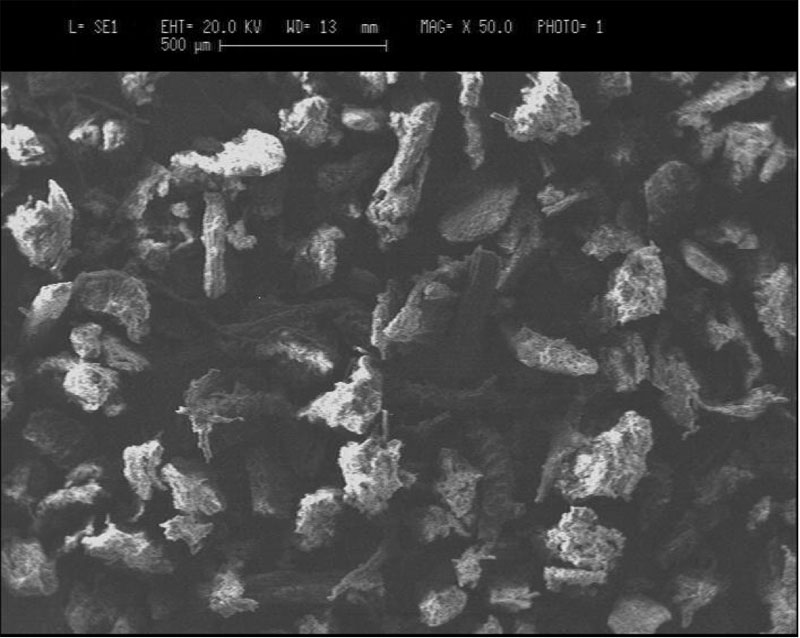
Figure 3a: SEM images of the sorbent particles, obtained at a magnification of 50 times.
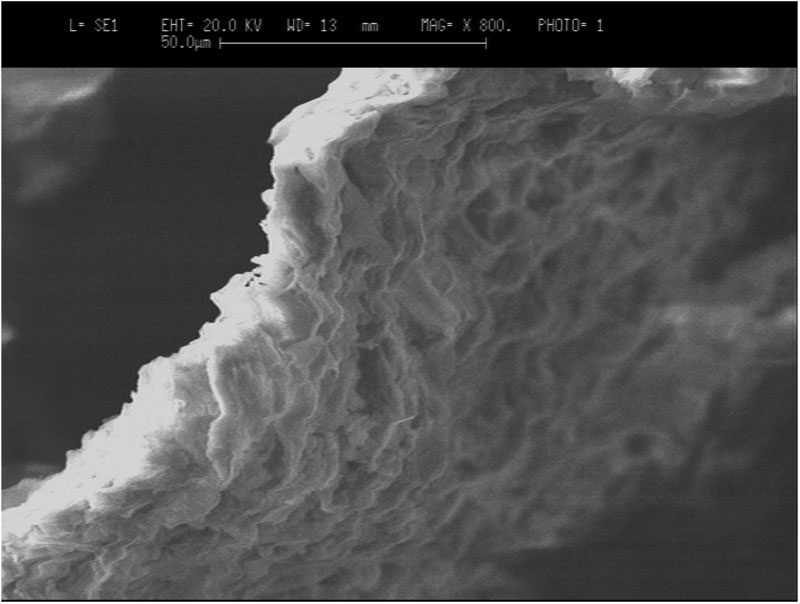
Figure 3b: SEM images of the sorbent particles, obtained at a magnification of 800 times.
Point of Zero Charge
Finally the point of zero-charge, as shown in Figure 4, was evaluated to be 6.8. This indicates that the adsorbent acquires a positive charge below pH 6.8 due to the protonation of –OH groups to –OH2+ groups while the –COOH groups impart a negative charge above pH 6.8 due to ionization into –COO– groups.
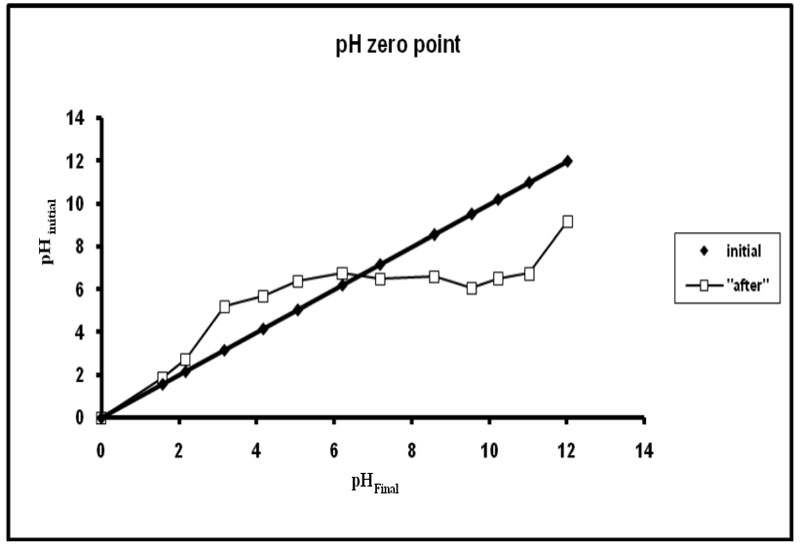
Figure 4: Determination of point of zero charge.
XRD Analysis
The chemical composition of the insoluble portion, obtained after hot water extraction of green tea leaves, consists of cellulose (37%), lignin and structure proteins (14.7%) hot water insoluble proteins (12%) and polyphenols (25%) as major constituents. Therefore the XRD pattern is expected to exhibit crystallinity. Figure 5 shows the XRD pattern of (a) STL and (b) crystal violet adsorbed STL.
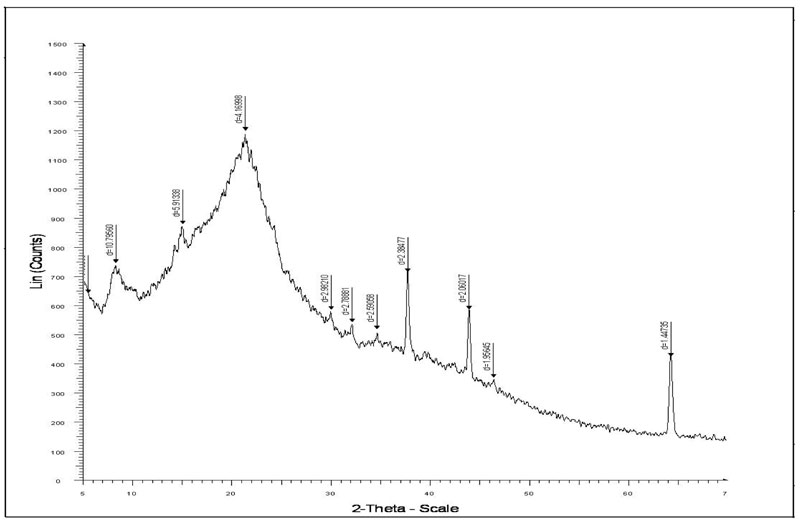
Figure 5a: XRD analysis of Spent Tea Leaves.
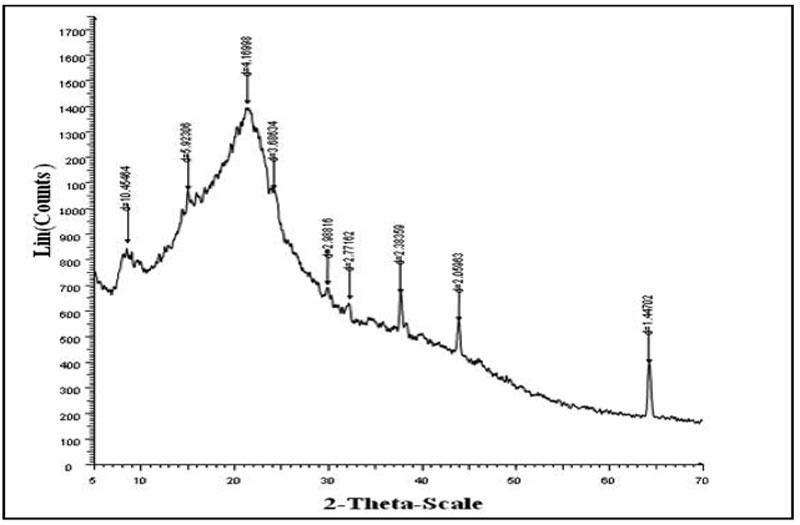
Figure 5b: XRD analysis of Crystal Violet loaded spent tea leaves.
It is clear that the two XRD indicate presence of crystalline regions. However in the XRD of crystal violet-adsorbed XRD the diffraction is more pronounced, thus indicating that after adsorption of CV, the crystalline nature of sorbent STL increases.
FTIR Spectral Analysis
The FTIR spectra of dye crystal violet, the adsorbent spent tea leave and dye-loaded spent tea leaves are shown in Figures 6a, 6b and 6c respectively.
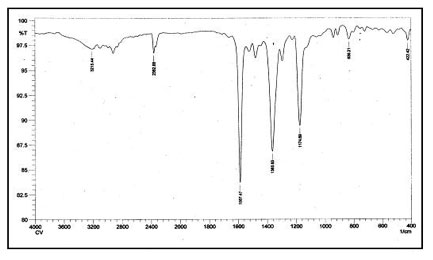
Figure 6a: FTIR spectra of Crystal Violet.
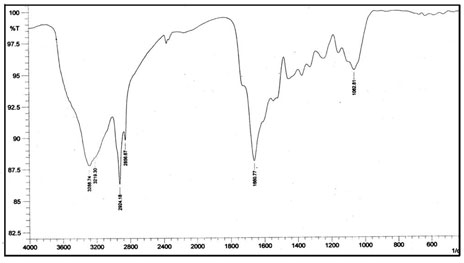
Figure 6b: FTIR spectra of spent tea leaves.
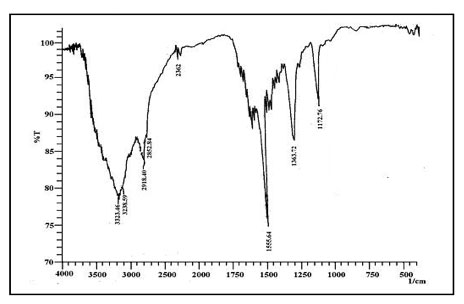
Figure 6b: FTIR spectra of dye loaded STL.
The FTIR of CV displays all characteristic peaks of CV, namely 1587 cm-1 due to C=C stretching in aromatic nuclei, 1365 cm-1 due to C-H deformation in methyl, 1174 cm-1 due to C-H stretching in aromatic ring, and 1128 cm-1 due to C-N vibration. The spectrum of plain STL, displayed in Fig. 6b, indicates the presence of a broad band around 3288 cm-1 due to bonded –OH group. In addition, peaks at 2924 and 2856 cm-1 may be assigned to aliphatic -CH groups. A peak at 1660 cm-1 is due to C=O stretching of amide group (I), at 1734 cm-1 due to C=O stretching of carboxylic groups and at 1518 cm-1 due to the bending of N-H bonds of amide II.
The FTIR of CV-Loaded STL is shown in Fig. 6c. As can be seen, it contains nearly all the major characteristic peaks of both STL and CV mentioned in the above paragraph. It appears that the adsorption process does not involve any band formation between active species of dye and adsorbent molecules. In fact, the dye uptake appears to be physical in nature.
Adsorption Isotherm Models
An adsorption isotherm provides useful information regarding the extent of affinity between the sorbent surface and sorbate molecules and also about the surface properties of adsorbent. In the present study, equilibrium uptake data obtained at 298, 310 and 323 K, was applied on various isotherm models as shown below.
Langmuir Isotherm Model
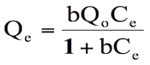
This isotherm model has been successfully applied to many pollutants adsorption processes and is the most frequently used isotherm for batch sorption systems. (Langmuir 1916). The central assumption of the Langmuir model is that adsorption takes place on a homogeneous adsorbent surface of identical sites that are equally available and energetically equivalent, with each site carrying equal number of molecules and no interaction between adsorbate molecules. The original form of well known Langmuir model is given as:
(5) 
The above equation can be used to obtain a linear isotherm plot in different ways. The rearrangement of this equation gives:
(6) 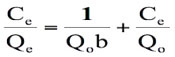
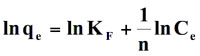
On dividing the above equation by Ce. We get:
(7) 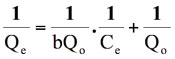
where Ce is the equilibrium concentration in mg L-1, Qe (mg g-1) is the amount of CV in mg adsorbed per g of sorbent, Qo is the complete monolayer adsorption coverage (mg g-1) and b is the langmuir constant related to the affinity of the binding sites and energy of adsorption(L mg-1). A straight line is expected between 1/Ce and 1/Qe if the uptake data support this model.
Freundlich Isotherm Model
This is an empirical equation which assumes that adsorbent surface sites have a spectrum of different binding energies. (Freundlich 1906) The linearized equation is given as:
(8) 
where Kf and n are the Freundlich constants related to the adsorption capacity and adsorption intensity of the sorbent, respectively. A plot of ln qe versus ln Ce is supposed to be linear it data fit well onto this model.
Temkin Isotherm Model
The derivation of the Temkin isotherm assumes that the fall in the heat of adsorption is linear rather than logarithmic, as implied in the Freundlich equation. (Tempkin and Pyozhev 1940) This is given as:
(9) ![]()
where α and β are isotherm constants. A plot between qe and ln Ce is supposed to be linear.
The equilibrium uptake data, obtained at 25, 37 and 50ºC, was applied on these models – namely Langmuir, Freundlich and Temkin isotherm models and the corresponding plots have been shown in Figures 7, 8 and 9 respectively.
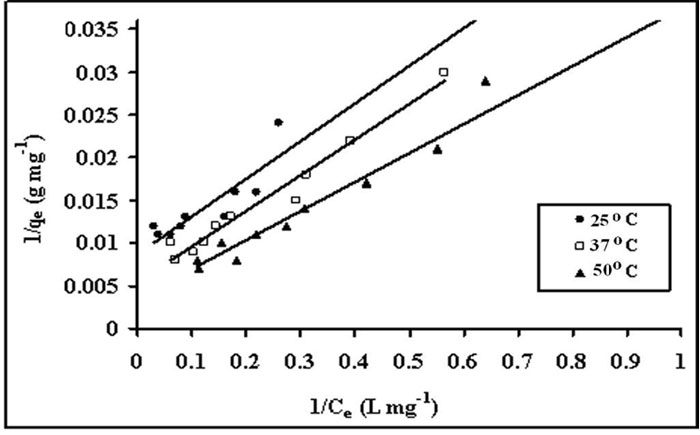
Figure 7: Langmuir isotherms for crystal violet uptake, by STL at 25, 37 and 50ºC.
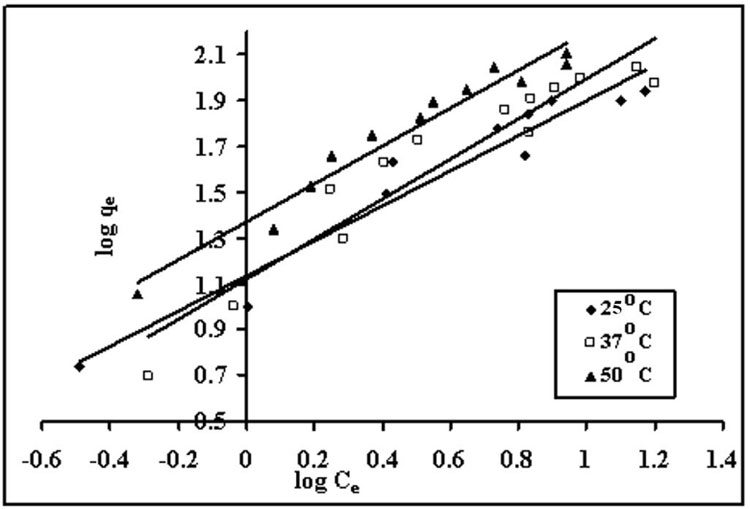
Figure 8: Freundlich isotherms for dye uptake by spent tea leaves at 25, 37 and 50ºC.
Figure 9: Temkin isotherms for sorption of crystal violet onto STL at 25, 37 and 50ºC.
The various related isotherm parameters obtained using slope and intercept of linear plots have been given in the Table 4.
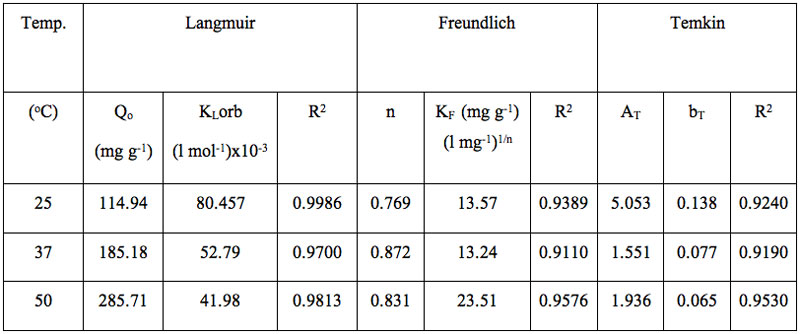
Table 4: Various parameters for different isotherms models.
Based on the values of regression (R2) and other error functions, it was found that the, order of fitness of these isotherms models was Langmuir > Freundlich > Temkin. It can also been seen that maximum sorption capacity (Qo) increases with temperature, which may be attributed to the fact that increase in temperature causes an enhancement in the sorption sites. In addition, diffusion of dye molecules into the pores is also favored at higher temperatures. (Ahmad 2009). Finally the affinity of adsorbate towards the STL was further established using the dimensionless separation factor RL (Weber and Chakraborty 1974) which may be given as:
(10) 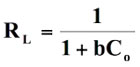
where Co is the initial dye concentration and b is langmuir isotherm constant. The adsorption processes a function of RL may be described as:
RL > 1 unfavorable
RL = 1 Linear
0 < RL < 1 Favorable
RL = 0 Irreversible
In the present study, RL values were obtained using above expression for dye sorption at 25, 37 and 50ºC and plotted against initial concentrations of Co as shown in Figure 10.
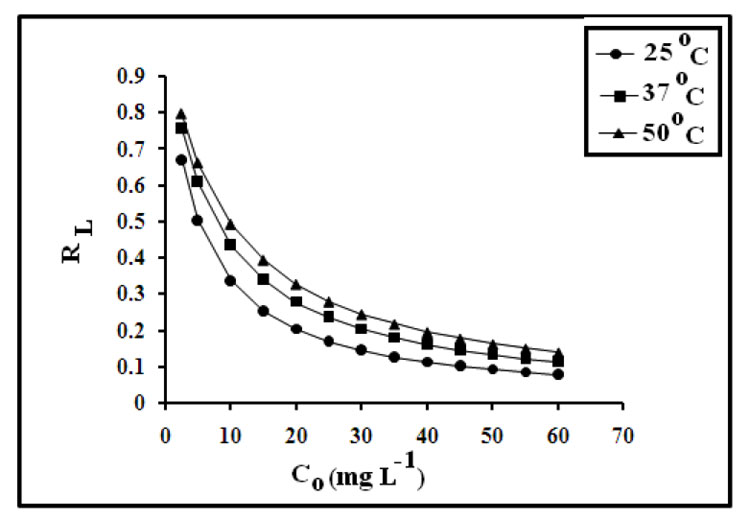
Figure 10: Plot showing variation of dimensionless factor RL with initial concentrations.
It is clear that the values fall within the range of 0.07 to 0.795 for the concentration range of 2.5 to 60 mg L-1, thus indicating favorable dye sorption onto spent tea leaves. Similar results have also been reported by Madhavakrishnan et al. (2009); for uptake of crystal violet onto Ricinus Communis pericarp carbon.
In order to investigate the mode of dye uptake processes, i.e. whether physical or chemical in nature, the equilibrium uptake data at 25ºC was applied to the Dubinin – Radushkevich (D-R) isotherm model (Dubinin 1960) given as:
(11) ![]()
where Cad is the amount of dye adsorbed on STL, Cm is the maximum amount that could be adsorbed under optimized experimental conditions, B is a constant with dimension of energy and Polyanyi potential, ε = RT ln (1+1 / Ce), where R is the gas constant in kJ mol-1 K-1, T is the absolute temperature, and Ce is the equilibrium dye concentration.
The obvious linearized form of D-R isotherm is:
(12) ![]()
where ln Cad values were plotted against e2, a straight line was obtained (see Figure 11).
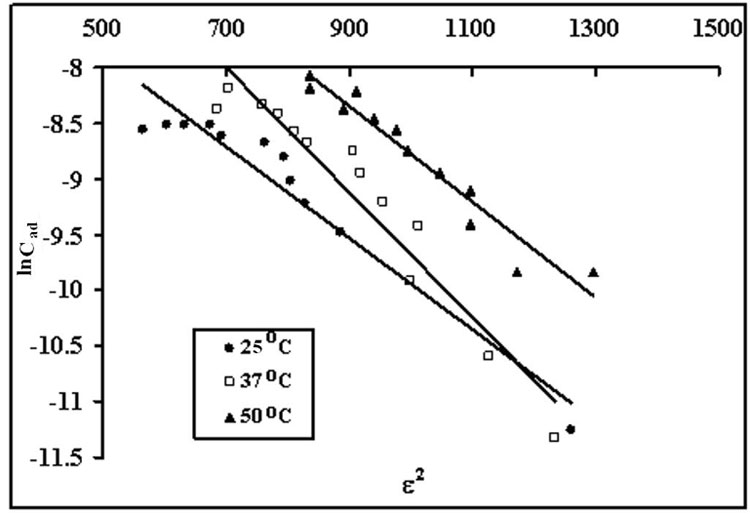
Figure 11: Dubinin-Radushkevich isotherm model for equilibrium dye uptake obtained at different temperatures.
The computed values of B and Cm from the slope and intercept of this straight line were 0.0041 and -5.8424 respectively. From the calculated value of B, the mean sorption energy (E) was computed as:
(13) 
which is the free energy transfer of one mole of solute from infinity to the surface of sorbent. The numerical value of E was 9.45 to 11.11 kJ mol-1, which is in the expected range of 8-16 kJ mol-1 for ion-exchange.
Evaluation of Thermodynamic Parameters
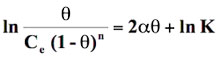
Thermodynamic considerations of an adsorption process give valuable information about nature of the uptake process such as its spontaneity, its randomness, its endothermicity or exothermicity etc. To investigate them, standard free energy change (∆G0), standard enthalpy change (∆H0) standard entropy change (∆S0) was determined. A sorption isotherm equation, which takes into consideration the effect of size ratio (n) and lateral interaction coefficient (α) between adsorbed molecules may be given as: (Yehia et al. 1993)
(14) 
(15) 
(16) 
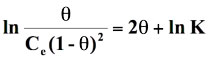
Where K is the is the adsorbability of the adsorbate molecules at infinite low coverage, Ce is the equilibrium concentration in moles/l, θ is the degree of surface coverage, R is the gas constant (8.314 J/mol K), T is temperature (K). The surface coverage θ can be calculated as θ = qe/qe(max) where qe(max) is the maximum adsorption in qe versus Ce profile and qe is the amount adsorbed at equilibrium corresponding to equilibrium concentration Ce. The logarithmic form of equation (14) is:
(17) ![]()
(18) 
Standard free energy change of adsorption, ΔG0ads was calculated using the Langmuir, Florry Hugins (Dhar et al 1973), Frumkin (Grchev et al. 1991) and Modified Frumkin (Frumkin et al. 1964) models for which n and α values pairs are 1,0; 1,1; 2,0 and 2,1 respectively. On substituting these values in equation (18), the following equations were obtained for respective isotherm models as shown below:
(19) 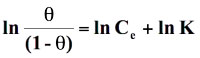
(20) 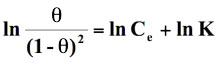
(21) 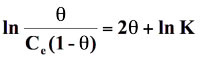
(22) 
The above four isotherm models were applied on the equilibrium sorption data obtained at 25, 37 and 50ºC and their suitability was investigated on the basis of respective regression value. It was found that the Langmuir model exhibited regression values of 0.867, 0.934 and 0.937 at 25, 37 and 50ºC respectively. However, the other models showed a poor regression and hence could not be used for evaluation of thermodynamic parameters. The Langmuir plots are shown in Figure 12 (other plots are not displayed due to very poor regression).
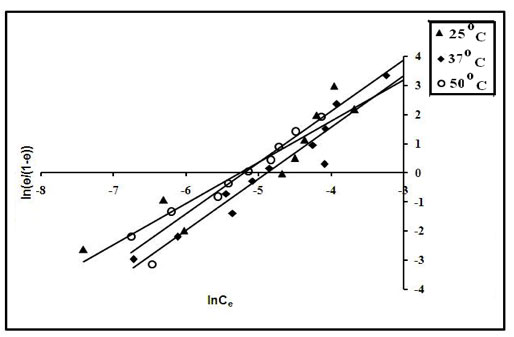
Figure 12: Langmuir model for evaluation of ΔG0ads.
For a given model the intercepts of linear plots obtained from Figure 12 were used to evaluate k. Finally ΔG0ads was evaluated using ln K versus 1/T plots following the equation (16). The values of ΔG0ads obtained were further used for the evaluation of ΔH0ads and ΔS0ads using the following relationship:
(23) ![]()
The plot of ΔG0ads versus T was found to be linear. The values of ΔH0ads and ΔS0ads were calculated from the intercept and slope of the linear plot (see Figure 13).
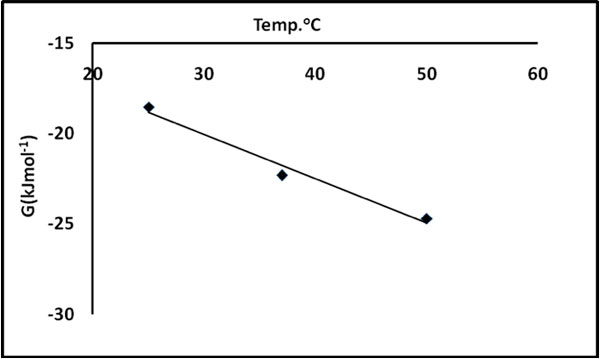
Figure 12: ΔG versus T plot for evaluation of ΔH0 and ΔS0.
The thermodynamic parameters, using the Langmuir plot are given in Table 5.
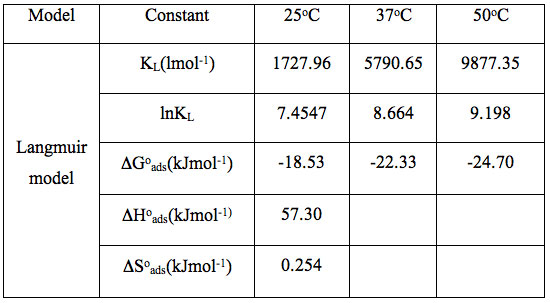
Table 5: Evaluation of thermodynamic parameters by the Langmuir model.
It is clear that negative ΔG0ads values are an indication of the spontaneous nature of the process. The positive ΔH0ads value indicates that the dye uptake process is endothermic in nature. The positive value of ΔS0ads suggests the increased randomness at the solid – solution interface during the adsorption process. Spontaneous and endothermic adsorption has also been reported for the adsorption of basic dyes on the mansonia wood sawdust (Ofomaja and Ho 2008).
Conclusions
It is concluded from the above study that the equilibrium uptake of dye crystal violet is best interpreted by the Langmuir and Freundlich isotherm models. The process, as indicated by mean sorption energy E, is mainly governed by an ion-exchange mechanism. The process is spontaneous, endothermic and is accompanied by an increase in randomness.
Acknowledgements
The authors are thankful to Dr. O. P. Sharma, Head of the Department of Chemistry, for his kind support.
References
Ahmad R (2009) Studies on adsorption of crystal violet dye from aqueous solution onto coniferous pinus bark powder (CPBP). J Hazard Mater. 171 (1-3) : 767.
Ahmad A A, Hameed B H, Aziz N (2007) Adsorption of reactive dye on palm oil industry waste: equilibrium, kinetic and thermodynamic studies. Desalin. 247 : 551.
Almeida C A P, Debacher N A, Downs A J, Cottet L, Mello C A D (2009) Removal of methylene blue from colored effluents by adsorption on montmorillonite clay. J. Coll. Interf. Sci. 332 (1) : 46-53.
Bajpai S K, Jain A (2010) Sorptive Removal of Crystal Violet from Aqueous Solution Using Spent Tea Leaves: Part I Optimization of Sorption Conditions and Kinetic Studies. Act. Chim. Slov. 57 : 751.
Bajpai S K, Jain A (2010) Removal of copper(II) from aqueous solution using spent tea leaves (STL) as a potential sorbent. Water S.A. 36 (3) : 221-228.
Batzias F A, Sidiras D K (2007) Simulation of methylene blue adsorption by salts-treated beech sawdust in batch and fixed-bed systems. J. Hazard. Mater. 149 (1) :8-17.
Bestani B, Benderdouche N, Benstaali B, Belhakem M, Addou A (2008) Methylene blue and iodine adsorption onto an activated desert plant. Biores. Technol. 99 (17) : 8441-8444.
Dhar H P, Conway B E, Joshi K M, (1973) Form of adsorption isotherms for substitutional adsorption of molecules of different sizes. Electrochimia Acta. 18 (11) : 789.
Dubinin M M (1960) The potential theory of adsorption of gases and vapors for adsorbents with energetically non-uniform surface. Chem. Rev. 60 : 235- 266.
Duran A, Monteagudo J M, Amores E (2008) Solar photo fenton degradation of reactive blue 4 in a CPC reactor. Appl. Catal. B: Environ. 80 : 42-50.
Fan L, Zhou Y, Yang W, Chen G, Yang F,(2008) Electrochemical degradation of aqueous solution of Amaranth azo dye on ACF under potentiostatic model. Dyes and Pigments. 76 (2) : 440-446.
Freundlich H M F (1906) Over the adsorption in solution. Phys. Chem. 57 : 385-470.
Frumkin A N, Damaskin B B, Bockris J O M, B E Conway editors, (1964) Modern aspects of electrochemistry, London. Butterworths. 3 : 149.
Gimbert F, Morin-Crini N, Renault F, Badot P M, Crini G (2008) Adsorption isotherm models for dye removal by cationized starch-based material in a single component system : error analysis. J. Hazard Mater. 157 (1) : 34-46.
Gong R, Zhong K, Hu Y, Chen J, Zhu G (2008) Thermochemical esterifying citric acid onto lignocellulose for enhancing methylene blue sorption capacity of rice straw. J. Environ. Manag. 88 (4) : 875-880.
Grchev T, Stafilov M, Schultze J W, (1991) Adsorption of polyacrylamide on gold and iron from acidic aqueous solutions. Electrochimica Acta. 36 : 1315
Hamdaoui O, Chiha M (2007) Removal of methylene blue from aqueous solutions rom wheat bran. Act. Chim. Slov. 54 : 407-418.
Hameed B H (2009) Spent tea leaves: A new non-conventional and low-cost adsorbent for removal of basic dye from aqueous solutions, J. Hazard. Mater. 161 (2-3) : 753-759.
Hameed B S, El-khaiary M I (2008) Removal of Methylene blue from aqueous solution using biosorbent. J. Hazard. Mater. 155 : 601-609.
Jain R, Shrivastava M (2008) Adsorptive studies of hazardous dye Tropaeoline 000 from an aqueous phase on to coconut-husk. J. Hazard. Mater. 158 (2-3) : 549-556
Karaca S, Giirspes A, Ackyldiz M , Ejder M (2008) Adsorption of cationic dye from aqueous solutions by activated carbon. Macrop. and Mesop. Mater. 115 : 376-382.
Karim A B, Mounir B, Hachkar M , Bakasse M, Yaacoubi A (2009) Removal of Basic Red 46 dye from aqueous solution by adsorption onto Moroccan clay. J. Hazard. Mater. 168 (1) : 304-309.
Langmuir I (1916) The constitution and fundamental properties of solids and liquids. J. Am. Chem. Soc. 38 : 2221-2295.
Madhavkrishnan S, Manickauasagam K, Vasantha R K, Rasappan K, Mohanraj R, Pattabhi S (2009) Adsorption of Crystal Violet Dye from an Aqueous Solution Using Ricinus Communis Pericarp Carbon as an Adsorbent. E-J. Chem. 6 (4) : 1109-1116.
Ofomaja A E, Ho Y S (2008) Effect of temperature and pH on methyl violet biosorption by Mansonia wood sawdust. Biores. Technol. 99 (13) : 5411-5417.
Sudarjanto G, Keller-Lehmann B, Keller J (2006) Optimization of integrated chemical-biological degradation of a reactive azo dye using response surface methodology. J. Hazard. Mater. 138 : 440-446.
Sun J, Qiao L, Sun S, Wang G (2008) Photo catalytic degradation of orange G on nitrogen doped TiO2 catalysts under visible light and sunlight irradiation. J. Hazard. Mater. 155 : 312-319.
Tahir S S, Rauf N ( 2006) Removal of a cationic dye from aqueous solutions by adsorption onto bentonite clay. Chemos. 63 : 1842-1848.
Tan W F, Lu S J, Liu F, Feng X H J, He Z, Koopal L K (2008) Determination of the point of zero charge of manganese oxides with different methods including an improved salt. Soil Science. 173 (4) : 277.
Tempkin M J, Pyozhev V(1940) Acta Physicochim. USSR. 12 : 327-352.
Weber T W, Chakraborty R K (1974) Pore and Solid diffusion models for fixed bed adsorbers. Am. Inst. Chem. Eng. J. 20 : 228.
Wei J, Zhu R, Zhu J, Yuan P, He H, Ming C (2009) Simultaneous sorption of crystal violet and 2 naphthol to bentonite with different CECs. J. Hazard. Mater. 166 (1) : 195-199.
Yehia A, Miller J D, Ateya B G (1993) Analysis of the adsorption behavior of oleate on some synthetic apatites. Minerals Eng. 6 : 79.
Discussion with Reviewers
Anonymous Reviewer: What is the unique advantage of spent tea leaves?
S. K. Bajpai and A. Jain: It is well known that tea leaves are one of the most commonly consumed drinks all over the world and therefore a huge amount of waste or spent tea is left over, whose disposal is a problem. This waste material is of no use and can be easily collected at almost no cost. Hence use of this as a potential adsorbent really makes the adsorption process over all very economic.
Reviewer: What is the potential of this approach for industrial applications?
Bajpai and Jain: In our batch mode studies, we found that this sorbent was quite efficient in removing crystal violet dye from synthetic water. We feel that if adsorbent columns containing tea leaves are fabricated then it may be possible to remove toxic dyes from effluent coming out of textile, paper and dyeing industries. Therefore the industrial feasibility of using spent tea leaves via the column mode experiment to remove dye stuffs is fairly high.
Reviewer: Can tea leaves be reused in the process? Does the efficiency decrease?
Bajpai and Jain: During the investigation we found that this sorbent could not be used again, so the reusability of spent tea leaves is almost nil. Since tea leaves are a very cheap and easily available adsorbent, undoubtly it makes the adsorption process cost effective.