
![]()
Biophysical Analysis of Water Exposed to the Meditative Energy Field: Plausible Correlation to Neurophysiological Observations?
Dipita Bhattacharyya,1 Bhisma N Ratha,2 Ipsita Chakraborty,1 Gourav Shome,3 Ranit Pariary,1 Chumki Nayak,4
Achintya Singha,4 Ashish Kalawar,5 Nakul C Maiti,6 Atin K Mandal,3 Ambareesh Modak,5* Anirban Bhunia1,*
1Department of Biophysics, Bose Institute, Sector V, EN 80, Salt Lake, Kolkata 700091, India
2School of Agricultural and Bio Engineering, Centurion University of Technology and Management, Odhisa 751009, India
3Division of Molecular Medicine, Bose Institute, Sector V, EN 80, Salt Lake, Kolkata 700091, India
4Department of Physics, Bose Institute, 93/1, Acharya Prafulla Chandra Road, Kolkata 700009, India
5Shree Shivkrupanand Swami Foundation, Gurutattva Bhavan, Shivaji Park 4/8,
Amrapali Main Road, Rajkot 360005, India
6CSIR-Indian Institute of Chemical Biology, 4 Raja S. C. Mullick Road, Kolkata 700032, India
Correspondence: anirbanbhunia@gmail.com or bhunia@jcbose.ac.in (AB) and ambareesh@gurutattva.org (AM)
Keywords: NMR; Raman Spectroscopy; Hydrogen bond; Water; Amyloid; Meditation
Submitted: September 8, 2022
Reviewed: December 13, 2022
Accepted: December 26, 2022
Published: February 11, 2023
Abstract
Water presents interesting physical properties that can trap energy in its unique molecular architecture. With a major fraction of our cells being made of water, any alterations in its attributes can influence biological responses within the cell, modulating biomolecular interactions. The current study aims to bring into light a prospective area of studying water as a definite molecular probe to the energy fields largely spoken about in meditative practices and the immense physiological benefits known to occur. Over the last few years, scientific data on the neurophysiological impact of meditation have been accumulated from Magnetic Resonance Imaging (MRI), based largely on the proton density and water dynamics in tissues. Alternatively, the ability of water molecules to absorb weak electromagnetic waves can partly explain the observed modulations in brain frequencies in electrophysiological studies. Since probing physiological water requires invasive and far more complex technical expertise or machinery, we characterized bottled waters in close proximity to a long-term practitioner using Raman spectroscopy and solution-state nuclear magnetic resonance (NMR). The modulations in the samples were reflected in their effect on protein dynamics, implicated in metabolic disorders. The in vitro biophysical data presented in this paper open up a vast area of research focusing on water as a molecular link to the energy frequencies originating from long-term meditative practices and the associated moderation of biomolecular interactions. This would provide essential empirical evidence on any direct role of meditation and its manifold physiological effects.
Introduction
Water serves as a major component in all living things on earth (Pratt et al., 2007; Jéquier and Constant, 2010; Kavouras and Anastasiou, 2010). Water present in cells, at the interface of proteins and nucleic acids, has been characterized as functionally distinct, with significant differences in the biophysical attributes compared to bulk water in the liquid state (Cooke and Kuntz,1974; Cameron and Fullerton, 2014; Ball, 2017; Geesink et al., 2020). Experimental characterization of such integrated water molecules have indicated alterations with respect to the dynamics and overall molecular architecture (Jungwirth, 2015). The reorientation of the molecules can influence the biomolecular functions of the associated proteins and nucleic acids. Nevertheless, the physical properties and the chemical organizational structure (Zhao et al., 2015; Brini et al., 2017) of the different water clusters can serve as the basis of much of our physiology as we understand it today. In fact, the characterization of water diffusion is the foundation step for modern imaging-based diagnostic tools, including magnetic resonance imaging (MRI), for investigating brain tissue architecture and integrity (Le Bihan and Iima, 2015; Natali et al., 2019). The differences in the dynamics of the water molecules at the biomolecular interface can translate into the diffusion-driven displacement of water molecules when subjected to the spatiotemporal variations in the magnetic field generated by gradient pulses used in diffusion MRI (Le Bihan, 2007; Le Bihan and Johansen-Berg, 2012). The resultant data based on the non-Gaussian diffusion observed for the alterations in the biologically integrated water molecules have been used for the last few decades to provide essential insight into the pathophysiology (Yablonskiy and Sukstanskii, 2010; Le Bihan et al., 1986).
Based primarily on the assessment of the water dynamics in biological tissues, MRI has evolved as an excellent means to study the neurophysiological benefits of several lifestyle practices, treatments, or efficient diagnoses. Non-invasive functional MRI (fMRI) (Baron Short et al., 2010; Boccia et al., 2015; Miyoshi et al., 2019), along with electroencephalogram (EEG) data (Ferrarelli et al., 2013; Ahani et al., 2014; Bowman et al., 2017; Braboszcz et al., 2017; Cheong et al., 2018; Das et al., 2022) have provided a unique understanding of the neural mechanisms of meditation and its effect on decreased mind-wandering (Hasenkamp et al., 2012; Brandmeyer and Delorme, 2021).
Despite the experimental evidence in the modulation of brain function with meditation, the underlying mechanism and molecular basis of the observed changes have remained obscure. MRI research over the last few years serves as the essential scientific basis for explaining the immense therapeutic benefits of meditation. Reaching a state of mindfulness (Fox et al., 2012; Tan et al., 2014) has been proven to modulate the functioning of our brain, affecting neuronal connectivity and networking (Tang et al., 2015; Yordanova et al., 2021). Recently it has been shown to affect default-mode networking (DMN) (Jerath and Crawford, 2015; Kucyi et al., 2016; Nair et al., 2018), including the medial prefrontal cortex, posterior cingulate cortex, and the inferior parietal lobule of the brain (Brewer et al., 2011).
Interestingly, these observations are further accompanied by overall modulation of the brain emission frequencies. The collected data indicate an overall shift to more alpha (8–14 Hz) and theta frequencies (4–8 Hz) (Cahn et al., 2010; Pritchett et al., 2015; Lee et al., 2018; Rodriguez-Larios et al., 2020). While theta waves correspond to a deep and relaxed attention state, alpha waves define the wakeful state of being at rest. In fact, the wakeful resting state is also closely linked to the key neuronal organization of the DMN (Bowman et al., 2017), and the alpha frequency shares interdependence with the DMN (Clancy et al., 2022). Furthermore, these effects are much more pronounced in experienced meditation practitioners, with short- and long-term neuronal changes (Lutz et al., 2004; Rodriguez-Larios et al., 2020; Yordanova et al., 2021). However, even short-term practitioners (five days) have shown significant differences in their ability to focus more and combat stress than the control groups (Tang et al., 2007; Yang et al., 2019; Isbel et al., 2020).
These parallel alterations in neuronal networking and the electrophysiological oscillations can serve as crucial indicators for understanding the role played by water as an intermediate molecular link between the practice of meditation and the observed effects. Interestingly, studies have shown that electromagnetic fields interact with water, perturbing the intermolecular hydrogen bonding that has been proven to modulate the steps of water crystallization (Zhao et al., 2015; Brini et al., 2017; Yinnon, 2018). Based on the available literature, exposure to definite electromagnetic frequencies can directly influence the ordering of the molecular structure of water clusters (Zhao et al., 2015). This, in turn, can alternate the ice nucleation and the ordering of the molecules to form distinct crystal lattices. This is intriguing and particularly relevant in the context of biological systems, as discussed previously. Water has always been anomalous to several laws of physics and has fascinated scientists from all fields and domains alike. Chemically, the water molecule structure is interesting, and the molecular organization has been studied and correlated with much of its physical attributes.
In the current study, our major aim was to determine if water could serve as a probable intermediate probe to any potential changes in the energy spectrum emanating from long-term meditation practice. In the absence of a definite molecular intermediate or a recognizing receptor such as already known to recognize molecular vibrations (Franco et al., 2011), our scientific reasoning has been stymied.
Several emerging studies have now provided evidence for the electromagnetic nature of the neuronal oscillations emitted by the brain that can be perceived (Bryukhovetskiy et al., 2020; Idris, 2020). Even though the neuronal oscillations are very weak, it is plausible that the electromagnetic frequency emitted by the meditating brain could affect the molecular organization of water. Since probing physiological water requires invasive and complex technical expertise or machinery, to put this concept to testing, we designed this preliminary step in which we used sealed bottles of water in close proximity to the energy realm of a long-term meditation practitioner with an advanced stage of consciousness as he discoursed to the masses in Himalayan Meditation camps. The physical properties of the water and the hydrogen networking were characterized and compared with definite control sets using a combination of low and high-resolution spectroscopic techniques. We see interesting changes in the overall molecular clustering in the water samples exposed to the meditative energy frequencies, affecting its physiological role.
Materials and Methods
Materials: Water Samples
Bottled drinking water from three leading commercial brands (hereafter referred as B1, B2, and B3) was used during the course of the study (Table 1). The same batches were used for all the performed experiments to maintain uniformity of sample properties. Samples have been collected from two meditation camps practicing “Samarpan” (“letting go”) meditation, specifically, Himalayan Meditation being done under the supervision of a long-term meditation practitioner, Shree Shivkrupanand Swami. The first camp was held in 2020, conducted over a period of eight days. All the samples in this earlier camp were from brand B1. Separate new sealed bottles were used each day during the eight-day-long meditation camp. The sealed bottle kept in proximity to the long-term meditation practitioner before being collected on Day 1 was labelled as B1D1. A different sealed bottle labelled as B1D2 was kept close to the meditator on Day 2 and collected, and so on, for each of the eight days (B1D8 for the sample collected on Day 8). The second was a single-day workshop, held in 2021 (Table 1). In either scenario, sealed drinking water bottles were kept in close proximity (1-5 feet) to the long-term practitioner during the course of the meditation workshop; these were labeled as the test samples (B1test, B2test, B3test) as opposed to the controls from corresponding brands that were not used during the camps (B1control, B2control, B3control). Given that the same brand and the control and test samples were manufactured at close-by dates (Table 1), it is expected to be of the same manufacturing quality as guaranteed by the brand names. All samples were stored in similar conditions at room temperature, away from any direct light source.
Alternatively, as control, we exposed B1control to varying ultrasonic vibrational frequencies using a Cole Parmer Ultrasonic Processor (Illinois USA) probe sonicator with an operational frequency of 20 kHz. The amplitude was varied from 35% (40% being the maximum limit for the machine) to 15% applied at three different timeframes as represented in Table 2.
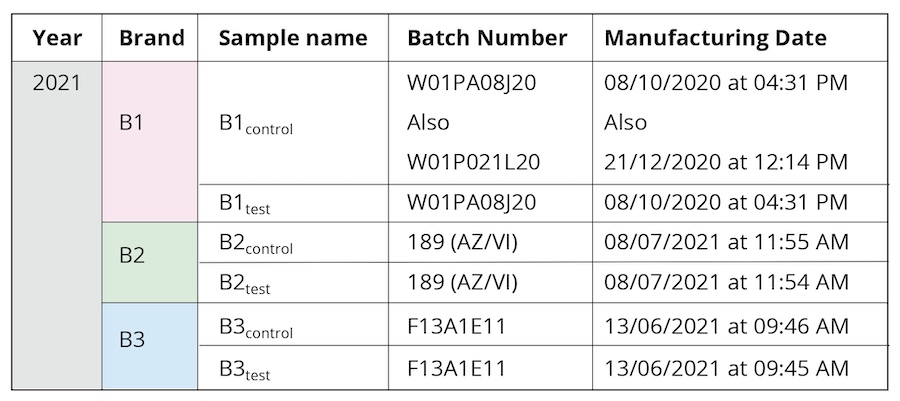
Table 1. The different samples used for the characterization
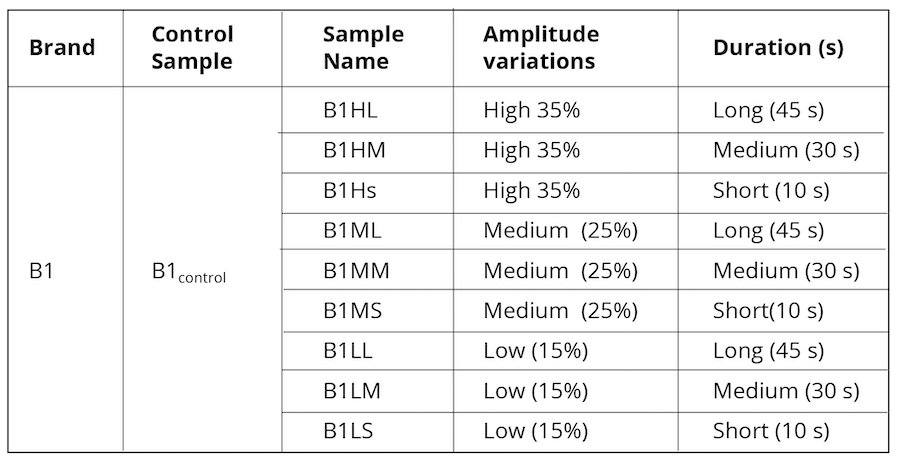
Table 2. Ultrasonically vibrated water samples were used as control.
Peptide and Protein Samples
Lyophilized synthetic peptide hIAPP was purchased from Genscript Inc. USA. One mg peptide was weighed and dissolved in 1000 μL 1,1,1,3,3,3-hexafluoro-2-propanol (HFIP; Sigma-Aldrich, USA) and separated into 10 aliquots with 0.1 mg peptide in each. The aliquots were lyophilized and stored at -80ºC before further use. Immediately before experimentation, the sample was prepared in a solution containing 20 mM phosphate buffer (pH 7.3) and 50 mM NaCl. The pH of the solution was adjusted using HCl.
Aβ40 was procured from Genscript Inc. USA (>95% pure). The sample was dissolved in an ammonium solution and divided equally to obtain 0.1 mg aliquots and lyophilized and stored at -80°C for future use. For experiments, these were solubilized using 20 mM phosphate buffer (pH 7.4) containing 50 mM NaCl to obtain a final concentration of 0.3 mg/ml and sonicated for a few seconds.
The α-synuclein protein was expressed in transformed E.coli BL21(DE3) cells grown in minimal media with or without 15N-labelled ammonium chloride. Briefly, the protein was purified using the ammonium sulfate precipitation after heat treatment. The precipitated sample was lyophilized and stored. For experiments, the lyophilized powder was dissolved in 20 mM phosphate buffer (pH 6.8), and dialyzed in the same buffer overnight before filtering through a 100 kDa MWCO filtering unit (Centricon YM-100, Millipore).
Methods
Raman’s Spectroscopy
The Raman measurements were carried out using a micro-Raman spectrometer (LabRAM HR, Jobin Yvon, USA) equipped with a Peltier cooled CCD detector and three different excitation sources viz. 488, 633 and 785 nm. The data recorded with an integration time of 10 s were processed and analyzed with Origin software. The spectra were treated with a multipoint baseline correction. For the hydrogen bond pattern, the 2600-4000 cm-1 region was considered (Sun, 2013; Sun and Guo, 2016). We adopted peak picking for 5 peaks around 3043, 3211, 3408, 3537, and 3632 cm-1 that were selected for band fitting (Sun and Zheng, 2009) corresponding to DAA-OH, DDAA-OH, DA-OH, DDA-OH and free OH, respectively. Gaussian shaped curve function was chosen for the fitting and a range of 15-40 cm-1 for bandwidth and ± 5 cm-1 window was allowed for center. The best fitted results were then compared. The area under the linked component curve represented the extent of hydrogen bonds in the water sample and the area under each curve represented the fraction of the corresponding bond type (Supplementary Fig. 1).
Nuclear Magnetic Resonance (NMR) Spectroscopy
NMR with Water Samples
For the experiment, 600 µL of each water sample was taken in 5 mm NMR tubes, and the proton resonances were recorded with 128 scans and a recycle delay of 1.5 s. All NMR experiments were carried out on a 500 MHz Bruker Avance-III spectrometer equipped with an RT probe and processed using TopSpinTM 4.0.6.
To extract the transverse relaxation (T2), a concatenated version of the CPMG pulse sequence was used with 8π pulse blocks, where the block-time (T) for all the experiments was set at 10 ms. The recycle delay was set at 35 s. A single scan was used for each relaxation experiment, given the high signal-to-noise ratio for water. The experiments were performed individually by varying the temperature between 15°C, 25°C, 37°C, and 45°C. The peaks were fitted with mixed Lorentzian and Gaussian functions, where the fitting correlation parameter in each case was nearly 0.999. As the signals were decaying mono-exponentially with time according to equation 1, the echo intensities were plotted against time in the Logarithmic scale, and data were fitted with a simple straight-line fitting function to obtain the corresponding T2 values. The form of the fitting function was:
Mxy=M0e (–t/T2 ) equation (1)
where the Mxy is the transverse component of the total magnetization (M0) of the sample and T2 is the characteristic transverse relaxation time. Therefore, from the fitting parameter, we extracted the T2 s. The observed T2 s of water samples were normalized and then plotted against temperature for control and test samples.
As it is evident, that T2 shows a linear relationship with temperature (Sierra-Martín et al., 2005), the plots were fitted with a linear equation, [Y = mX + C], where m is the slope of the straight line and C is the intercept.
NMR with α-synuclein
The 1H-15N heteromolecular NMR experiments were performed with uniform 15N-labelled low molecular weight (LMW) protein on a 700 MHz Bruker Avance III NMR spectrometer, equipped with an RT probe at 10°C to minimize the aggregation dynamics within the experimental time frame. The data files were processed using the nmrPipe and nmrDraw data processing and analysis suites (http://spin.niddk.nih.gov/NMRPipe/). The SPARKY software was used for further analysis of the spectra and intensity calculations (https://www.cgl.ucsf.edu/home/sparky). All the chemical shifts were indirectly referenced to Trimethylsilylpropanoic acid.
Thioflavin T Fluorescence Assay
The fluorescence measurements were obtained in a BMG LABTECH POLARstar Omega spectrometer (Ortenberg, Germany) in a 96-well black plate with 200 µL samples. In this step, 25 µM of α-synuclein and 10 µM of Aβ40 and hIAPP samples were prepared by dilution with the water samples, both test and control sets (Table 1). The 1 mM ThT dissolved in 20 mM phosphate buffer (pH 6.8, 0.01% Sodium azide) was added at equimolar concentrations with the test protein or peptide samples in each of the 200 µL volume samples. The samples were subjected to shaking continuously for 6 min with 1 min intervals for recording. The fluorescence reading was obtained with an excitation and emission wavelength of 450 and 485 nm, respectively. Intensities at different time intervals were obtained for each peptide and protein sample and plotted to fit in a sigmoidal curve. The experiments were repeated in triplicate for three independent experiments.
Toxicity Assay
Human neuroblastoma cells, SHSY5Y, were obtained from the National Centre for Cell Science (NCCS, India) and maintained in complete DMEM/F12 (1:1) media (Gibco) supplemented with 12% FBS, 1 unit/ml penicillin-streptomycin, 50 μg/mL gentamycin, and 2.5 μg/mL amphotericin B at 37°C in a humidified 5% CO2 incubator. All the experiments were carried out at 60-70% confluency.
Cell viability was measured by analyzing reduction of 3-(4,5-dimethylthiazol-2-yl)-2,5-diphenyltetrazolium bromide (MTT) into purple formazan by cellular mitochondrial enzyme. Briefly, 1×10⁴ cells/well were seeded in a 96-well plate for 24 h. Cells were treated with α-synuclein fibril (obtained after 10 days) at a final concentration of 10 µM, prepared in (i) 20 mM Phosphate buffer, pH 6.8 (marked as wild type – WT) (ii) B1control, (iii) B1test, (iv) B1LM and (v) B1HM. Data with fibrillar samples obtained upon treatment with the control and treated water for B2 and B3 were also obtained (not shown). The SHSY5Y cells were also treated with different water samples without α-synuclein fibril. After 24 h of treatment, MTT was added to the wells at a final concentration of 0.5 mg/ml and incubated at 37°C and 5% CO2 humidified incubator for another 3.5 h. Then, 100 μL of dimethyl-sulfoxide (DMSO) was added to each well to dissolve the formazan precipitate. The absorbance was taken at 570 nm using a microplate reader and expressed as a percentage of the control.
Results and Discussion
Probing the Physicochemical Properties of Vibrated Water
Water is a polar covalent molecule with a single oxygen bound to two hydrogen atoms resulting in a slight positive (δ+) and negative charge (δ-) on opposite ends (Fig. 1a) (Tsiper, 2005). This polarity forms intermolecular hydrogen bonds (Fig. 1b) associated with other molecules in close proximity. In the liquid state, a single molecule of water experiences dipole-dipole interactions with other molecules in its proximity (Fig. 1b) (Kemp and Gordon, 2008). This, in turn, implies the prevalence of intermolecular vibrations in liquid water (Curnutte and Bandekar, 1972). Furthermore, the rotational transitions in the liquid phase are influenced by the dipole movements changing in the direction of the movement of the oxygen atoms (Fig. 1c); these intra- and intermolecular vibrations are amplified owing to the hydrogen atoms that are lighter of the two.
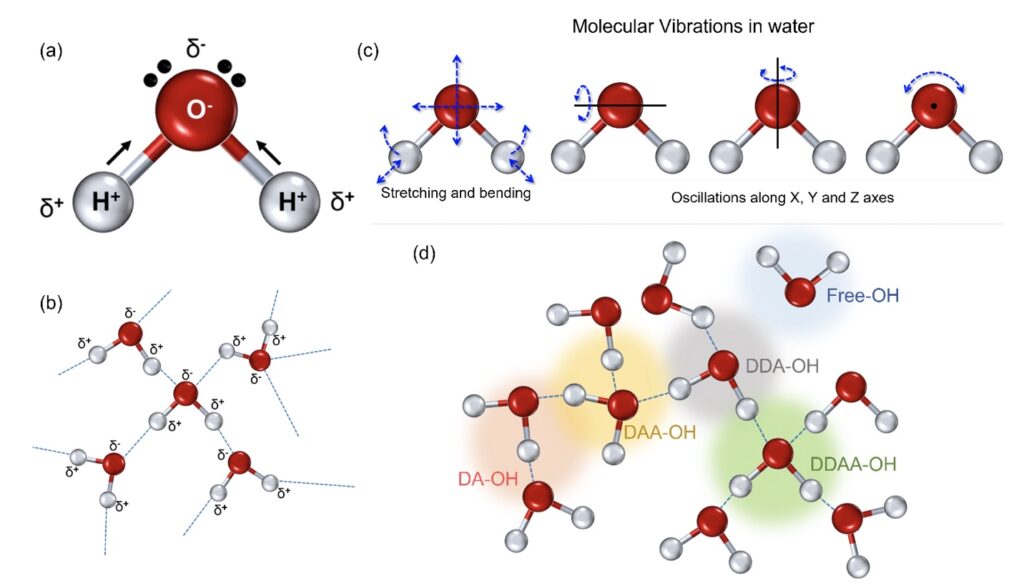
Figure 1. The physicochemical properties of the water molecule. (a) A single water molecule presents with two hydrogen atoms associated with a more electronegative oxygen atom, resulting in a covalent association resulting in polarity. (b) This polarity results in intermolecular dipolar interactions in the form of hydrogen bonds in a cluster of water molecules. (c) The intermolecular hydrogen bonding adds to the molecular rotations in stretching and bending apart from the oscillations, directly linked to the oxygen molecule. (d) In the liquid state, the single water molecule can interact with the nearby atoms and can form separate fractions, depending on the number of donated or accepted hydrogen molecules; the four possibilities include DA-OH, DDAA-OH, DAA-OH, and DDA-OH. A small fraction can represent singly associated or very weakly associated molecules, marked as free OH for ease of perception.
Hydrogen bonds in the liquid state can restrict molecular rotations allowing only oscillatory movements. The corresponding scattering spectrum from Raman spectroscopy can provide essential insight into the nature of hydrogen bonding and the vibrational bands in liquid water (De Ninno et al., 2013; Hu et al., 2017). It provides detailed information about chemical structure and molecular interactions based upon the interaction of light with the chemical bonds within the water sample (Kitadai et al., 2014; Hu et al., 2017). The scattering corresponding to a specific wavenumber can, thus, be used to characterize any modulations of the molecular organization under the influence of any higher or lower frequency components (Bouteiller and Perchard, 2004). Variations in the environment around each water molecule in the liquid state give rise to considerable line broadening with vibrational frequency shifts. The strength of the hydrogen bonding depends on the cooperative/anti-cooperative nature of the surrounding hydrogen bonds with the strongest hydrogen bonds giving the lower vibrational frequencies.
The Raman-OH stretching vibration between the spectral range of 3034–3800 cm−1 corresponds to the four hydrogen-bonded environments that may exist around one water molecule in the clusters (Choe et al., 2016). These are the tetrahedral hydrogen bonding (DDAA), the double donor–single acceptor hydrogen bonding (DDA), the single donor–double acceptor hydrogen bonding (DAA), and free OH (Fig. 1d) (Sun, 2013; Sun and Guo, 2016). However, the immense possibilities for each individual molecule to deviate in the liquid environment results in intrinsic disorder in the individual atoms.
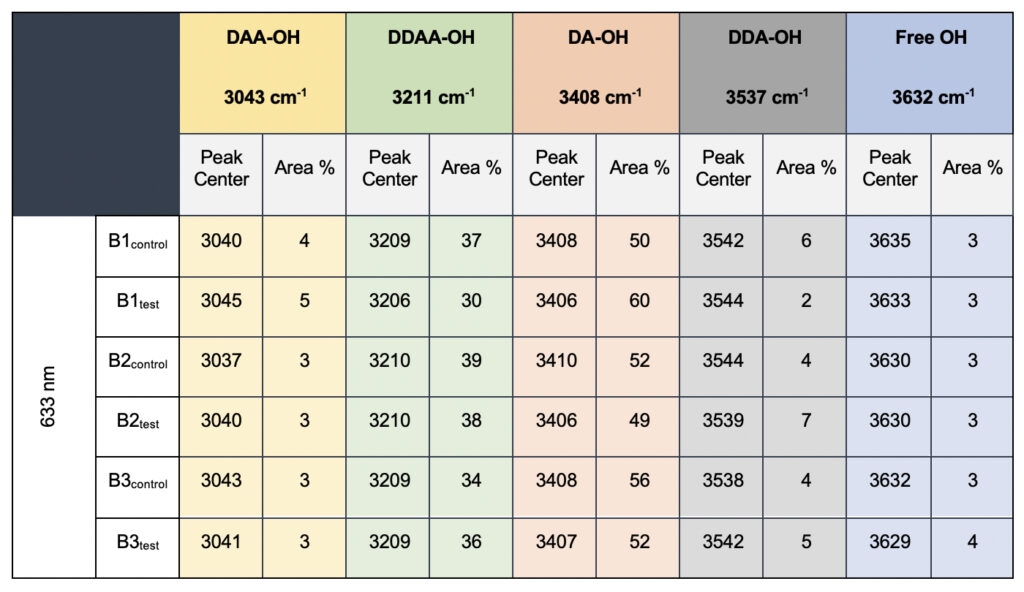
In the present study, Gaussian functions centered at 3043, 3211, 3408, 3537, and 3632 cm−1 were assigned for the subsequent curve fitting operation for the spectral range of water into individual peaks in accordance with previous literature (Table 3 and Supplementary Fig. 1) (Sun and Zheng, 2009; Sun and Guo, 2016). The peak centered at around 3632 cm−1 represents the superposition of DDA-OH and free-OH peaks (Table 3 and Supplementary Table 1). Since DDA hydrogen bonds have small binding energy and longer bond lengths than other hydrogen bonds (DAA, DDAA, and DA) and free-OH has no hydrogen bonds, this peak around 3600 cm−1 represents vibration of the weakly hydrogen-bound water (Mizuse et al., 2007). Figure 2a shows the percent fraction of the DDAA, DA, DAA, and free-OH with respect to the total water content. The two significant vibrations are assigned to the double donor-acceptor (DDAA) or single donor-acceptor (DA) molecules with more than 90% of the total fraction. The free-OH and DAA-bound water peaks, on the other hand, are less than 10%. When the control water (B1control, B2control, and B3control) is compared to the water that received the meditative energies (B1test, B2test, and B3test), we see subtle changes in the individual peaks. Nevertheless, the data confirm that the treated water undergoes modulation with respect to the intermolecular hydrogen bonds, and hence the free –OH (H2O) has abounded.
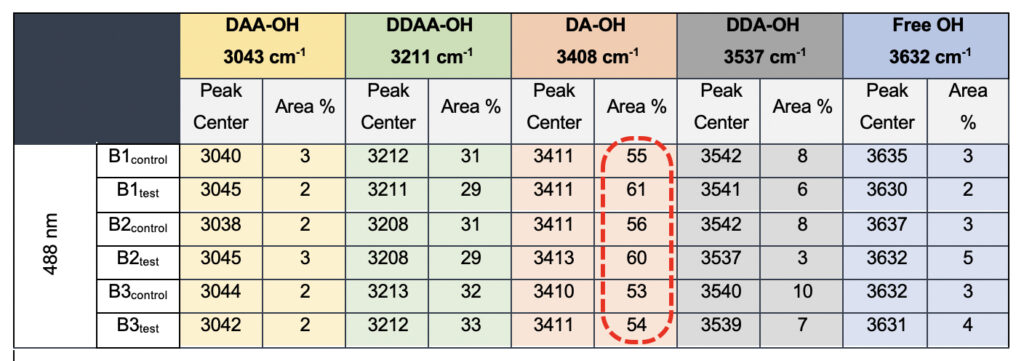
Table 3. Raman Spectral analyses with the three drinking water brands (B1, B2, and B3) were tested in the present study. The data shows a definite increase in the area percentage corresponding to the DA fraction.
While we see an overall increase in the DA fraction in all the treated sample sets, no apparent changes were observed for the fraction of the DDAA-OH peak or the most tightly bound DAA-OH peaks. This results in a higher DA/DDAA ratio calculated for the test samples, as represented in Figure 2b. This indicates more ordering of the molecules in the weak hydrogen-bonded environment. Further, interestingly, the B1test, B2test, and B3test samples show a very slight shift in intensity to a lower frequency field than the B1control, B2control, and B3control samples for the strongly bound DDAA corroborating partly strengthened hydrogen bonding upon exposure to the meditative vibrations. This is true, both at 488 nm and 633 nm (Table 3 and Supplementary Table 1). A similar trend was observed for all the spectra obtained for the samples collected during the eight-day camp. Table 4 shows the comparison between the samples from brand 1, B1control, B1test, the sample collected on day 1 and day 8 of the eight-day camp, i.e., B1D1 and B1D8. The data shows a shift of the stretch vibrations toward the lower frequency for all the peaks, including DDAA, DA, DDA, and the free OH. This, however, is very slight for any conclusive analyses. Nevertheless, this corroborates with the increased dipoles and hence strengthened hydrogen bonding. In fact, the Raman Spectra in liquid water are complex overlaps of vibrational overtones and oscillatory movements upon hydrogen bond formations (restricted rotations) (Hu et al., 2017). Thus, despite the observed shift in the center of the peaks for all the test samples, we do not see a definite trend in the overall percentage of area for these samples. This restricts a clear interpretation of the exact nature of the molecular change-induced due to exposure to the external frequencies.
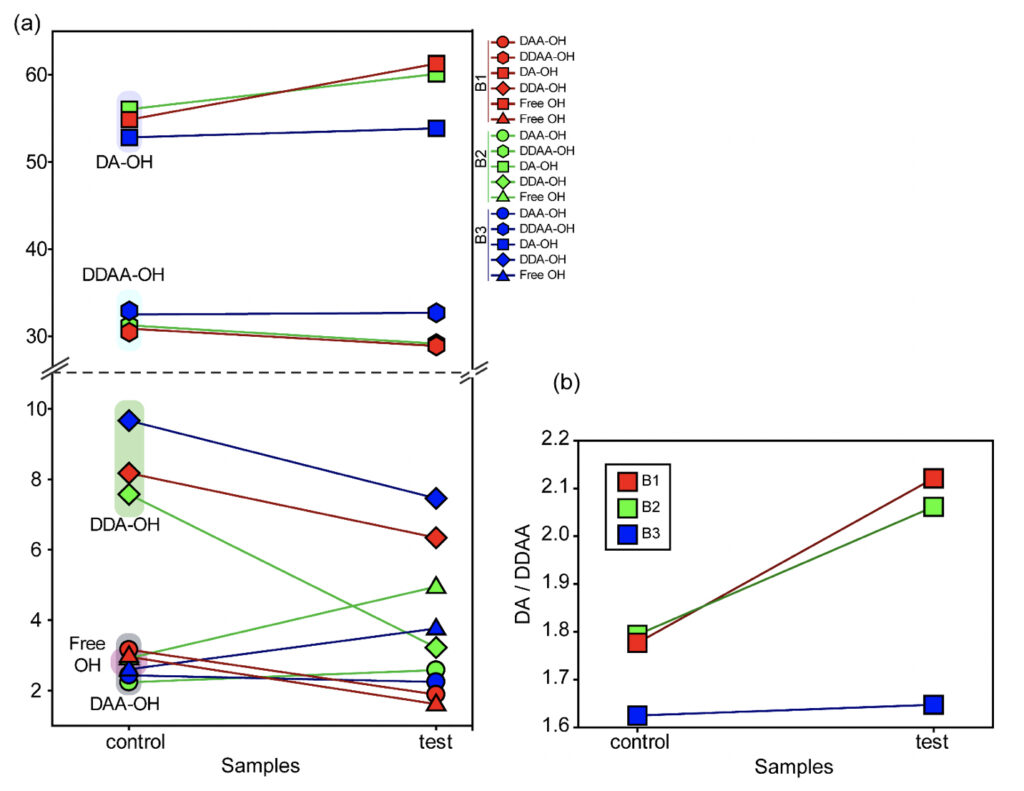
Figure 2. Modulation of the hydrogen bonding characterized using Raman’s Spectroscopy. (a) Varying percentage of the total area of the individual peaks compared to the total water (values represented in Table 3) in control and the test samples show differences in the molecular ordering. (b) The ratio of the total area of the two major fractions of the water samples, DA-OH and DDAA-OH, suggest a shift toward a weak hydrogen-bonded environment. Since no significant change is apparent for the more tightly bound DDAA-OH, the ratio suggests a shift towards a more ordered sample space as opposed to high-energy intermolecular H-bonding.
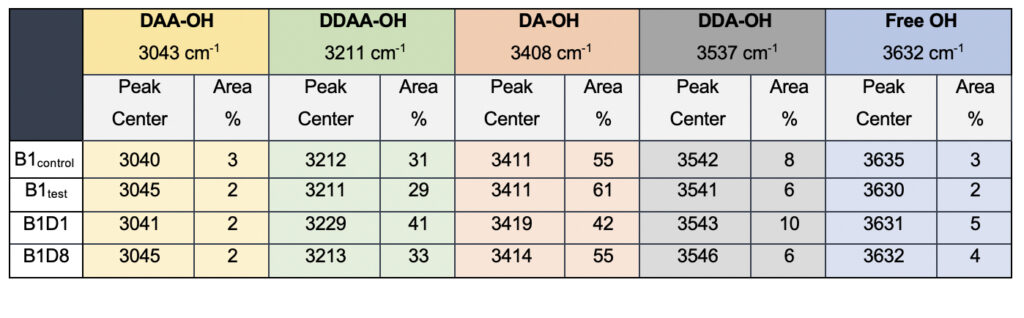
Table 4. Raman Spectral analyses of the B1 samples; control and the test samples from two separate camps.
Interestingly when we probe the ultrasonically vibrated water samples, we see a definite hypsochromic shift for all the samples compared to the control sample, B1control (Table 5). The most striking difference was observed in the total percentage of the area for the DDAA tightly bonded fraction as opposed to the DA-OH (Table 5). While the single-donor-acceptor fraction shows an ~80% reduction in the percentage, the DDAA-OH shows a more than 100% increase for all the ultrasonically vibrated samples, irrespective of the treatment amplitude or the duration for which it was exposed. This allows us to conclusively comment on the subtle nature of changes induced by the exposure of the samples to the meditational energy frequencies. While we treat the water in the controlled environment for the ultrasonically vibrated water fractions and can easily corroborate to any molecular clustering effect, with the meditative frequencies, we can only comment on the apparent modulations of the hydrogen bonding.
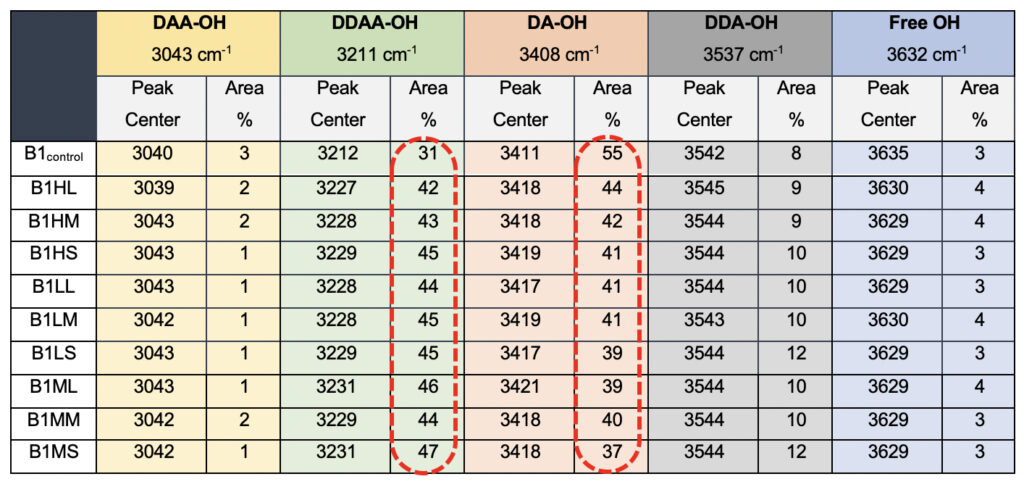
Table 5. Raman Spectral analyses for the ultrasonically vibrated water samples used for comparison to the test samples, showing differences in the peak centers and the total area when compared to the total water.
Breaking the intermolecular hydrogen bonds can indicate two probable outcomes: (i) increased number of molecules in the free fractions with an increased disorder in the atomic arrangement, and (ii) re-arrangement of the bonds from the tetrahedral geometry to a much more linear fraction with modulated physical properties. The fact that the most tightly bound fractions of the molecules remained unaltered upon being treated with an increase in the fraction of the weakly bound atoms (increase in the DA/DDAA ratio), the latter explanation appeared to be more plausible. Alternatively, the hydrogen bonding in the test samples being much more stable (red-shifted profile), suggests more ordering in the molecular clusters than in the ultrasonically vibrated water samples. This prompted us to extend our studies into employing the principles of nuclear magnetic resonance (NMR) to probe the associated dynamics underlying the rate of diffusion due to molecular ordering.
Characterizing the Intermolecular Hydrogen Bonding
Transverse relaxation time (T2) corresponding to the 1H nuclei for water samples in solution-state NMR spectroscopy can serve as a sensitive probe for studying the associated dynamics (Grunin et al., 2013). The nature of intermolecular cross-talks due to moderated hydrogen bonding can serve as centers that affect the inter-proton exchange, speeding up relaxation and reducing the spin-spin relaxation time (Mallamace et al., 2016). This prompted us to use NMR to complement the Raman’s spectral analysis and provide some insight into the dynamics at atomic resolution.
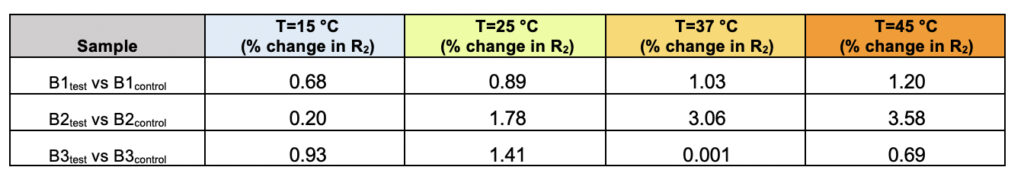
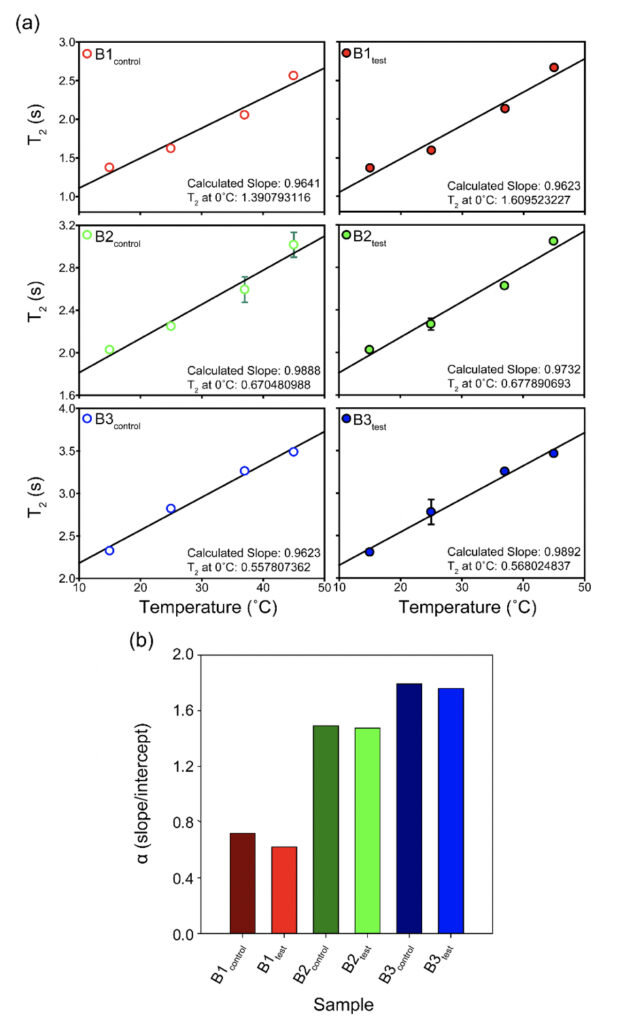
We recorded T2 rates for all B1, B2, and B3 water samples. Interestingly, at lower temperatures, i.e., 15ºC and 25ºC, the T2 values recorded for the three test samples are smaller than the corresponding control. This, however, shows an opposite trend for the values obtained at higher temperatures, i.e., at 37ºC and 45ºC (Table 6 and Supplementary Table 2). As the time scale of rotational motion is inversely proportional to relaxation time, it is evident that water in test samples is slower than the control samples at lower temperature regimes. However, the extent of increment of T2, expressed as the percentage of change in the relaxation rate, R2 (1/T2), of test samples is greater at a high-temperature regime than in the control (Supplementary Table 2). Additionally, the linear fitting of the temperatures versus normalized T2 values manifested in consistently higher slope magnitudes (m) in all the test samples compared to the control samples (Supplementary Fig. 2 and Supplementary Table 3). Thus, qualitatively and quantitatively, the data suggests that either at lower temperatures and/or room temperature, the water molecules in the test samples are more structured, corroborating the larger hydrogen bond networking than the control samples. Furthermore, as temperature increases, the extent of breaking the association between the water molecules becomes larger in the case of test samples than in the controls. Hence, the movement of the water molecules in the test samples was faster than the control in the higher temperature regime, resulting in the higher values of T2. This observation further reinstates that, despite the sample’s overall stabilization due to a higher number of hydrogen bonds in the treated sample, the energy associated with the intermolecular interactions is lower than the control set. This can be directly compared to the observations obtained from Raman spectroscopic data, wherein the total fraction of the most tightly bound water fractions (DAA-OH and DDAA-OH) did not show any remarkable change, despite the red-shifted stabilization profile. The lower energy profile allows higher temperatures to break the intermolecular association easily.
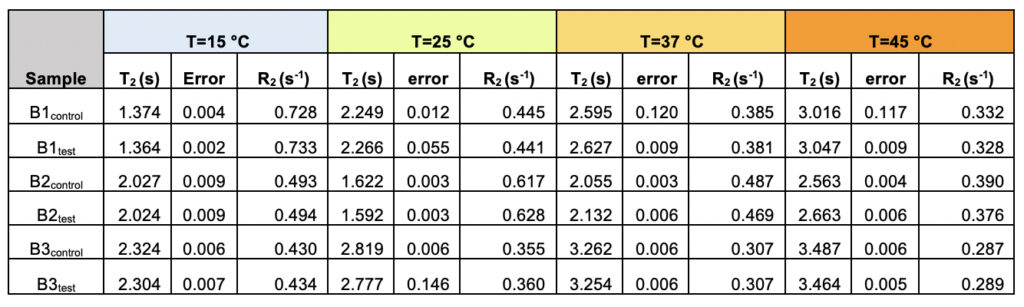
Table 6. The observed transverse relaxation time (T2) and rate (R2=1/T2) for the test and control samples from all the three brands (B1, B2, and B3) as a function of varying the temperature shows the differences between the test and the control samples.
The T2 versus temperature plot for different tests and the control samples provided a straight line (Y= mX +C) intersecting the y axis. The intercept, C times T2 at 15ο C (lowest value of data-set) for each set, was used to define the motional time-scale of water molecules of that sample at 0°C. As the association is higher at the lower temperature domains, it is expected that near 0°C the T2 will be much smaller for the test samples than the control, which is in good agreement with our findings. Also, the extent of the decrease of intercept-value in case of the test sample is higher compared to the extent of increment of the slope of the same. Thus, we could propose a new temperature-dependent quantity or parameter, α(T) defined as:
α(T) = [C/m ] equation (2)
i.e., the ratio of intercept (C) to slope (m) which is found to be smaller for all the control samples than the corresponding test samples. Therefore, α is such a parameter that allows us to indirectly measure the ratio of the strength of hydrogen bonds to the number of hydrogen bonds within the water molecules at a given temperature. The higher the value of α, the lower the number of hydrogen bonds and the higher is the energy, and vice-versa. Among the samples tested, the observed difference was most prominent for the B1 samples (Supplementary Fig. 2 and Supplementary Table 3).
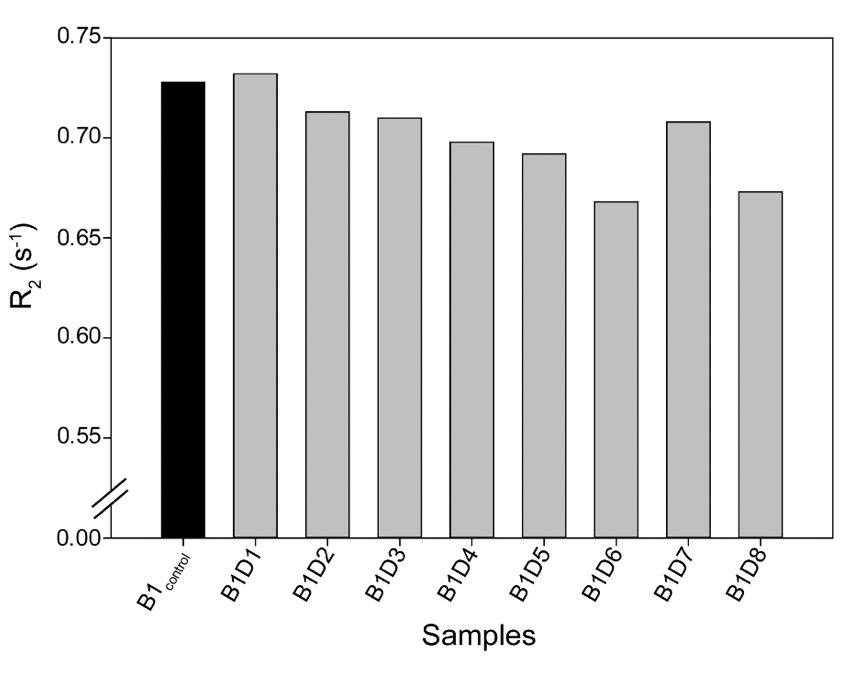
A similar relaxation profile was obtained for the water samples obtained from the eight-day-long camps (Day 1 to Day 8) tested at 25ºC. All the samples exhibited higher relaxation rates than the control water (B1control) (Supplementary Fig. 3). This data further confirms that the rate (R2) of diffusion for vibrated water to be more restricted due to the hydrogen bonding (Supplementary Table 4).
Effect of the Modulations in the Pathophysiological Scenario
Modulation of the ordering of the hydrogen-bonded architecture of the water molecules can induce nucleating effects on protein amyloids (Chatani et al., 2014). We, therefore, studied the effect of the treated water on the amyloidogenic propensity of proteins and peptides responsible for progressive metabolic disorders. While the amyloidogenic intrinsically disordered α-synuclein has been extensively studied for Parkinson’s disease (Breydo et al., 2012; Stefanis, 2012; Bhattacharyya et al., 2018), the exact etiology continues to be debatable. The Aβ40 peptide is yet another membrane-associated amyloid that has been extensively studied and correlated to the multifactorial Alzheimer’s disease (Sgourakis et al., 2007; Murphy and LeVine, 2010), the most prevalent neurodegenerative disorder. Alternatively, the human Islet polypeptide (hIAPP) has been conclusively identified to be responsible for Type II diabetes, a growing silent epidemic plaguing the world (Jaikaran and Clark, 2001; Marzban et al., 2003; Soong et al., 2009). With growing evidence of the therapeutic effect of meditation on such chronic disorders, it is crucial to find a molecular basis to correlate the practice of meditation to amyloidogenesis.
Accumulating evidence suggests that early modulation of the specific structural motifs in the protein’s primary structure can alter the amyloidogenic susceptibility (Bhattacharyya et al., 2018). Water, an integral component of biomolecular interactions, can play an intrinsic role in these early dynamic events mediated through the hydration forces and hydrogen bonding (Levy and Onuchic, 2004). Our preliminary studies with the physiochemically altered water on the amyloidogenic propensity aim to set the stage for subsequent extension of the work to find definite answers.
Tested Water Samples Modulate the Aggregation Kinetics of Amyloidogenic Protein/Peptides
The fibrillation kinetics of the amyloidogenic Aβ40, hIAPP, and α-synuclein were studied using the Thioflavin T (ThT) based fluorescence assay (Biancalana and Koide, 2010). The three protein/peptide systems were studied in the water samples (B1, B2, and B3, both control and test sets). The ThT-based fluorescence assay (Fig. 3) with the samples reveals a classical representative profile for nucleation-dependent aggregation kinetics (Bhattacharyya et al., 2018; Linse, 2019). The aggregation profiles for the three protein/peptide systems are different from each other, as studied extensively in the literature. However, the kinetics in the presence of water, both the control and the treated, represent a distinctly different profile from the ones obtained in buffered sample conditions. This is expected as the kinetics are largely influenced by the sample conditions, including the pH and the salt conditions. Nevertheless, a dramatic difference in the aggregation profile in the presence of the controls was observed, as opposed to the test samples for all three protein/peptides. Interestingly, B1 and B2 show reduced overall fibrillar species for all the three polypeptide aggregates at saturation, whereas B3 manifests in a higher fluorescence intensity corresponding to greater β-sheet containing fibrillar species under the influence of the treated sample sets. This could be possible due to the chemical nature of the water purification treatment that this particular brand employs.
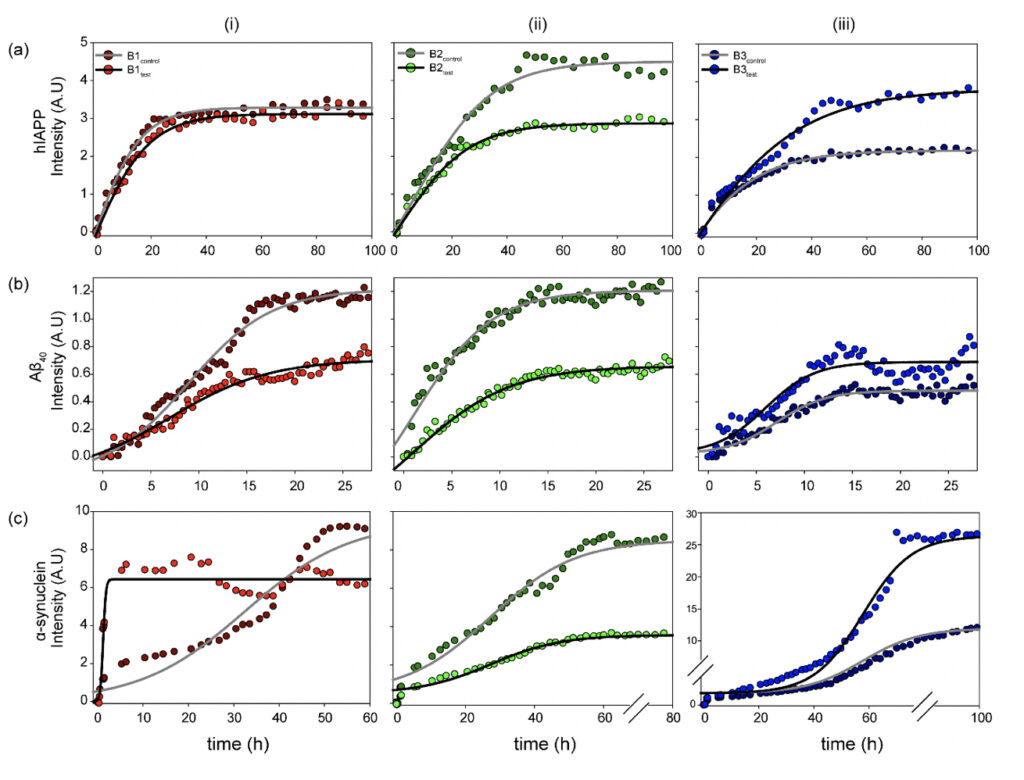
Figure 3. Physicochemical changes in the water samples modulate functional amyloidogenesis. Aggregation kinetics of the three (a) hIAPP, (b) Aβ40 and (c) α-synuclein amyloidogenic systems measured in the presence of the (i) B1, (ii) B2, and (iii) B3 water sample sets (control and test) as observed from the fluorescence intensity upon ThT binding as a function of incubation time. The experiments in triplicate for all the samples yielded qualitatively similar results. All the experiments were performed in shaking condition and at 37ºC.
Striking differences were observed in the α-synuclein aggregation profile for all three, B1, B2, and B3. As already mentioned, the amyloidogenesis in the presence of water manifests in much faster aggregation kinetics than the previously reported data in the buffered solutions (Bhattacharyya et al., 2018). Despite the rapid aggregation profile, the individual phases of the duration of the nucleation-based aggregation kinetics are long enough to observe the differences in the presence of the water samples. This could be possible due to the chemical nature of the water purification treatment that this particular brand employs.
Among the three brands, B1 induces maximum changes in the observed α-synuclein amyloidogenesis. B1control itself induces a faster aggregation profile with a significantly reduced lag phase and enters the exponential phase as early as ~10 h of incubation, reaching saturation by 60 h. Further, interestingly, the B1test sample magnifies the effect manifesting in even more rapid aggregation kinetics with the log-phase beginning within the first 5 h of incubation. The sample reaches saturation by ~15 h of incubation, however, with a comparatively lower intensity, corroborating qualitatively distinct fibrillar species that are lower in content than the sample in the presence of B1control. This is reproduced qualitatively when similar experiments were performed with the B1 water samples from the eight-day-long camps. All the test water samples from day 1 to day 8 (B1D1-B1D8) exposed to the meditative frequencies showed overall faster aggregation kinetics when compared to the B1control.
On the other hand, B2test shows a slightly enhanced propensity for fibril formation, reaching the saturation plateau at ~50 h of incubation. However, the maximum intensity upon saturation is much lower in the presence of B2test as opposed to B2control.This is in sharp contrast to the effect imparted by B3test, which manifests in much faster entry into the exponential phase than the B3control, reaching saturation at ~70h of incubation with greater overall fluorescence intensity.
While this is a qualitative interpretation of the preliminary data obtained for amyloidogenic systems in the presence of water, the exact physiological impact of the modulated kinetics is elusive. Moreover, correlating the amyloidogenic kinetics in a dilute buffer system can be difficult; nevertheless, the observed differences between the water samples, with the only difference being exposure to the external frequencies emanating from the elevated meditative state of a long-term practitioner, is interesting.
α-synuclein Fibrillar Species Obtained in the Presence of Water Samples Showed Different Cytotoxicity Profile
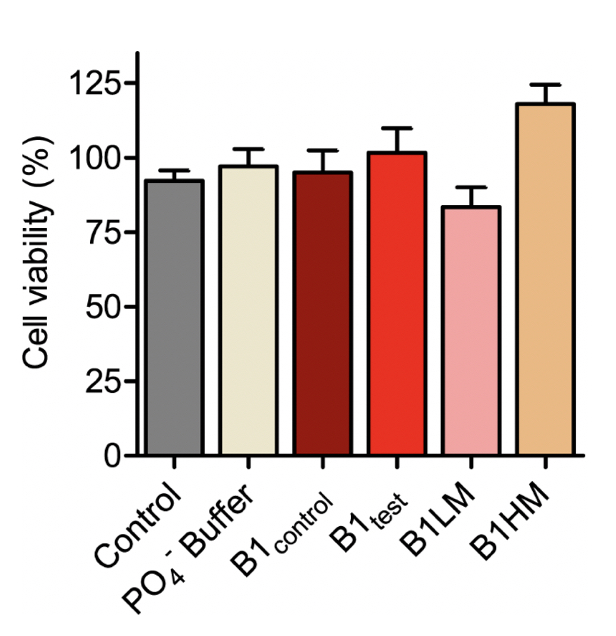
There is substantial proof that a faster aggregation profile correlates to a less cytotoxic population of amyloid species. Interestingly, the matured α-synuclein fibrils obtained in the presence of the treated B1test water sample showed a lower cytotoxic profile against the neuroblastoma SHSY5Y cells when compared to the fibrils formed in the presence of B1control. This is intriguing as the WT fibrillar form of the protein almost always presents with a cytotoxic profile as represented in Figure 4. While the B1control treated samples show similar cytotoxicity to that of the wild type (WT), fibrils formed in the presence of B1test show ~31% increase in the cell viability. In fact, fibrils formed in the presence of B1control water exposed to lower vibrational frequencies for medium duration (B1LM) show a comparable reduction in the cytotoxic profile with ~30% increase in viable cells. The water samples themselves were non-toxic and had a similar effect on the overall cell viability (Supplementary Fig. 4). Thus, the data suggest that exposure to frequencies modulates the properties of water that directly affects the protein dynamics- into functionally distinct conformers.
Incubation with Treated Water Samples Modulates the Residual Backbone of α-synuclein
We employed high-resolution solution-state NMR to gain atomic insight into the early chemical backbone structure of α-synuclein in the presence of the water variants that prompt the subsequent modulations in its amyloidogenic propensity. Using real-time NMR experiments, we investigated the changes in the conformational landscape of α-synuclein in the presence of B1control and B1test at a very early stage of self-aggregation. The 1H-15N band-selective excitation short transient (BEST) Transverse relaxation optimized spectroscopy (TROSY) spectra in either sample were similar to the previously reported buffered solution of the monomeric protein (Supplementary Fig. 5) (Bhattacharyya et al., 2018). Interestingly, however, we observed subtle changes in the protein’s backbone motif, with progressive peak broadening observed as a function of incubation time. The intensity ratio (I/I0) between the profiles obtained at 0 h (I0) and 8 h (I) of incubation showed a broadened profile pertaining to the N-terminal and the central hydrophobic stretch (Fig. 5 and Supplementary Fig. 5).
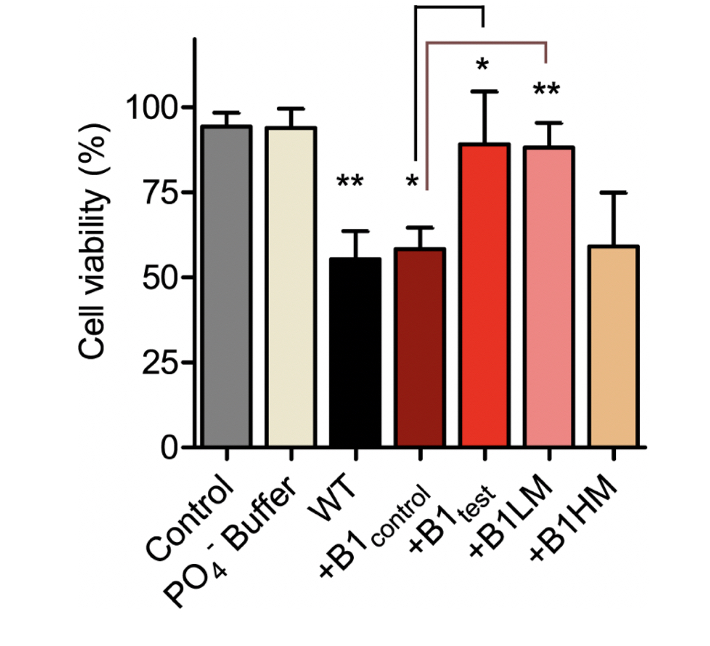
Figure 4. The treated water samples induce functional changes in the protein conformers affecting the corresponding cytotoxicity. SHSY5Y cells were treated with α-synuclein fibril at a concentration of 10 µM dissolved in Phosphate buffer (WT) and different water samples of B1control, B1test, B1LM and B1HM for 24 h. Cell viability was measured by MTT assay under shaking condition. Values are represented as mean ± SEM, n=3. Significance was analyzed using unpaired one-tailed t-test for B1test and B1LM taking B1control as control and one-way ANNOVA in case of WT and B1control with respect to Control. * p < 0.05, ** p<0.01.
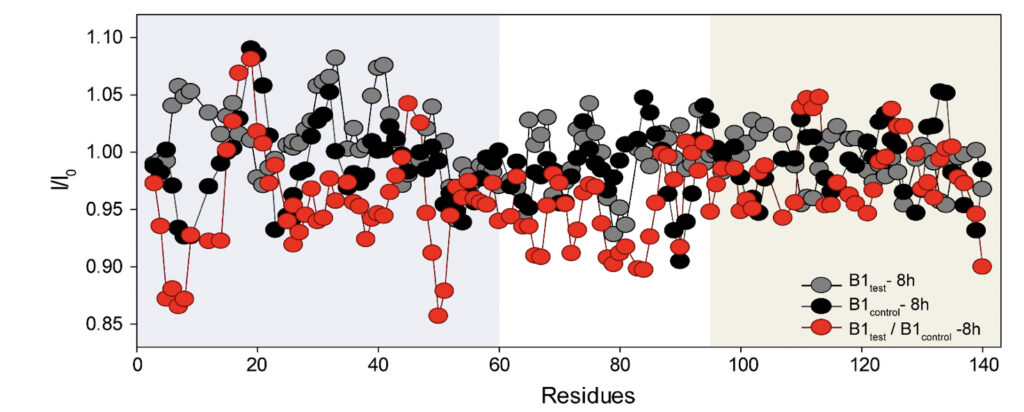
Figure 5. Rapid amyloidogenesis in the presence of the treated water samples stems from distinct modulations of specific backbone motifs. The intensity ratios obtained for α-synuclein upon treatment with the B1control and the B1test show residue-specific association in corroboration of the difference in the aggregation kinetics. As opposed to the ratios obtained for the same samples at different time points (grey and black profile), the ratio of B1test / B1control (red profile) divulges the specific residues responsible for the difference in the aggregation kinetics between the two samples. The running average taking 4 residues at a time shows a greater broadening of specific stretches from the N-terminal (residues 1-60, shaded in grey) and the central hydrophobic region (61-95, shaded white) in the test samples.
This can directly be correlated to the faster aggregation propensity of the protein with the central hydrophobic stretch and portions of the N-terminus serving as the fibrillation core of the protein (Bhattacharyya et al., 2018). The observation corroborates the involvement of these stretches in intermolecular interactions, manifesting in greater spin-spin interactions and, hence, greater broadening. Thus, it is plausible that the physiochemical changes induced in the water sample can impart molecular interactions with the protein counterpart, inducing a much more aggregation-prone conformer. However, further studies in situ are already underway and should provide us with a better perspective.
Conclusions
The current study, though preliminary, provides essential molecular insight into water as a molecular blueprint for the energy frequencies emanating from meditative practices. Our results suggested that the water samples kept in the proximity of a long-term meditation practitioner showed a definite change in the hydrogen bonding pattern and the molecular architecture of water. Interestingly, all three brands used in the current study showed similar trends in the pattern changes, despite the slight differences in the mineral composition and ionic strength as described by the respective companies in their product details. Comparison with the controls (i.e., bottles not exposed to the meditative proximity for each of the three respective brands) enabled us to observe any change in the treated sample sets, however subtle, that was induced only by the effect of exposure to the meditative energy field. The fact that the exposure to external energy fields can actually affect similar changes in the bonding pattern was further validated from the second set of test samples prepared using the same three brands (with same batches) that were not exposed to the meditation proximity but were exposed to the ultrasonic waves (with varying intensities of vibrational frequency exposure).
In fact, the physicochemical changes in the sample demonstrated the ability to cause specific modulations of the aggregation kinetics of the tested amyloid peptides/proteins, affecting distinct protein functional motifs. This was an interesting finding, considering water to be a molecular “link” to the manifold physiological impacts of the long-term meditation practice. However, future correlation of the observed data to the changes in the physiological water might give a clearer perspective of the molecules involved in the absorption of any energy fields emanating from such long-term practices. Additional studies with a larger sample set and a population-wide distribution would be necessary to gain statistically significant data to identify water as a direct definite “probe” conclusively. Nevertheless, in its current state, our study provides a basic stepping stone for further intervention on the physiologically relevant water (that would require much more complex and invasive experimental techniques). Furthermore, the current findings on the induced changes in the molecular architecture of water upon exposure to meditation might enable us to change our perspective in interpreting the future fMRI and EEG based studies on meditation.
Conflict of Interest
The authors declare that the research was conducted without any commercial or financial relationships that could be construed as a potential conflict of interest.
Author Contributions
AB and AM conceptualized and designed the research; AK and AM arranged the water sample collections; CN collected the Raman’s Spectroscopy data under the supervision of AS; BNR, NCM and AS analyzed the Raman’s Spectra; IC collected and analyzed the water NMR relaxation data; DB performed the ThT, AFM and NMR for the application based studies; RP was involved in Aβ sample preparation and kinetics; GS performed and analyzed the cell biological assays with AKM; DB and AB wrote the manuscript; AB and AM arranged the funding for the work; all authors reviewed the manuscript.
Acknowledgments
The authors thank HH Shree Shivkrupananda Swami for encouraging the study, His willingness to participate in subsequent studies, and constant support during the course of this study. AB and AM thank Gurutattva team for the logistics and help during the course of the study. AB thanks Dr. Smarajit Polley from the Department of Biophysics, Bose Institute, Kolkata, for letting us use the probe sonicator.
References
Ahani A, Wahbeh H, Nezamfar H, Miller M, Erdogmus D, Oken B (2014). Quantitative change of EEG and respiration signals during mindfulness meditation. J Neuroeng Rehabil 11: 87.
Ball P (2017). Water is an active matrix of life for cell and molecular biology. Proc Natl Acad Sci U S A 114(51): 13327-13335.
Baron Short E, Kose S, Mu Q,Borckardt J, Newberg A, George MS, Kozel FA (2010). Regional brain activation during meditation shows time and practice effects: an exploratory FMRI study. Evid Based Complement Alternat Med 7(1): 121-127.
Bhattacharyya D, Kumar R, Mehra S, Ghosh A, Maji SK, Bhunia A (2018). Multitude NMR studies of α-synuclein familial mutants: probing their differential aggregation propensities. Chem Commun (Camb) 54(29): 3605-3608.
Biancalana M, Koide S (2010). Molecular mechanism of Thioflavin-T binding to amyloid fibrils. Biochim Biophys Acta 1804(7): 1405-1412.
Boccia M, Piccardi L, Guariglia P (2015). The Meditative Mind: A Comprehensive Meta-Analysis of MRI Studies. Biomed Res Int 2015, 419808.
Bouteiller Y, Perchard J (2004). The vibrational spectrum of (H2O) 2: Comparison between anharmonic ab initio calculations and neon matrix infrared data between 9000 and 90 cm− 1. Chemical physics 305(1-3): 1-12.
Bowman AD, Griffis JC, Visscher KM, Dobbins AC, Gawne TJ, DiFrancesco MW, Szaflarski JP (2017). Relationship Between Alpha Rhythm and the Default Mode Network: An EEG-fMRI Study. J Clin Neurophysiol 34(6): 527-533.
Braboszcz C, Cahn BR, Levy J, Fernandez M, Delorme A (2017). Increased Gamma Brainwave Amplitude Compared to Control in Three Different Meditation Traditions. PLoS One 12(1): e0170647.
Brandmeyer T, Delorme A (2021). Meditation and the Wandering Mind: A Theoretical Framework of Underlying Neurocognitive Mechanisms. Perspect Psychol Sci 16(1): 39-66.
Brewer JA, Worhunsky PD, Gray JR, Tang YY, Weber J, Kober H (2011). Meditation experience is associated with differences in default mode network activity and connectivity. Proc Natl Acad Sci U S A 108(50): 20254-20259.
Breydo L, Wu JW, Uversky VN (2012). Α-synuclein misfolding and Parkinson’s disease. Biochim Biophys Acta 1822(2): 261-285.
Brini E, Fennell CJ, Fernandez-Serra M, Hribar-Lee B, Luksic M, Dill KA (2017). How water’s properties are encoded in its molecular structure and energies. Chemical reviews 117(19): 12385-12414.
Bryukhovetskiy AS, Brusilovsky LI, Kozhin SP, Serafimovich PG, Nikonorov AV, Zhukova M, Sharma HS (2020). Human mind has microwave electromagnetic nature and can be recorded and processed. Prog Brain Res 258: 439-463.
Cahn BR, Delorme A, Polich J (2010). Occipital gamma activation during Vipassana meditation. Cogn Process 11(1): 39-56.
Cameron I, Fullerton G (2014). Properties and size of multiple non-bulk water fractions on proteins and in cells. Water 4: 76-90.
Chatani E, Tsuchisaka Y, Masuda Y, Tsenkova R (2014). Water molecular system dynamics associated with amyloidogenic nucleation as revealed by real time near infrared spectroscopy and aquaphotomics. PLoS One 9(7): e101997.
Cheong MJ, Son SE, Kang HW, Lee Y, Bae KH, Kang Y, Lee EM, Lee GE, Seo JH, Weon HW, Lee JY, Lyu YS(2018). Meditation-based clinical study to determine the correlation of quantitative electroencephalogram (qEEG) and 24-hour EEG activity. Medicine (Baltimore) 97(43): e12557.
Choe C, Lademann J, Darvin ME (2016). Depth profiles of hydrogen bound water molecule types and their relation to lipid and protein interaction in the human stratum corneum in vivo. Analyst 141(22): 6329-6337.
Clancy KJ, Andrzejewski JA, You Y, Rosenberg JT, Ding M, Li W (2022). Transcranial stimulation of alpha oscillations up-regulates the default mode network. Proc Natl Acad Sci U S A 119(1).
Cooke R, Kuntz ID (1974). The properties of water in biological systems. Annu Rev Biophys Bioeng 3(0): 95-126.
Curnutte B, Bandekar J (1972). The intramolecular vibrations of the water molecule in the liquid state. Journal of Molecular Spectroscopy 41(3): 500-511.
Das A, de Los Angeles C, Menon V (2022). Electrophysiological foundations of the human default-mode network revealed by intracranial-EEG recordings during resting-state and cognition. Neuroimage 250: 118927.
De Ninno A, Del Giudice E, Gamberale L, Castellano AC (2013). The structure of liquid water emerging from the vibrational spectroscopy: Interpretation with QED theory. arXiv preprint arXiv:1310.0635.
Ferrarelli F, Smith R, Dentico D, Riedner BA, Zennig C, Benca RM, Lutz A, Davidson RJ, Tononi G (2013). Experienced mindfulness meditators exhibit higher parietal-occipital EEG gamma activity during NREM sleep. PLoS One 8(8): e73417.
Fox KC, Zakarauskas P, Dixon M, Ellamil M, Thompson E, Christoff K (2012). Meditation experience predicts introspective accuracy. PLoS One 7(9): e45370.
Franco MI, Turin L, Mershin A, Skoulakis EM (2011). Molecular vibration-sensing component in Drosophila melanogaster olfaction. Proc Natl Acad Sci U S A 108(9): 3797-3802.
Geesink HJ, Jerman I, Meijer DK (2020). Water, the cradle of life via its coherent quantum frequencies. Water 11: 78-108.
Grunin L, Nikolskaya E, Edwards J (2013). The use of 1H-NMR Relaxation Times of Water Adsorbed on Soils to Monitor Environment Pollution. Air, Soil and Water Research 6: ASWR. S12406.
Hasenkamp W, Wilson-Mendenhall CD, Duncan E, Barsalou LW (2012). Mind wandering and attention during focused meditation: a fine-grained temporal analysis of fluctuating cognitive states. Neuroimage 59(1): 750-760.
Hu Q, Zhao H, Ouyang S (2017). Understanding water structure from Raman spectra of isotopic substitution H 2 O/D 2 O up to 573 K. Physical Chemistry Chemical Physics 19(32): 21540-21547.
Idris Z (2020). Quantum Physics Perspective on Electromagnetic and Quantum Fields Inside the Brain. Malays J Med Sci 27(1): 1-5.
Isbel B, Weber J, Lagopoulos J, Stefanidis K, Anderson H, Summers MJ (2020). Neural changes in early visual processing after 6 months of mindfulness training in older adults. Sci Rep 10(1): 21163.
Jaikaran ET, Clark A (2001). Islet amyloid and type 2 diabetes: from molecular misfolding to islet pathophysiology. Biochim Biophys Acta 1537(3): 179-203.
Jéquier E, Constant F (2010). Water as an essential nutrient: the physiological basis of hydration. European journal of clinical nutrition 64(2): 115-123.
Jerath R, Crawford MW (2015). Layers of human brain activity: a functional model based on the default mode network and slow oscillations. Front Hum Neurosci 9: 248.
Jungwirth P (2015). Biological Water or Rather Water in Biology? J Phys Chem Lett 6(13): 2449-2451.
Kavouras SA, Anastasiou CA (2010). Water physiology: essentiality, metabolism, and health implications. Nutrition Today 45(6): S27-S32.
Kemp DD, Gordon MS (2008). An interpretation of the enhancement of the water dipole moment due to the presence of other water molecules. J Phys Chem A 112(22): 4885-4894.
Kitadai N, Sawai T, Tonoue R, Nakashima S, Katsura M, Fukushi K (2014). Effects of ions on the OH stretching band of water as revealed by ATR-IR spectroscopy. Journal of solution chemistry 43(6): 1055-1077.
Kucyi A, Esterman M, Riley CS, Valera EM (2016). Spontaneous default network activity reflects behavioral variability independent of mind-wandering. Proc Natl Acad Sci U S A 113(48): 13899-13904.
Le Bihan D (2007). The ‘wet mind’: water and functional neuroimaging. Phys Med Biol 52(7): R57-90.
Le Bihan D, Breton E, Lallemand D, Grenier P, Cabanis E, Laval-Jeantet M (1986). MR imaging of intravoxel incoherent motions: application to diffusion and perfusion in neurologic disorders. Radiology 161(2): 401-407.
Le Bihan D, Iima M (2015). Diffusion Magnetic Resonance Imaging: What Water Tells Us about Biological Tissues. PLoS Biol 13(7): e1002203.
Le Bihan D, Johansen-Berg H (2012). Diffusion MRI at 25: exploring brain tissue structure and function. Neuroimage 61(2): 324-341.
Lee DJ, Kulubya E, Goldin P, Goodarzi A, Girgis F (2018). Review of the neural oscillations underlying meditation. Frontiers in neuroscience 12: 178.
Levy Y, Onuchic JN (2004). Water and proteins: a love-hate relationship. Proc Natl Acad Sci U S A 101(10): 3325-3326.
Linse S (2019). Mechanism of amyloid protein aggregation and the role of inhibitors. Pure and Applied Chemistry 91(2): 211-229.
Lutz A, Greischar LL, Rawlings NB, Ricard M, Davidson RJ (2004). Long-term meditators self-induce high-amplitude gamma synchrony during mental practice. Proc Natl Acad Sci U S A 101(46): 16369-16373.
Mallamace F, Corsaro C, Mallamace D, Vasi S, Stanley HE (2016). NMR spectroscopy study of local correlations in water. J Chem Phys 145(21): 214503.
Marzban L, Park K, Verchere CB (2003). Islet amyloid polypeptide and type 2 diabetes. Exp Gerontol 38(4): 347-351.
Miyoshi T, Tanioka K, Yamamoto S, Yadohisa H, Hiroyasu T, Hiwa S (2019). Revealing Changes in Brain Functional Networks Caused by Focused-Attention Meditation Using Tucker3 Clustering. Front Hum Neurosci 13: 473.
Mizuse K, Fujii A, Mikami N (2007). Long range influence of an excess proton on the architecture of the hydrogen bond network in large-sized water clusters. The Journal of Chemical Physics 126(23): 231101.
Murphy MP, LeVine H (2010). Alzheimer’s disease and the amyloid-beta peptide. J Alzheimers Dis 19(1): 311-323.
Nair J, Klaassen AL, Arato J, Vyssotski AL, Harvey M, Rainer G (2018). Basal forebrain contributes to default mode network regulation. Proc Natl Acad Sci U S A 115(6): 1352-1357.
Natali F, Dolce C, Peters J, Stelletta C, Demé B, Ollivier J, Boehm M, Leduc G, Piazza I, Cupane A, Barbier EL (2019). Anomalous water dynamics in brain: a combined diffusion magnetic resonance imaging and neutron scattering investigation. J R Soc Interface 16(157): 20190186.
Pratt LR, Pohorille A, Asthagiri D (2007). What is special about water as a matrix of life? arXiv preprint physics/0701282.
Pritchett DL, Siegle JH, Deister CA, Moore CI (2015). For things needing your attention: the role of neocortical gamma in sensory perception. Curr Opin Neurobiol 31: 254-263.
Rodriguez-Larios J, Faber P, Achermann P, Tei S, Alaerts K (2020). From thoughtless awareness to effortful cognition: alpha – theta cross-frequency dynamics in experienced meditators during meditation, rest and arithmetic. Sci Rep 10(1): 5419.
Sgourakis NG, Yan Y, McCallum SA, Wang C, Garcia AE (2007). The Alzheimer’s peptides Abeta40 and 42 adopt distinct conformations in water: a combined MD / NMR study. J Mol Biol 368(5): 1448-1457.
Sierra-Martín B, Romero-Cano M, Cosgrove T, Vincent B, Fernández-Barbero A (2005). Solvent relaxation of swelling PNIPAM microgels by NMR. Colloids and Surfaces A: Physicochemical and Engineering Aspects 270: 296-300.
Soong R, Brender JR, Macdonald PM, Ramamoorthy A (2009). Association of highly compact type II diabetes related islet amyloid polypeptide intermediate species at physiological temperature revealed by diffusion NMR spectroscopy. J Am Chem Soc 131(20): 7079-7085.
Stefanis L (2012). α-Synuclein in Parkinson’s disease. Cold Spring Harb Perspect Med 2(2): a009399Sun Q (2013). Local statistical interpretation for water structure. Chemical Physics Letters 568: 90-94.
Sun Q, Guo Y (2016). Vibrational sum frequency generation spectroscopy of the air/water interface. Journal of Molecular Liquids 213: 28-32.
Sun Q, Zheng H (2009). Raman OH stretching vibration of ice Ih. Progress in Natural Science 19(11): 1651-1654.
Tan LB, Lo BC, Macrae CN (2014). Brief mindfulness meditation improves mental state attribution and empathizing. PLoS One 9(10): e110510.
Tang YY, Hölzel BK, Posner MI (2015). The neuroscience of mindfulness meditation. Nat Rev Neurosci 16(4): 213-225.
Tang YY, Ma Y, Wang J, Fan Y, Feng S, Lu Q, Yu Q, Sui D, Rothbart MK, Fan M, Posner MI (2007). Short-term meditation training improves attention and self-regulation. Proc Natl Acad Sci U S A 104(43): 17152-17156.
Tsiper EV (2005). Polarization forces in water deduced from single molecule data. Physical review letters 94(1): 013204.
Yablonskiy DA, Sukstanskii AL (2010). Theoretical models of the diffusion weighted MR signal. NMR Biomed 23(7): 661-681.
Yang CC, Barrós-Loscertales A, Li M, Pinazo D, Borchardt V, Ávila C, Walter M (2019). Alterations in Brain Structure and Amplitude of Low-frequency after 8 weeks of Mindfulness Meditation Training in Meditation-Naïve Subjects. Sci Rep 9(1): 10977.
Yinnon T (2018). Aqueous Solutions and other Polar Liquids Perturbed by Serial Dilutions and Vigorous Shaking: Analyses of Their UV Spectra. Water 10: 11-40.
Yordanova J, Kolev V, Nicolardi V, Simione L, Mauro F, Garberi P, Raffone A, Malinowski P (2021). Attentional and cognitive monitoring brain networks in long-term meditators depend on meditation states and expertise. Sci Rep 11(1): 4909.
Zhao L, Ma K, Yang Z (2015). Changes of water hydrogen bond network with different externalities. Int J Mol Sci 16(4): 8454-8489.
Supplementary Material
Supplementary Table 1. Raman Spectral analyses with the three drinking water brands (B1, B2, and B3) recorded with 633 nm filter. The observed data is qualitatively comparable to the values obtained in 488 nm (Table 3, main manuscript)
Supplementary Table 2. The percentage of difference in the observed transverse relaxation rates (R2) for the test and control samples for all three brands (B1, B2, and B3) represented as a function of varying the temperature.
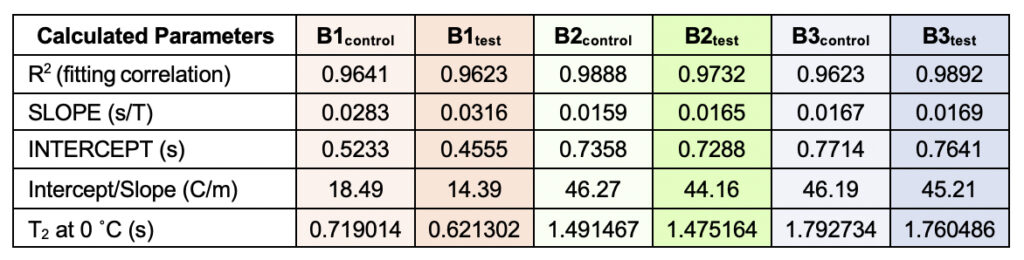
Supplementary Table 3. Theoretically calculated parameters from the linear fitting of the temperatures versus normalized T2 values (from Table 6). The values were used to obtain a quantification of the motional time-scale of water molecules for a particular sample at 0°C. The corresponding fitting correlation value (R2) is represented, serving as a parameter to indicate how good the fitting has been.
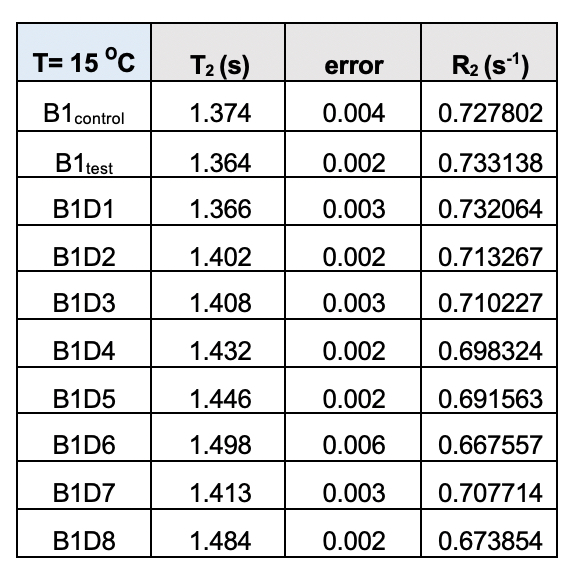
Supplementary Table 4. Transverse relaxation time (T2) for the test samples (B1) from the eight-day meditation camp collected at 15˚C. The corresponding rates (R2) follow a definite trend with values declining from day 1 (D1) to day 8 (D8)/
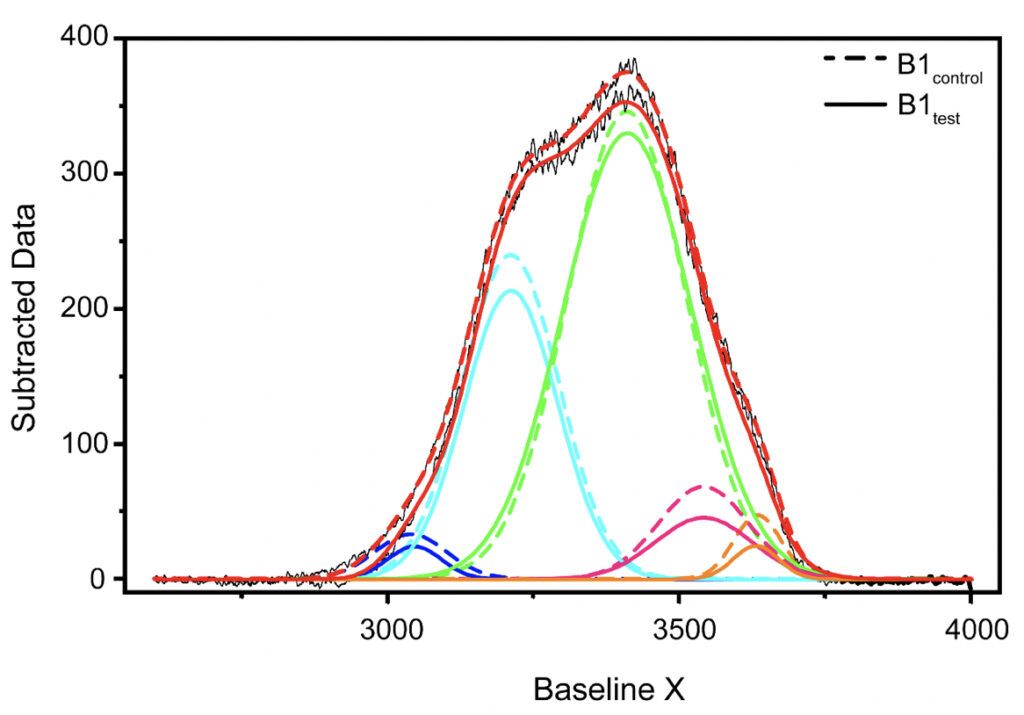
Supplementary Figure 1. Qualitative comparison between the Raman’s data obtained for B1control and B1test samples. Raman’s Spectral Range between 2600-4000 cm-1 after baseline correction was subjected to band-fitting operations. For the fitting purpose, Gaussian shaped curve function was chosen in origin program. 5 peaks were selected for band fitting: (i) around 3043 cm-1 corresponding to DAA-OH (deep blue profile), (ii) 3211 cm-1 for DDAA-OH (cyan), (iii) 3408 cm-1 for DA-OH (green), (iv) 3537 cm-1 for DDA-OH (pink), and (v) 3632 cm-1 corresponding to free OH (orange). The best fitted results were considered for further comparison. Similar profiles were obtained for all the tested water samples. The corresponding values for the area under each peak and the peak centers have been tabulated in Tables 3-5 in the main manuscript and the Supplementary Table 1.
Supplementary Figure 2. The T2 values for all the samples plotted as a function of temperature (°C) show subtle differences between the test and the control sets for the three brands (B1, B2, and B3). The corresponding intercepts provide extrapolation of the data to probe the T2 at 0°C. The bar plot in the lower panel represents the theoretical α(T) parameter calculated as the ratio of slope to intercept for the T2 (equation 1) values show slightly higher values for the test samples as opposed to the control water samples at a theoretical 0°C.
Supplementary Figure 3. The Transverse Relaxation rates (R2) for all the tested samples from either camp were comparable, as shown in Supplementary Table 3.
Supplementary Figure 4. SH-SY5Y cell viability measured using MTT for the B1 water samples- both control and test along with two mechanically treated samples: B1LM and B1HM. All the tested water samples were non-toxic as represented from mean ± SEM values for n=3 experiments.
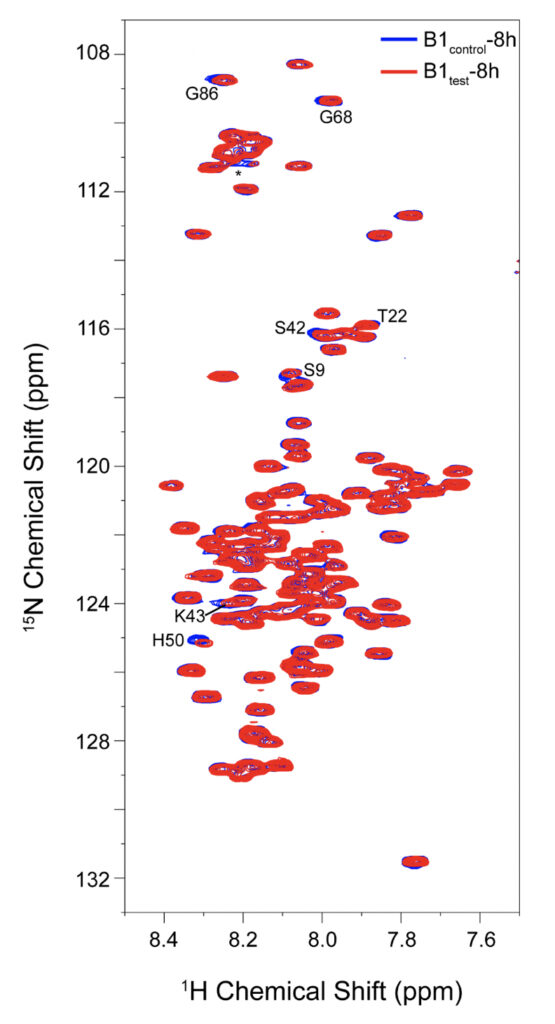
Supplementary Figure 5. 2D 1H-15N BEST TROSY spectral overlay for α-synuclein backbone residues with peak-broadening upon eight hours of incubation in B1test (red spectrum) and B1control (blue spectrum). All the spectra were recorded at 10°C to avoid rapid fibrillation in the experimental timeframe. Residues identified from the N-terminal and the central region show slightly greater reduction in their intensities upon treatment with the test sample.