
![]()
New Physicochemical Properties of Liquid Water Resulting from Recurrent Contact with Hydrophilic Polymers. Characteristics of the Resulting Supramolecular Aggregates: The Xerosydryle.
Vittorio Elia1, Elena Napoli1, Roberto Germano2, Daniele Naviglio3, Martina Ciaravolo1, Giovanni Dal Poggetto4, Domenico Caputo3, Rosario Oliva1, Tamar A. Yinnon*5
1 Department of Chemical Sciences, University ‘‘Federico II’’, Complesso Universitario di Monte Sant’Angelo, Via Cintia, I-80126 Napoli, Italy.
2 PROMETE Srl, CNR Spin off, P.le V. Tecchio, 45 80125 Napoli, Italy.
3 Department of Chemical, Material and Industrial Production Engineering,University “Federico II”, P.le V. Tecchio, 80 80125 Napoli, Italy
4 ECORICERCHE Srl, Via Principi Normanni 81043 Capua (CE), Italy
5 K. Kalia, D.N. Kikar Jordan, 90666, Israel
*Corresponding author e-mail: lwcdsrc@kalia.org.il
Keywords: Water, hydrophilic polymers, water perturbed by polymers
Published: January 23, 2022
Abstract
Recurrent contact between water and inert, insoluble, hydrophilic polymers is common in many biological and artificial systems. During the last decade, we have shown that in water perturbed by such contact, supramolecular aggregates form. On lyophilizing the water, which was left over after the polymer was removed, a solid residue remains. The data reported in this paper show that the composition of the residue differs from that of the material with which the water was perturbed. The thermal stability of the residue is extraordinary. The thermal properties and infrared spectrum of the residue depend on the material with which the water had been in recurrent contact. The residues prepared with some types of materials are gels, others are powders and still others are apparently polymers. These residues are a new class of materials: we named this solid “Xerosydryle,” from ancient Greek: Xeros (Dry) -Ydro (Water) -Yle (Matter).
1. Introduction
For many decades, it has been posited that inert, insoluble polymers do not affect bulk water. Interfacial water, resulting from the polymer surface dipoles polarizing water molecules (H2O), comprises just a few molecular layers (Noguchi et al. 2008). However, in 2006, a peculiar ~102 micrometers (µm)-wide zone was detected near hydrophilic membranes immersed in water (Zheng et al. 2006). The zone, labeled “Exclusion Zone” (EZ), expels dyes, proteins and microspheres. The properties of the EZ have been verified by independent groups (Elton et al. 2020). Fragments of EZ can detach from the polymer, as demonstrated with a phase separation technique. (Zhang et al. 2015). Seemingly, the EZ catalyzes reactions among airborne molecules, as suggested by the organic compounds forming when water flows near or through hydrophilic micro-orifices (Hasegawa et al.. 2017, Hasegawa et al. 2020).
During the last decade, our group has shown that recurrent contact between water and inert, insoluble hydrophilic polymers leads to formation of ~102 µm-sized objects (supramolecular aggregates) (Elia et al.. 2019, Elia et al. 2018, Yinnon et al. 2016, Elia et al. 2014, Elia et al. 2013, Elia et al. 2020, Elia et al. 2015). We labeled the water left over after the last contact with the polymer “iterative perturbed water” (IPW). IPWs are far-out-of equilibrium, self-organizing, dissipative systems, as the alternating minima and maxima in their year-long electric conductivity (χ) illustrates (Elia et al. 2019, Elia et al. 2015). The absolute values of these extrema may reach values that are 50-100% larger than the χ at day one. The extrema appear at intervals of about 50-100 days (Elia et al. 2019; Figure 1). The physicochemical variables, e.g., χ, density, ultra-violet (UV) absorbance, pH, heat of mixing with a base, of IPW significantly differ from those of the Milli-Q® water used for its preparation (Elia et al. 2019, Elia et al. 2018, Elia et al. 2020). For example, χ of IPW (χIPW) is 103-104 times that of χ of Milli-Q® water (χMilli-Q® water). The latter amounts to 1-2 microsiemens per centimeter (μS cm-1). The logarithm values of the physicochemical variables of IPW are linearly correlated (Elia et al. 2019, Elia et al. 2018, Elia et al. 2020), e.g., Log (χIPW) is correlated with the logarithm of the hydrodynamic radius of the objects (Elia et al. 2020). Some of the physicochemical variables of IPW depend on the type of polymer with which it was synthesized, e.g., their circular dichroism and fluorescence spectra (Elia et al. 2019, Elia et al. 2018, Elia et al. 2020).
On lyophilizing IPW, a solid residue remains (labeled RIPW) (Elia et al. 2019, Elia et al. 2018, Yinnon et al. 2016, Elia et al. 2020). The residue is soluble in water. Preliminary thermostability and Matrix-Assisted Laser Desorption/Ionization Time of Flight (MALDI-TOF) combined with Mass Spectrum (MS) data have shown that the chemical composition of RIPW prepared with cellophane (CE) or with paper filter (PF), respectively labeled RIPW-CE and RIPW-PF, differs from that of these polymers (Elia et al. 2019, Elia et al. 2020). MALDI-TOF/MS data show that RIPW-CE and RIPW-PF contain organic molecules (Elia et al. 2019, Elia et al. 2020). Preliminary analyses of RIPW-PF show that it is much richer in oxygen (O), poorer in carbon (C) and hydrogen (H) atoms than PF (Elia et al. 2019). Organic molecules are not detectable in IPW and RIPW prepared with Nafion® (N), i.e., IPW-N and RIPW-N (Yinnon et al. 2016).
Pollutants do not cause the phenomenology of IPW and RIPW, as analyses with sophisticated instruments have shown (Elia et al. 2019, Elia et al. 2018, Yinnon et al. 2016, Elia et al. 2020). Simple arguments also indicate that the phenomenology is not due to pollutants. The alternating minima and maxima of χIPW observable during storage of IPW cannot result from pollutants. The prevalence of pollutants does not rise, fall and rerise and so on. The wide variation in the pH of the various IPW also accentuates that pollution of samples by the experimentalist cannot underlie IPW phenomenologies. For example, IPW-CE is alkaline (pH≈8-9) while IPW-N is acidic (pH≈3) (Yinnon et al. 2016, Elia et al. 2020).
Comparisons between the properties of the objects in IPW, the EZ and our preliminary data on RIPW have led to the hypothesis that the objects are loosened fragments of EZ (Elia et al. 2019, Elia et al. 2018, Yinnon et al. 2016, Elia et al. 2020), i.e., RIPW is a new compound. The phenomenology of IPW, RIPW and the EZ are not explainable with the reigning models of aqueous systems (Elton et al. 2020, Elia et al. 2019, Elia et al. 2018). Still the phenomenologies of IPW, RIPW and the EZ are duplicatable (Zheng et al. 2006, Elton et al. 2020, Elia et al. 2019, Elia et al. 2018). Furthermore, the data on these systems, which have been obtained with orthodox methodologies, are statistically significant (Zheng et al. 2006, Elton et al. 2020, Elia et al. 2019, Elia et al. 2018).
The goal of this study is to show that the RIPW are a new class of materials. To attain our goal, we studied RIPW with the following methods: Fourier transform Infrared (FT-IR) spectroscopy, Differential Thermal Analyses (DTA) and Thermogravimetric (TG) Analyses.
2. Results
2.1 Characterization of Samples
During the first contacts between water and the polymer, the numerical variations of the liquid’s physicochemical variables are very small and within the experimental error. However, statistically significant variations become observable after several recurrent contacts, as specified in the “Methods” section wherein the recurrent contact methodologies used for preparing IPW are described.
We have prepared eight different types of IPW, e.g., IPW prepared with one of the following polymers: Cellophane (CE), paper filter (PF), Nafion® (N), hydrophilic cotton (HC), Crabyon (CR), sheep wool (SW), Silk (S), Cannabis (CA). We label these liquids as IPW with the addition of the shortening of the name of the polymer, e.g., IPW-CA.
Since IPW are far-from-equilibrium liquids, it is impossible to prepare samples with equal physicochemical values (Elia et al. 2019, Elia et al. 2018, Yinnon et al. 2016, Elia et al. 2015). Still, it is possible to reveal the qualitative phenomenologies of IPW prepared with the same polymer type. Since the logarithmic values of the various physicochemical variables of these IPW are linearly correlated, a single cause underlies the phenomenologies (Elia et al. 2019, Elia et al. 2018, Yinnon et al. 2016, Elia et al. 2020, Elia et al. 2015, Capolupo et al. 2014). Thus, with each polymer type, we prepared thousands of IPW samples and studied their properties until we were assured that we had discovered qualitative duplicatable phenomenologies. We characterized each sample by its χIPW value, because χ measurements are reliable, easy, rapid, non-polluting and do not destroy the sample. We labeled χIPW of an IPW prepared with a specific polymer by adding its shortening to the subscript of χIPW, e.g., χIPW-CA for IPW-CA. Analogously, the RIPW obtained by lyophilizating this IPW, we labeled RIPW-CA.
2.2 Controls
Milli-Q® water serves as a control. The insolubility in water of the polymers means that discrepancies between IPW and Milli-Q® water result from the former having recurrently contacted the polymer. Since IPW-CE, IPW-PF and IPW-N are synthesized in the same manner but with different types of polymeric sheets, these liquids constitute a type of control of each other. The same holds for IPW-HC, IPW-CR, IPW-SW, IPW-S and IPW-CA, which are all synthesized with polymeric fibers.
2.3 Determination of Pollutants in IPW and RIPW
Ion Chromatography (IC) shows that ionic pollutants are below the detection limit in IPW. Thus, ions do not bring about the high χIPW values. The detection limit of IC is ~10-1 milligram per gram (mg/g), e.g., 0.02 mg/g for fluoride ions, 0.1 mg/g for chloride ions and 0.1 mg/g for sulfate ions.
To detect organic compounds, we measured MS obtained with two different ionization modus operandi, MALDI-TOF or Gas Chromatography (GC). Each is linked to electron impact ionization. Their detection limits are, respectively, 0.1 pmol/µl and 0.5 pmol/µl. To detect biospecies, which are undetectable with MS because of ionization inefficiency, we used gel electrophoresis fractionation under denaturing conditions. The gel was stained by using Coomassie blue dye. The limit of detection is 0.25 ng/band for Coomassie stain (GelCode Blue Stain Reagent, Product # 24592). The aforementioned measurements show that IPW-CE and IPW-PF each contain molecules with masses per unit charge (m/z) of 102-103 (Elia et al. 2019, Elia et al. 2020). These large masses, together with the fact that RIPW-CE and RIPW-PF dissolve in organic polar solvents, suggest that these are organic molecules. Indeed, as mentioned further on, the FT-IR spectrum of RIPW-CE shows that it significantly absorbs radiation at frequencies that are characteristic of organic compounds. The same holds for RIPW-CA, RIPW-CE and RIPW-SW. MS did not reveal any such molecules in IPW-N (Elia et al. 2018). RIPW-N contains less than 2% of organic matter. No biological polymers such as proteins are detectable in RIPW.
2.4 pH of IPW
During synthesis of IPW, the pH of IPW-CE may reach values as high as ~8-9, (Elia et al. 2020), that of IPW-N may drop to ~3, (Yinnon et al. 2016), and that of the other IPW types may reach values of ~7-8 (Elia et al. 2018, Elia et al. 2014). For the IPW types with pH ~7, it is barely possible to neutralize the effect of carbon dioxide (CO2). The pH of Milli-Q® water is ~6.
2.5 Visualization of the Objects in IPW
Simple optical microscopy with a magnification of 500X and scanning electron microscopy (SEM) both visualize the presence of objects in IPW. Figures S1 and S2 present some exemplars of optical microscopy and SEM photographs of in air evaporated drops of various IPW types. Domains are visible, containing tinier and tinier domains within them, i.e., a typical feature of a fractal structure. Mathematical proof that the objects present in IPW have a fractal structure lies in the previously mentioned linear correlations between the physicochemical variables of IPW (Capolupo et al. 2014).
2.6 Yielding RIPW
To yield significant amounts of RIPW, we pooled in several flasks numerous IPW samples synthesized with the same piece of polymer. χIPW of the samples are ~102-104 times that of χMilli-Q® water. Once we had a collection of flasks, each containing 50-900 ml of IPW, we measured the χ of the liquid in each flask. Subsequently, we lyophilized the liquids in these flasks and weighed the resulting RIPW. The mass of RIPW may reach values of a few grams per liter of lyophilized IPW.
Figure 1 presents the mass of RIPW obtained from a liter (mg/l) of IPW as a function of the χ of the liquid in the specific flask. Figures 1a-f pertain to RIPW yielded with CA, S, HC, SW, PF or CE. Figure 1 shows that on carrying out a linear best fit of the mass of RIPW as a function of χ, the mean square deviation is close to unity. The slope of the best fit line depends on the polymer with which the RIPW is prepared. Figure 1 highlights the reproducibility of RIPW yield – the mass of RIPW depends on the properties of the IPW from which it is extracted, i.e., its χIPW, its volume and the polymer with which it is synthesized. The reproducibility implies that the IPW and RIPW phenomenologies are not related to pollutants or random errors. (Collecting the data for preparing one of the plots of Figure 1 takes many months of laboratory work.)
a. 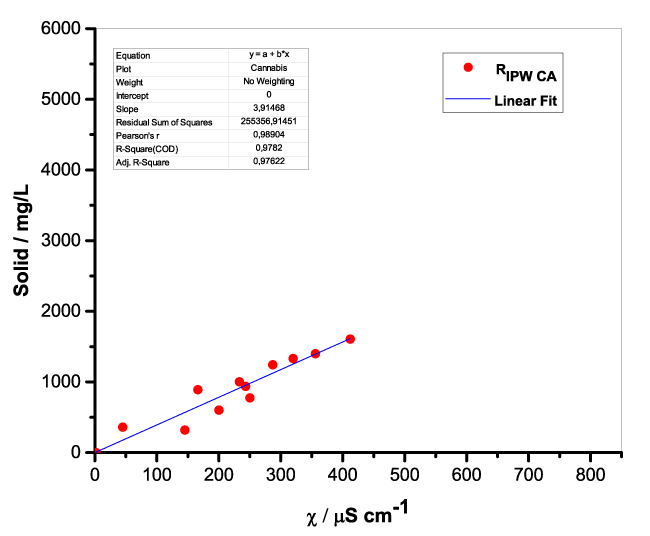 |
b. 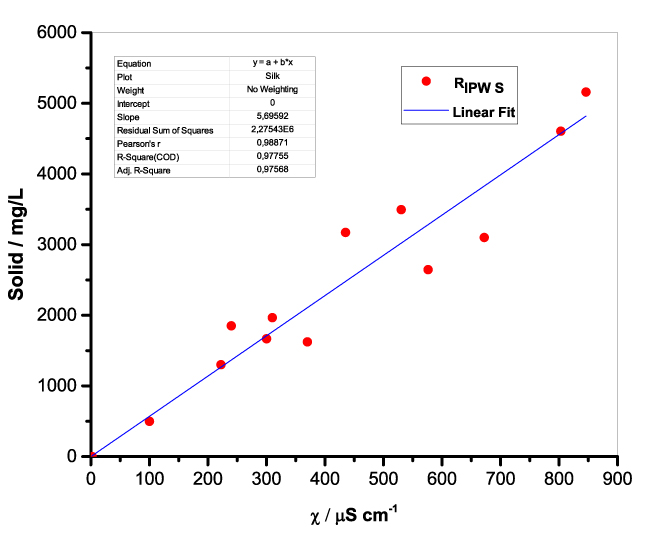 |
c. 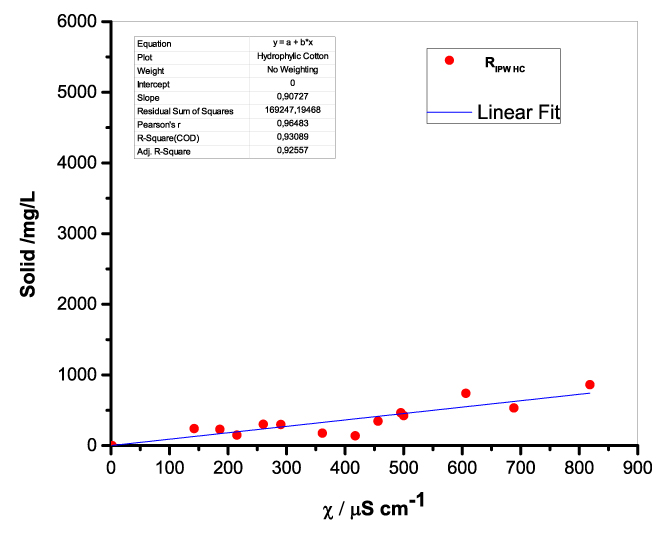 |
d. 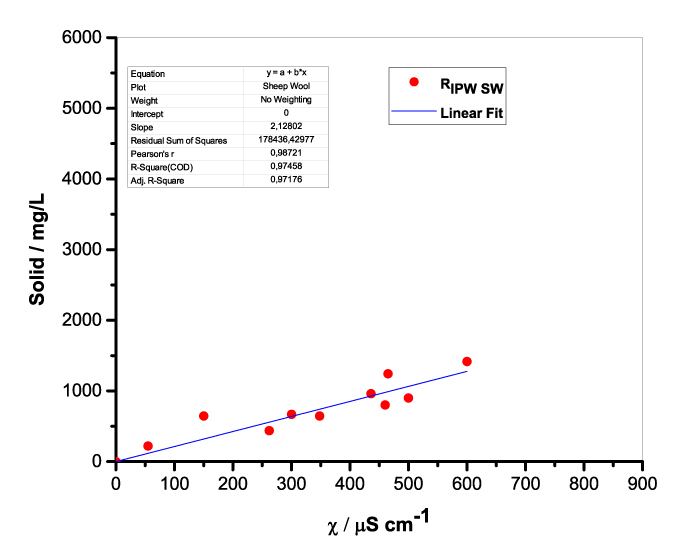 |
e. 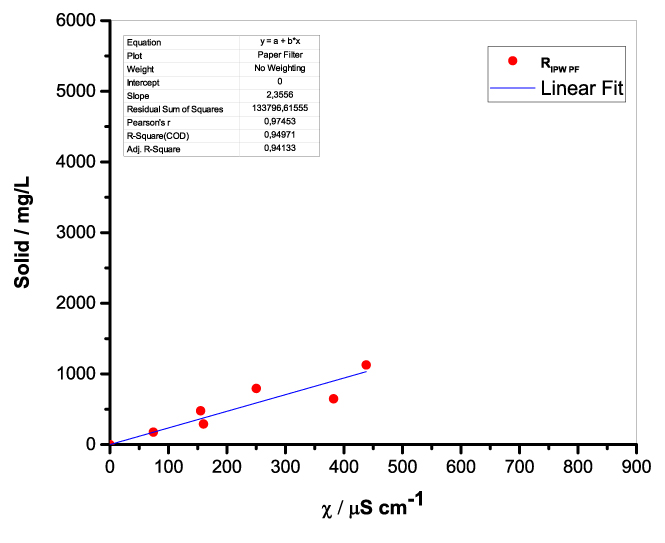 |
f. 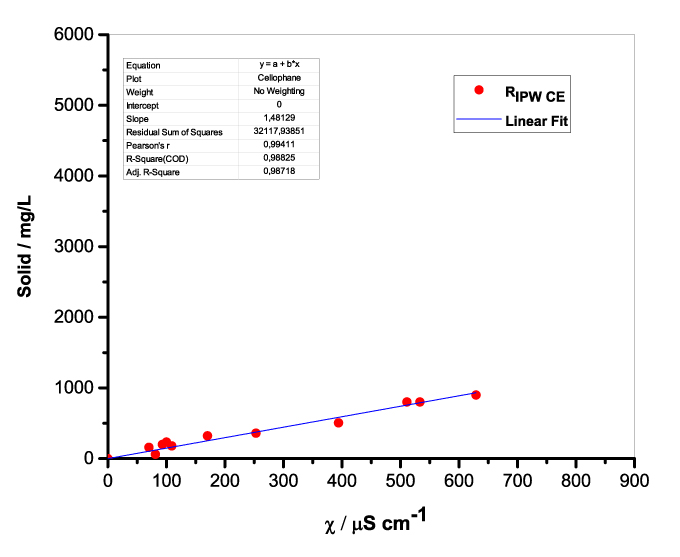 |
Figure 1. Mass of the solid (RIPW) extracted from a liter of IPW (mg/l) as a function of the χ of the IPW. Figures 1a-f pertain to RIPW synthesized with, respectively, CA, S, HC, SW, PF or CE.
2.7 Photographs of RIPW
Figure 2 presents photographs of the various RIPW types. The dissimilarities are noteworthy. RIPW-SW and RIPW-CE are brownish jelly-like polymers – see Figures 2a and b. RIPW-CA resembles a ceramic– see Figure 2c, RIPW-S, RIPW-PF and RIPW-CR are chunky off-white solids – see Figures 2d-f. RIPW-N is an off-white network-like solid – see Figure 2g. RIPW-HC is a powder – see Figure 2h.
a. 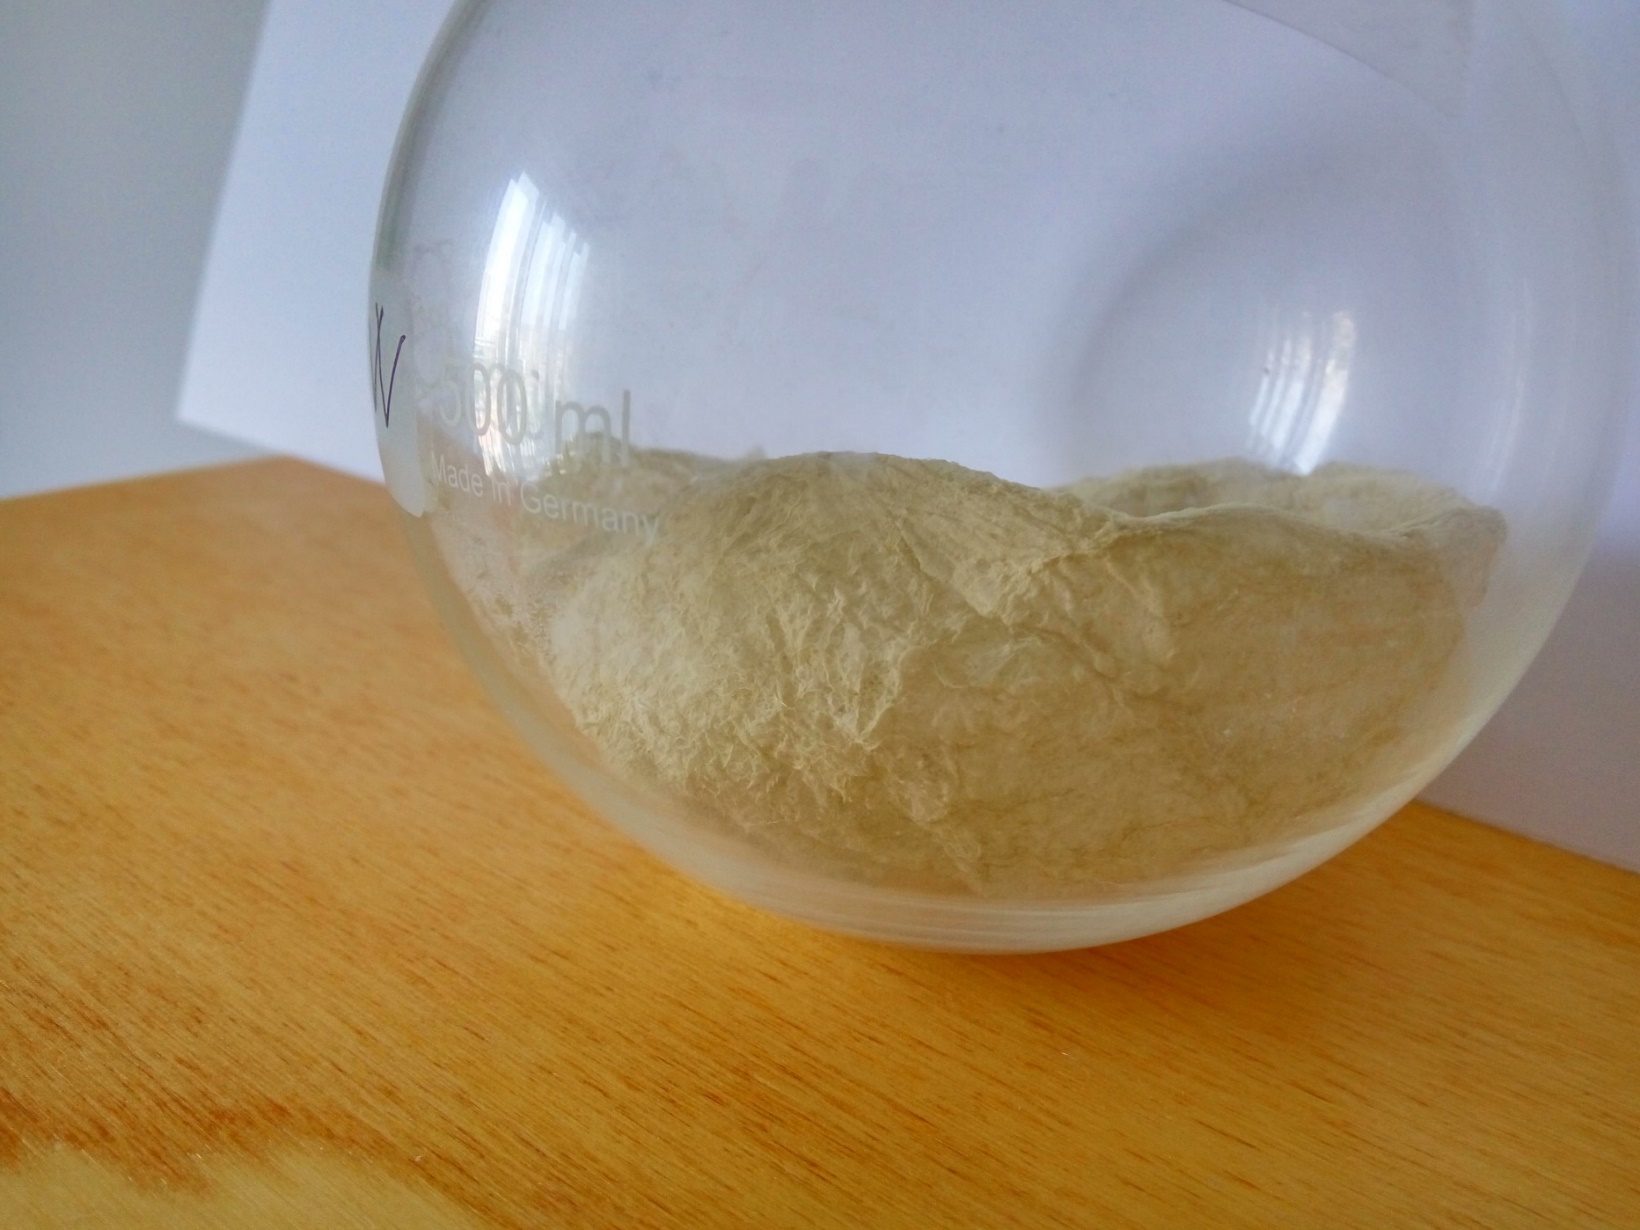 |
b. 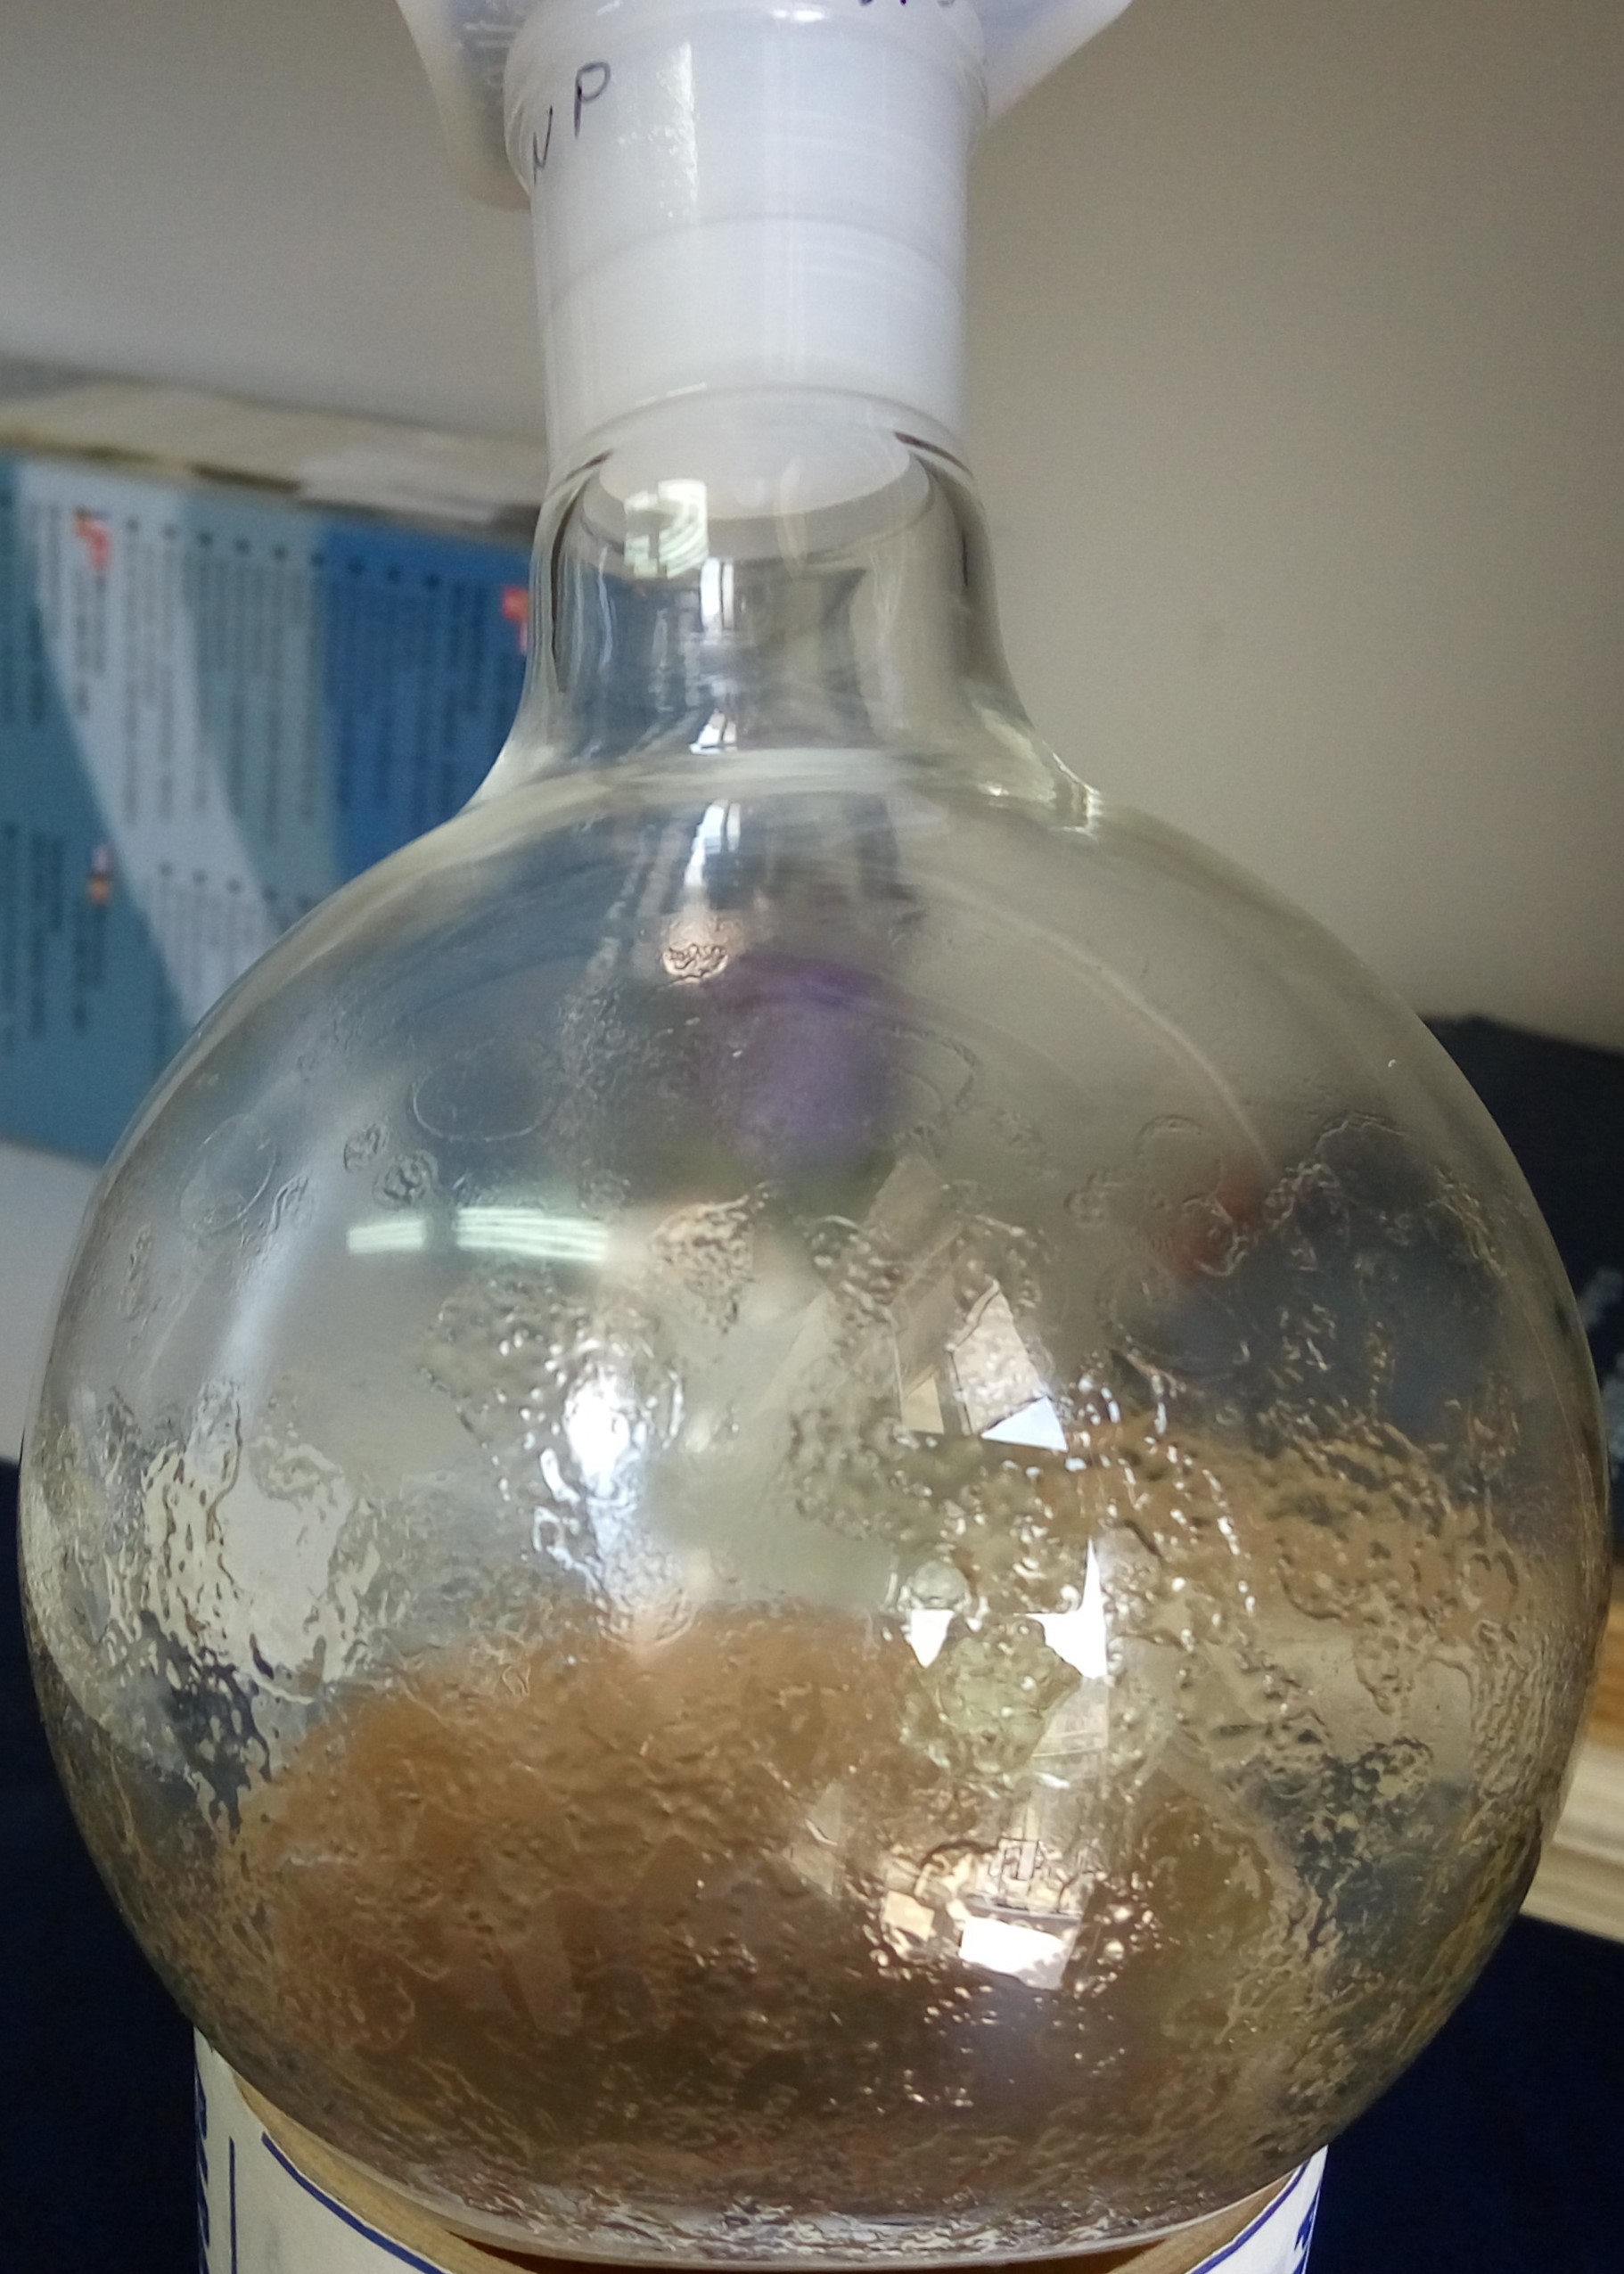 |
c. 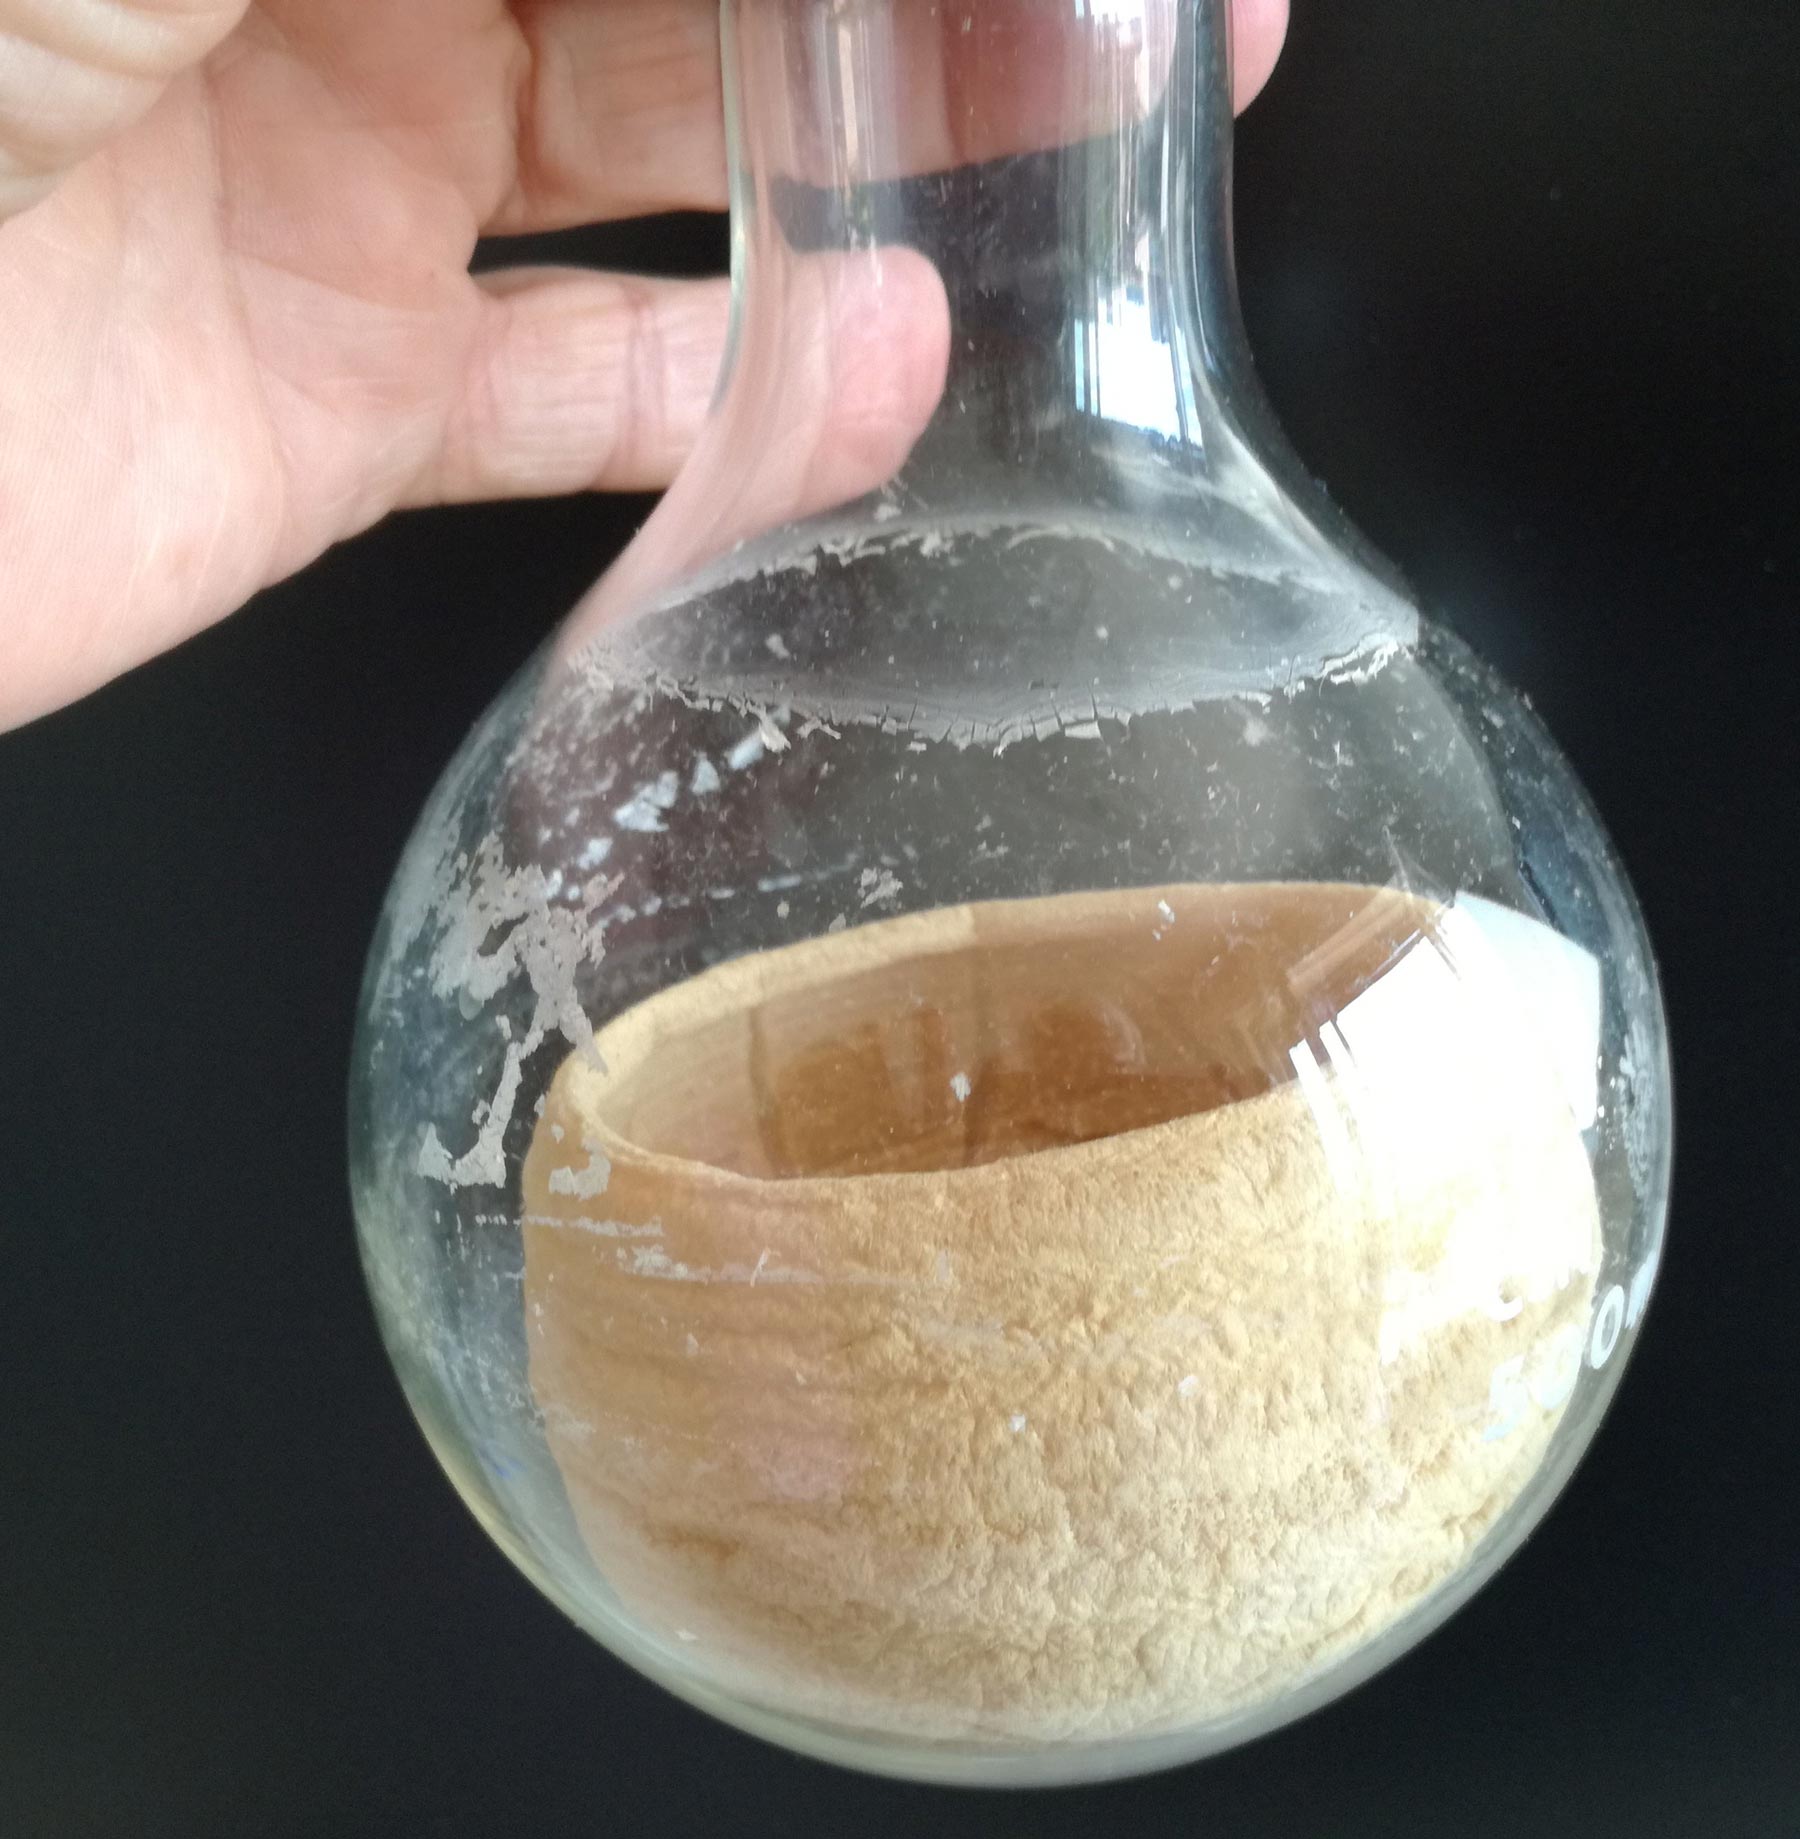 |
d. 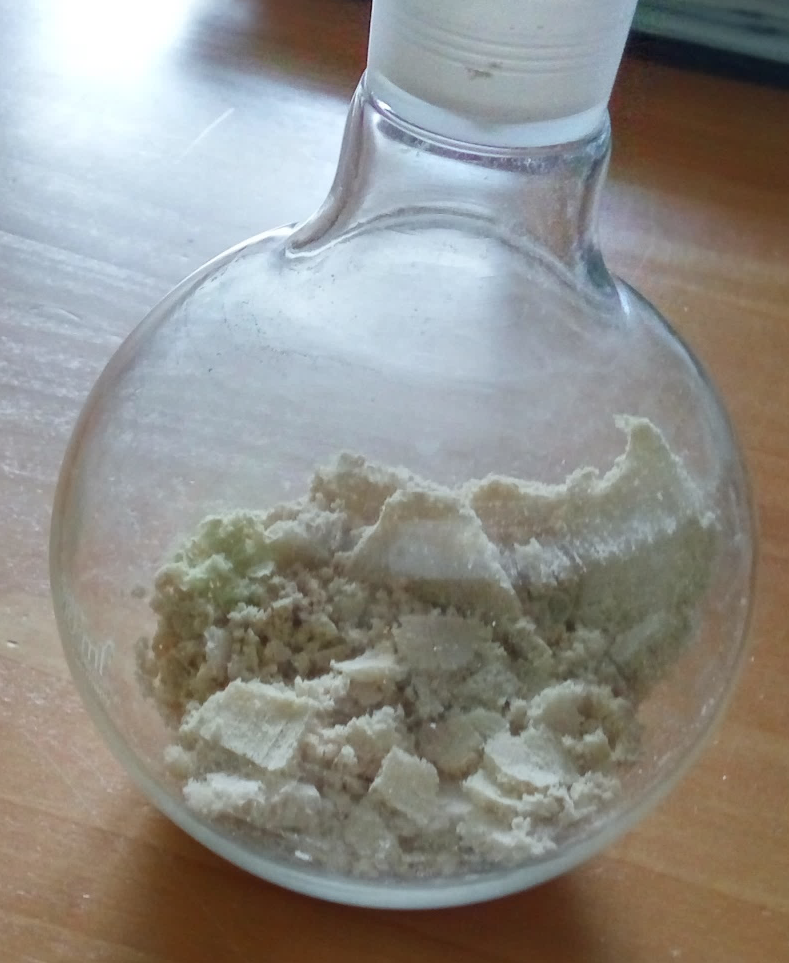 |
e. 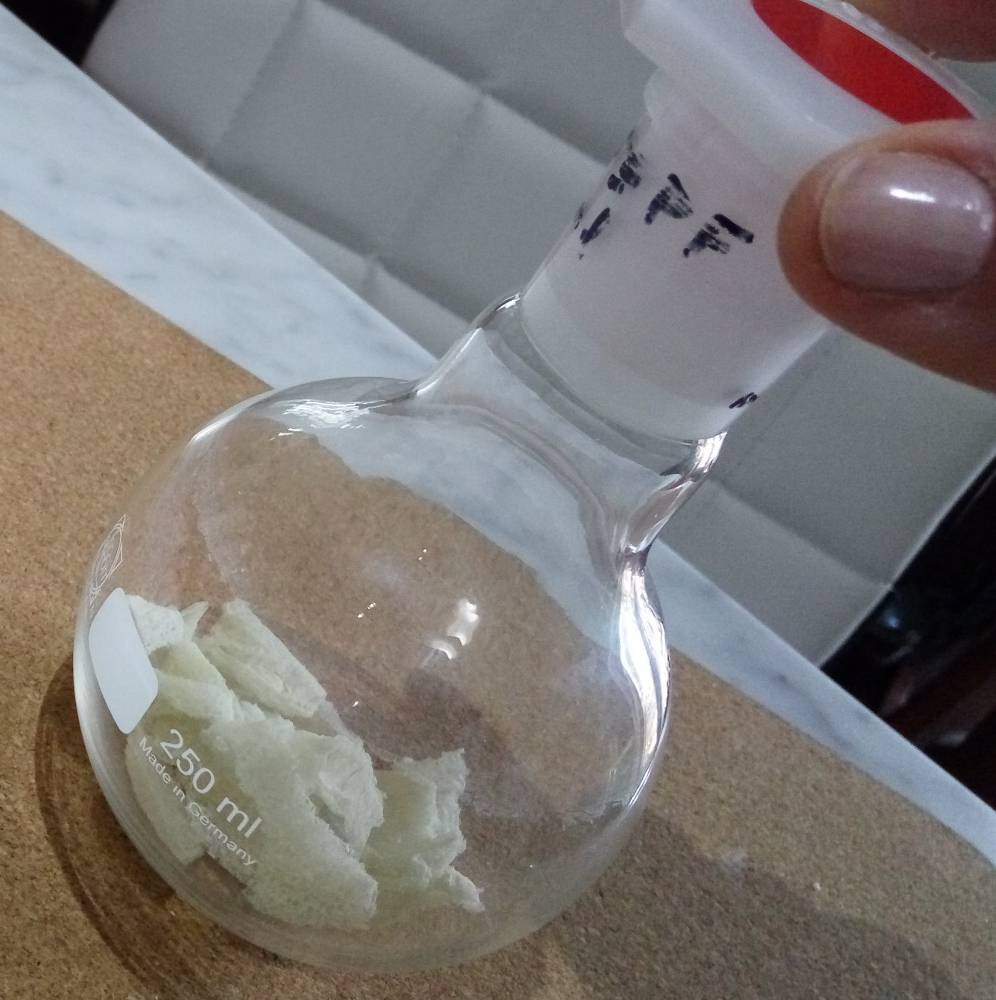 |
f. 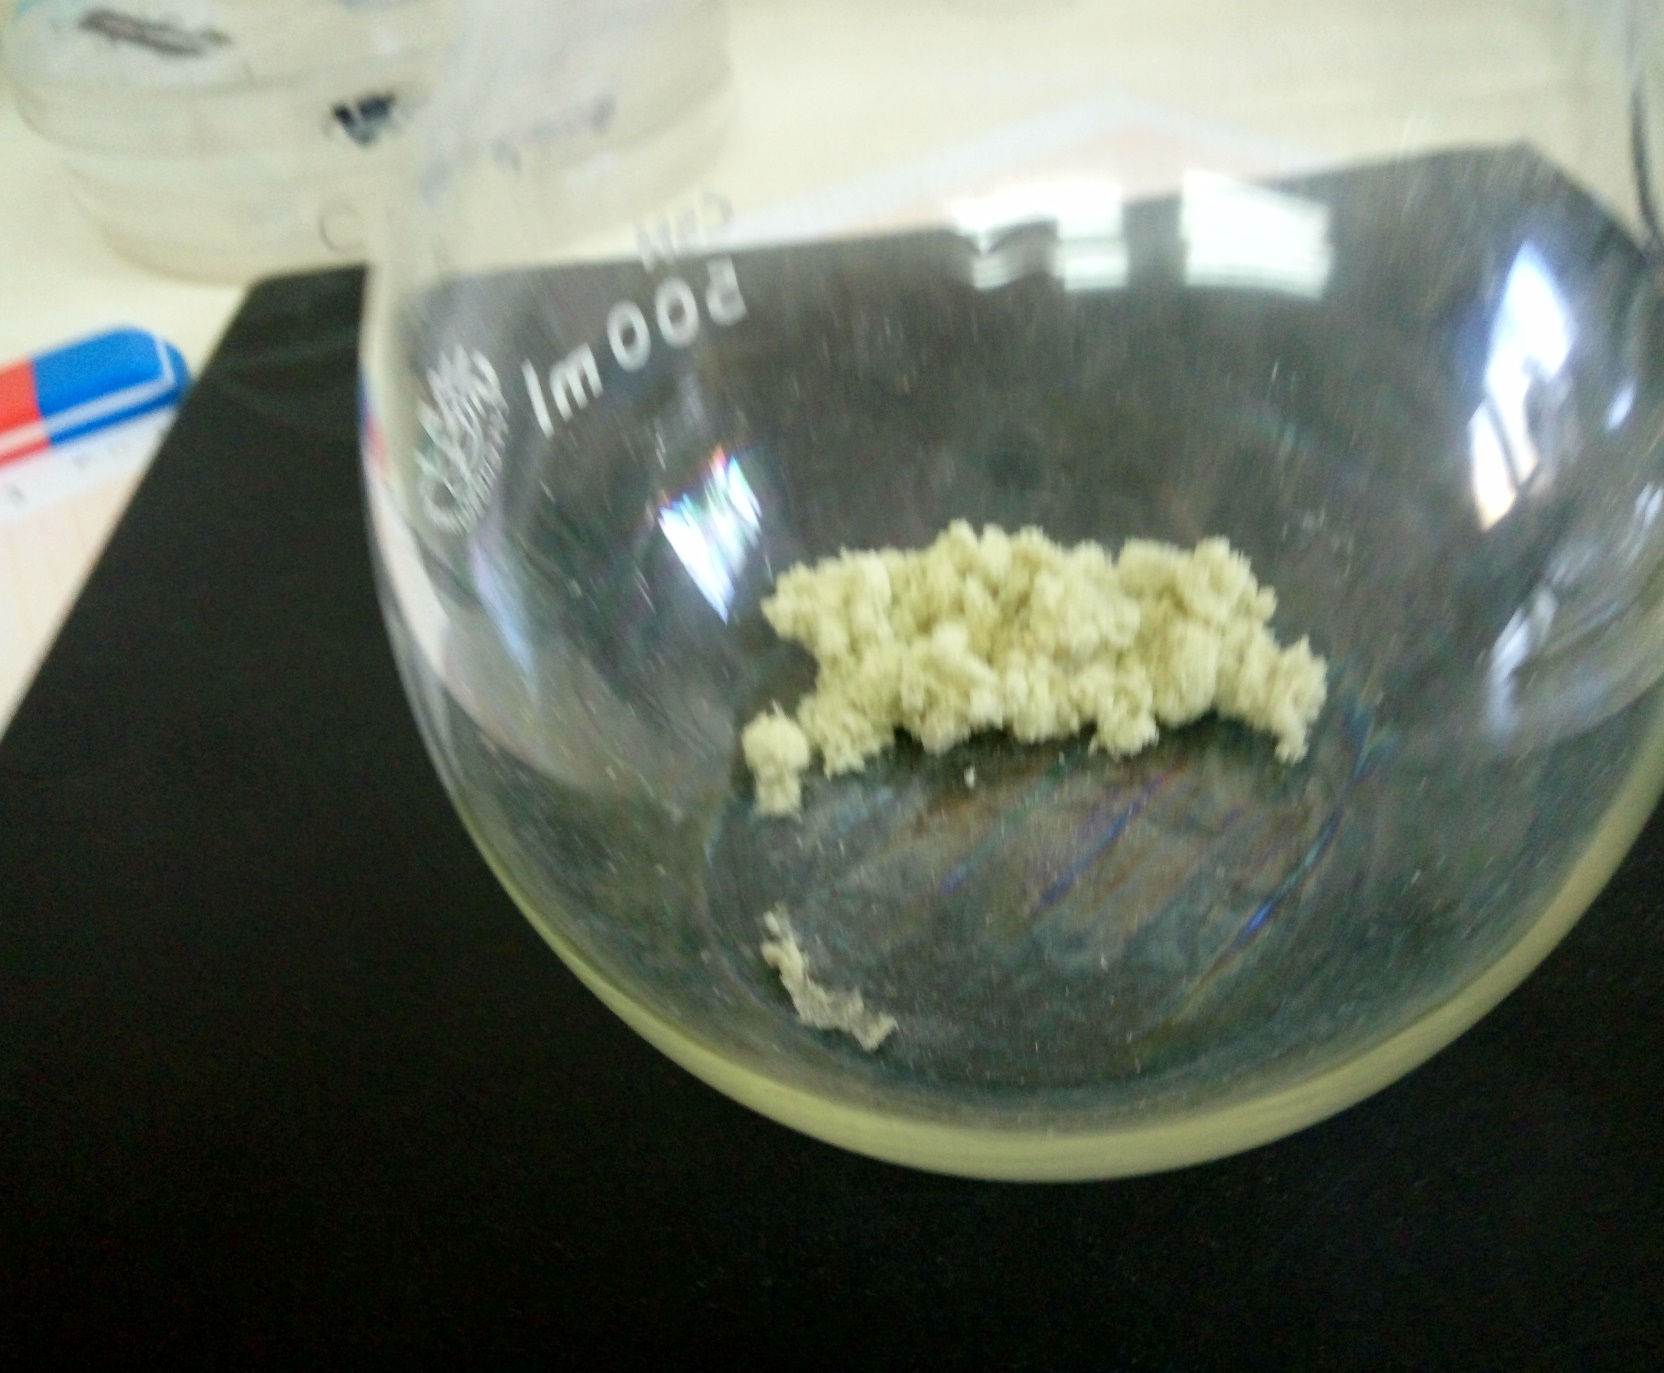 |
g. 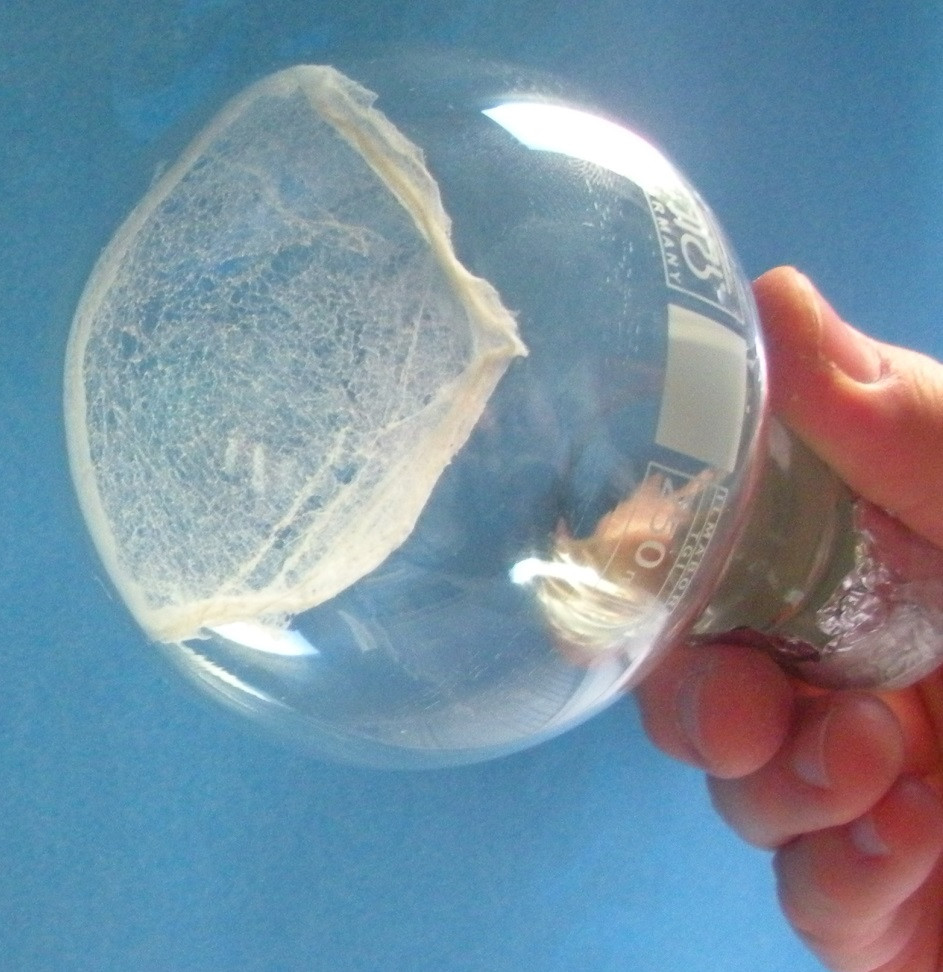 |
h. 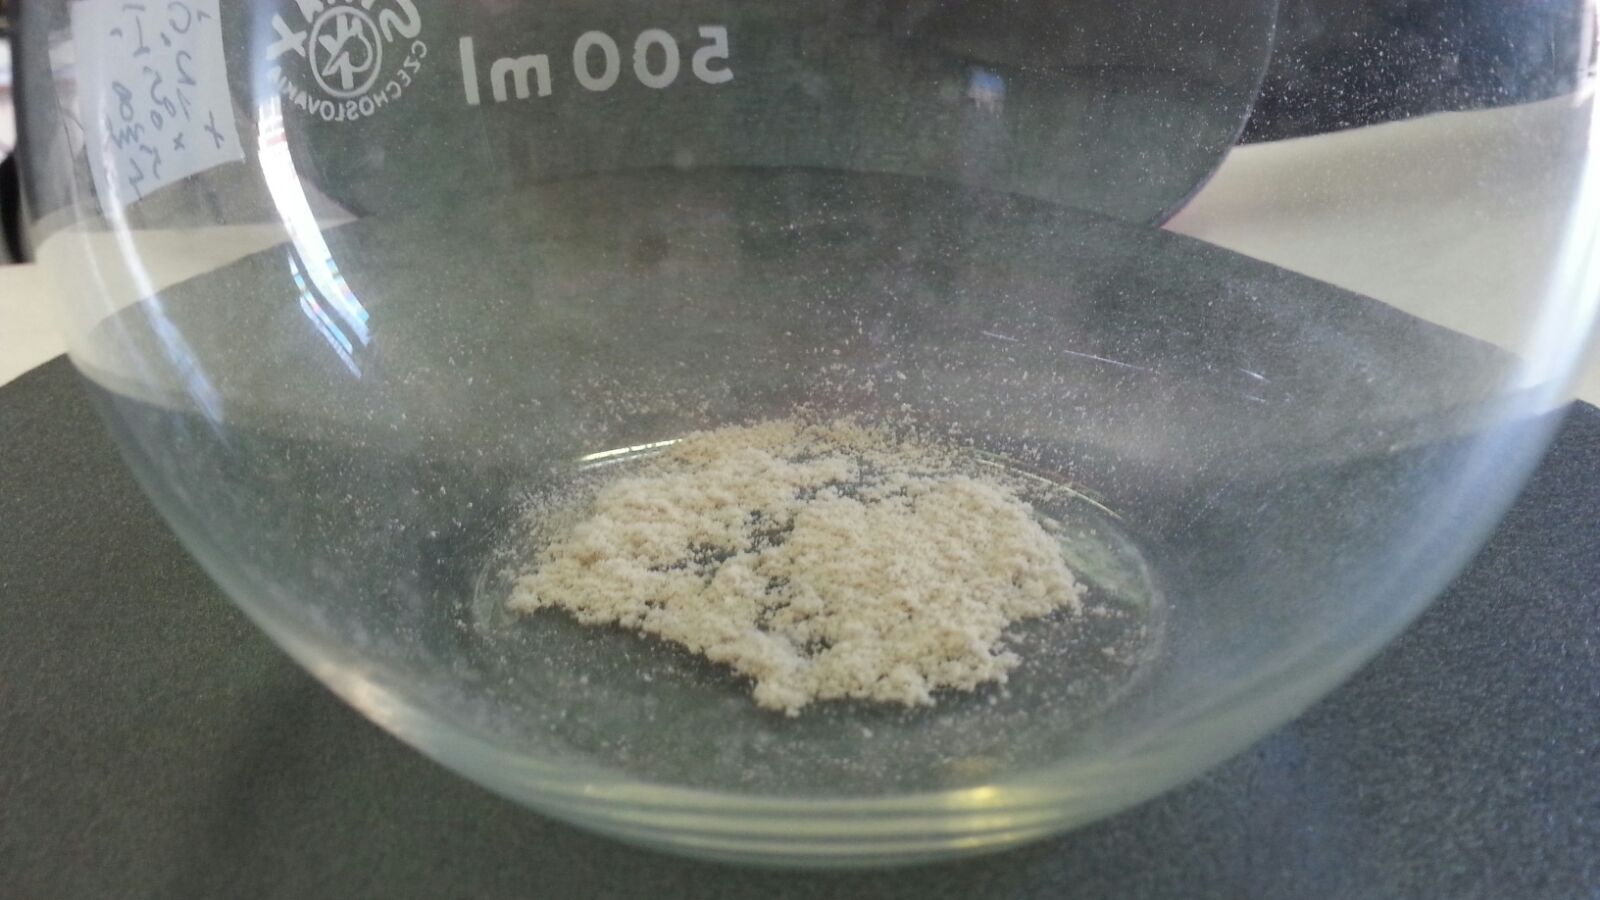 |
Figure 2. Photographs of RIPW. Figures a-h pertain to, respectively, RIPW-SW, RIPW-CE, RIPW-CA, RIPW-S, RIPW-PF, RIPW-CR, RIPW-N, RIPW-HC.
2.8 FT-IR of RIPW
Figures 3a-e present the FT-IR spectra of, respectively, RIPW-HC, RIPW-CA, RIPW-CE, RIPW-N, RIPW-SW, RIPW-S. Their spectral features in the ~3000-3800 cm-1 range are rather similar. In contrast, most of their features in the ~2400-400 cm-1 range depend on the polymer with which the RIPW is prepared.
The absorbance at ~3000-3600 cm-1 is typical of the OH-stretching vibration of H2O molecules. It is significantly red-shifted compared to the OH-stretching absorbance of unperturbed water, which has a maximum at 3298 cm-1. The red shift is indicative of ordering of H2O molecules, e.g., as in ice (De Ninno et al. 2011). The absorbance at 1633 cm-1 corresponds to the bending of H2O molecules. All the aforementioned absorbances are substantial, indicating that the lyophilization did not eliminate all H2O molecules from IPW. Indeed, GC shows that the eluted fraction of RIPW predominantly consists of H2O molecules, e.g., see the mass chromatograms in Figure S4c (Elia et al. 2018) and Figure S2 (Elia et al.2017).
Most peaks in the ~1700-400 cm-1 range and the peaks around ~2900 cm-1 are characteristic of organic compounds. Such peaks have also been observed in water flowing near or through hydrophilic micro-orifices, which have been attributed to sugars, amides, esters and C-CH bonds (Hasegawa et al. 2020).
a. 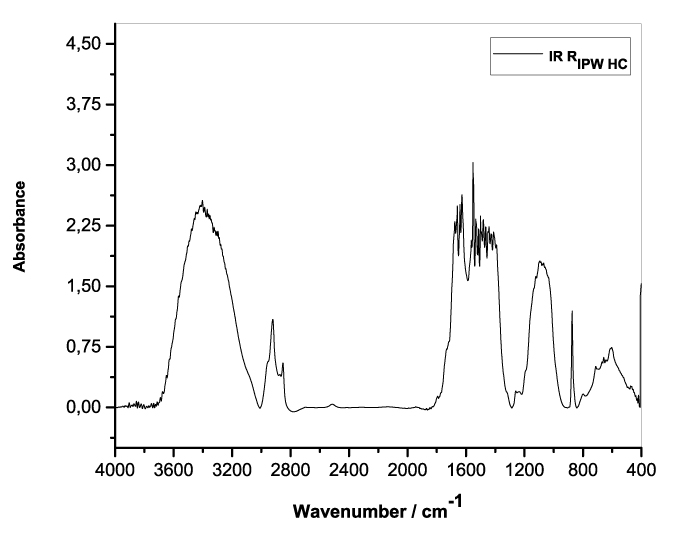 |
b. 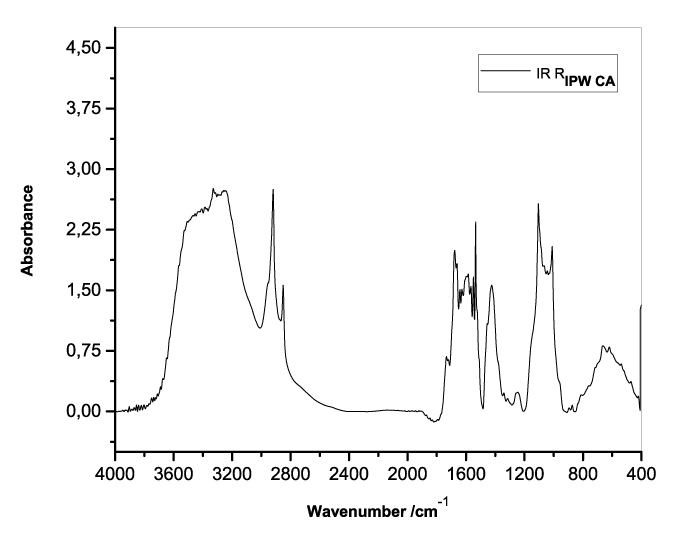 |
c. 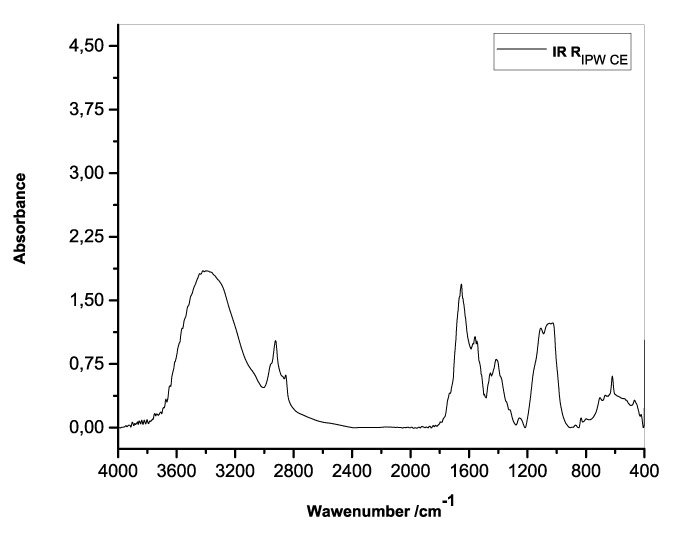 |
d. 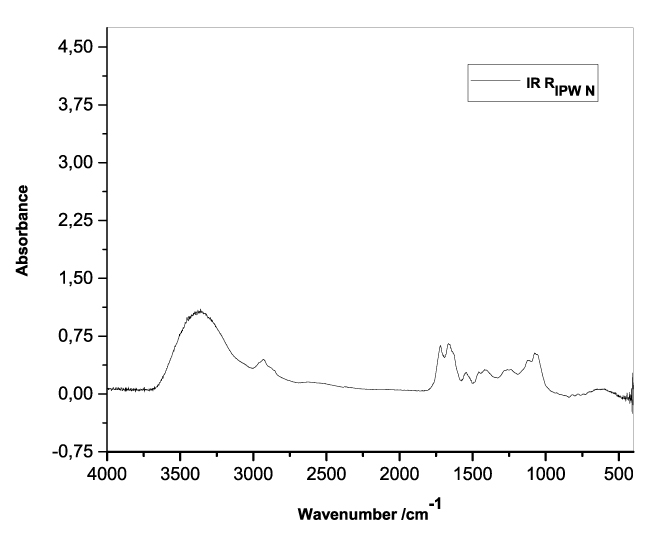 |
e. 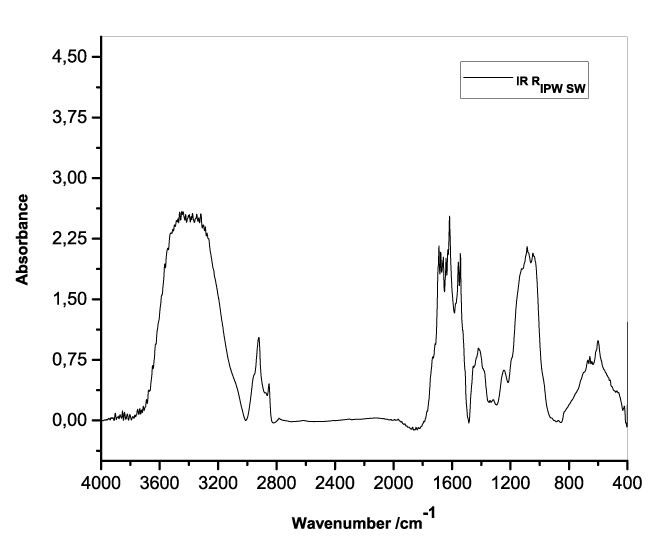 |
Figure 3. FT-IR spectra. Figures a-e pertain to the FT-IR spectrum of, respectively, a = RIPW-HC, b = RIPW-CA, c = RIPW-CE, d = RIPW-N, e = RIPW-SW – (a ÷ e = RIPW = solid Xerosydryle). The IR spectrum of liquid water (easily found in literature) is very similar to those reported here of the Xerosydryles, which refer to the solids obtained by freeze-drying (RIPW).
2.9 TG analyses and DTA of RIPW
Figures 4a-d present the TG charts of HC, CA, S, SW, RIPW-HC, RIPW-CA, RIPW-S and RIPW-SW. The TG charts of CE, PF, N, RIPW-CE, RIPW-PF and RIPW-N appear in, respectively, Elia et al. 2020, Figure 9a; Elia et al. 2019, Figure 8c, and Yinnon et al. 2016, Figure 3. The charts depict the diminution in mass as a function of temperature (T) at ambient pressure when the aforementioned materials are heated in nitrogen (N2) gas.
The TG charts show that the thermostability of all RIPW markedly diverge from that of the polymer with which these solids are synthesized. The divergences signify that their compositions are not the same, i.e., a new substance forms during the recurrent contact between water and the polymer. The divergences also mean that RIPW are not composed of bits of polymer. For all polymers, the greatest diminution (60-90%) is at ~300 oC <T<~400 oC. It is due to break up of carbon-carbon bonds.
a. 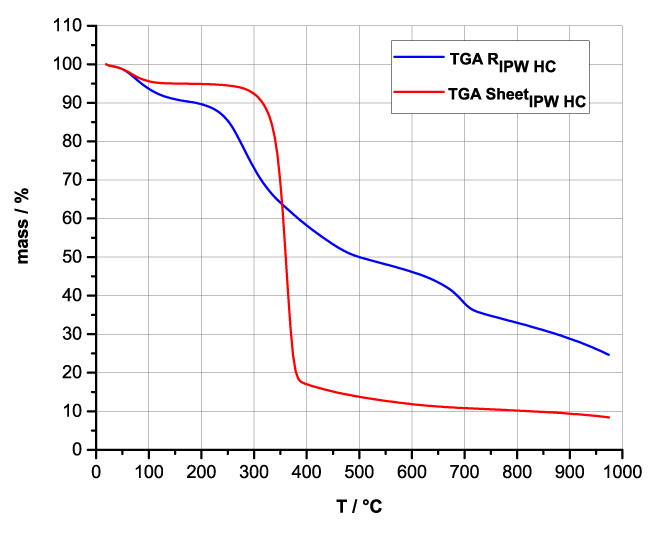 |
b. 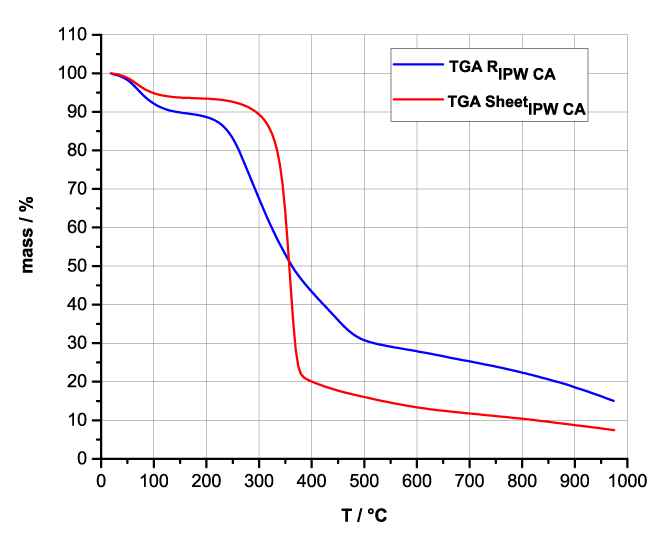 |
c. 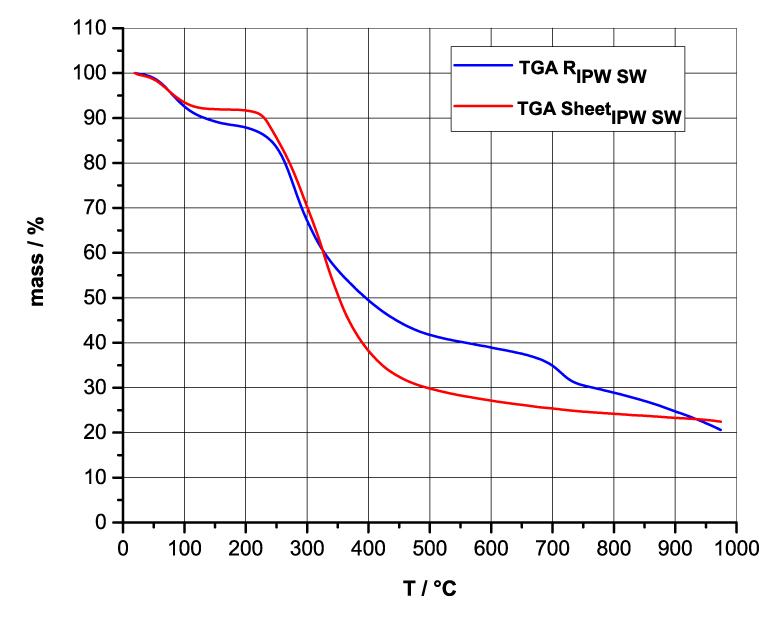 |
d. 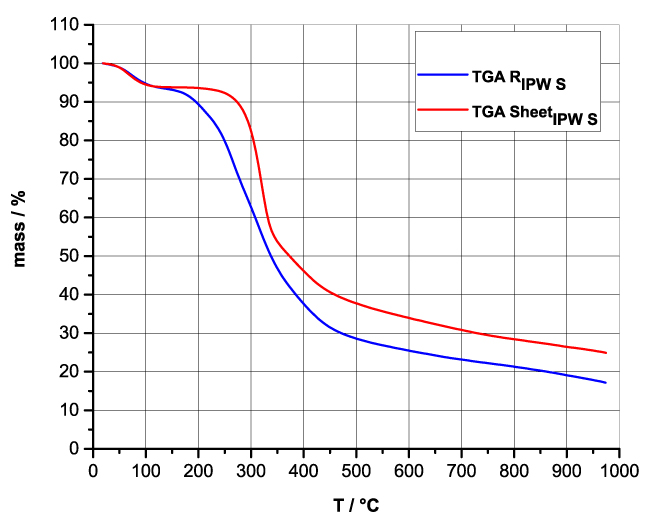 |
Figure 4 a-d. TG and DTA charts. Figures 4 a-d present the TG chart of, respectively, a = HC and RIPW-HC, b = CA and RIPW-CA, c = S and RIPW-S, d = SW and RIPW-SW.
Figures 4e-h present the DTA charts of RIPW-HC, RIPW-CA RIPW-SW and RIPW-S. Their endothermic peak with minimum at ~90oC coincides with the point at which the curvature changes sign (inflection point) at ~90 oC in the TG charts of the various RIPW and of the polymers with which these solids are synthesized. The 5-10% of mass diminution on heating up to ~90 oC is ascribable to the release of moisture.
The TG charts reveal two phases in RIPW-HC, RIPW-SW, RIPW-CE, RIPW-PF and RIPW-N. The more thermolabile phase diminishes at ~200 oC <T<~400 oC and encompasses ~30-50% of these solids. As to the more thermostable phase, only ~10% of this phase diminishes at ~400 oC<T<~700 oC. For T>~700 oC, because of the high T, the diminution in mass of RIPW is hardly measurable and hence the data are not meaningful. The extraordinary thermal resistance of the two phases to breakage of chemical bonds and their relative abundance hints that these RIPW are composed of two very different solids.
e. 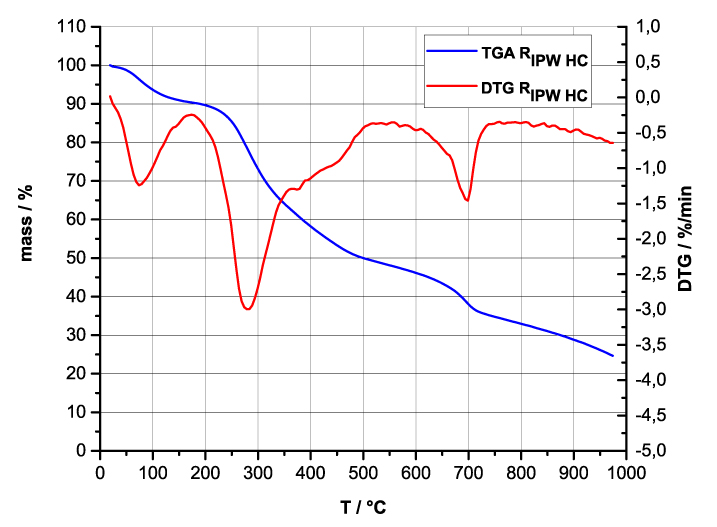 |
f. 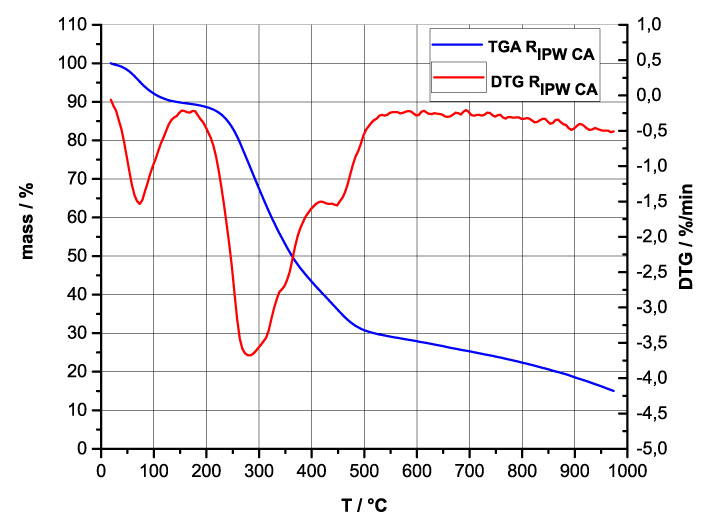 |
g. 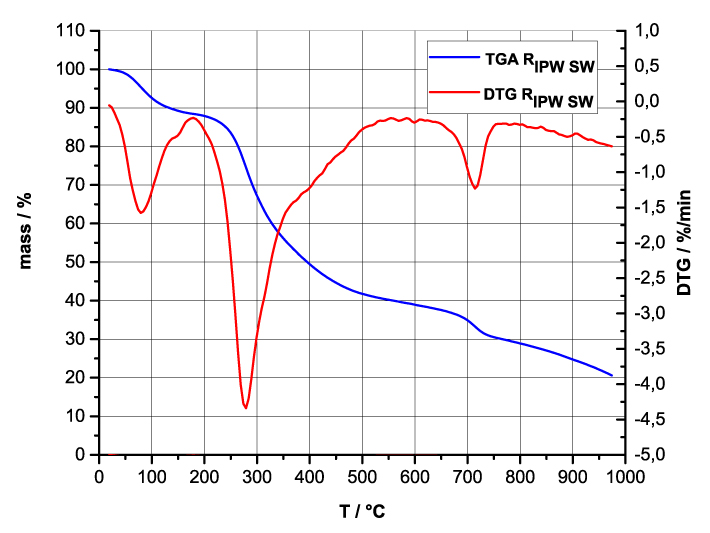 |
h. 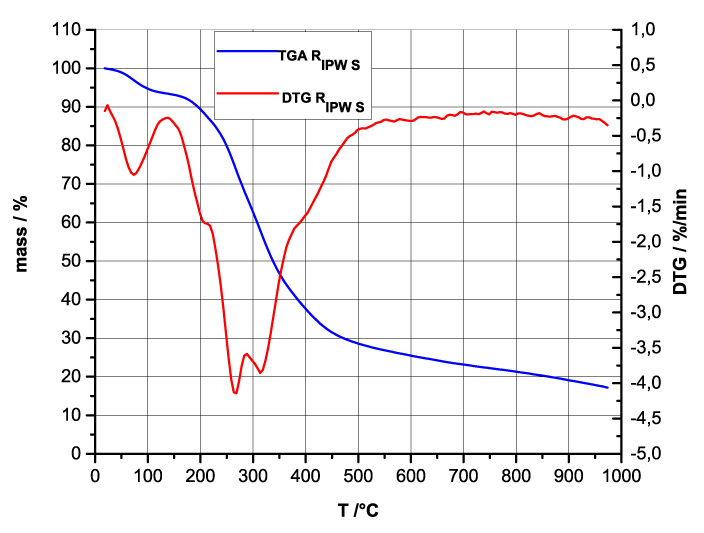 |
Figure 4 e-h. TG and DTA charts. Figures 4 e-h present the DTA (representing the 1st derivative to evidence the transitions as changes in concavity) and TG charts of, respectively, e = RIPW-HC, f = RIPW-CA, g = RIPW-SW and h = RIPW-S.
Since GC shows that the eluted fraction of RIPW predominantly consists of H2O molecules (Elia et al. 2018, Elia et al. 2017) and since the FT-IR spectra of RIPW show that features in its absorbance at ~3000-3600 cm-1 are typical of ordered H2O molecules, the TG and DTA charts indicate that RIPW consist of two types of H2O molecular orderings. The endothermic peaks of the DTA charts with minimum at ~280 0C and at ~700 oC indicate that these molecular orderings are much more stable than water hydration. The large endothermic peak with minimum at ~280 oC is probably due to desorption of H2O molecules that cannot leave IPW during its lyophilization (Elia et al. 2018, Elia et al. 2020). Dispersion interactions may bring about formation of such domains, e.g., in EZ water (Yinnon et al. 2016, De Ninno et al. 2011, Del Giudice et al. 2013, De Ninno et al. 2017). The endothermic peak at ~700 oC likely is due to desorption of ferroelectrically ordered H2O molecules. Classical and quantum physics show for T < 887 oC and pressures of ~1 Atmospheres, ~102 µm-sized domains composed of ferroelectrically ordered H2O molecules may stabilize under certain conditions, e.g., in EZ water (Yinnon et al. 2016, Del Giudice et al. 2013, Sivasubramanian et al. 2015, Del Giudice et al. 1988).
3. Discussion and Conclusions
Our GC and FT-IR data indicate that RIPW predominantly consist of H2O molecules. Accordingly, we name this new aqueous compound “Xerosydryle.” The name is based on ancient Greek: Xeros (Dry)-Ydro (Water)-Yle (Matter).
Xerosydryle’s phenomenologies hitherto are not explainable with the reigning theories. The same holds for the other outcomes of contact between water and an assortment of inert, insoluble, hydrophilic polymers, e.g., the EZ or IPW phenomenologies, or the generation of organic compounds when water flows near or through hydrophilic micro-orifices (Zheng et al. 2006, Elton et al. 2020, Zhang et al. 2015, Hasegawa et al. 2017, Hasegawa et al. 2020, Elia et al. 2019, Elia et al. 2018, Yinnon et al. 2016, Elia et al. 2014, Elia et al. 2013, Elia et al. 2020, Elia et al. 2015). The EZ, discovered in 2006, has been studied by many researchers (Zheng et al. 2006, Elton et al. 2020). However, the forwarded models have not been validated by adequate experimental data (Elton et al. 2020). Electrodynamic interactions seemingly play important roles in steadying the EZ, because its width is reversibly affected by ambient electromagnetic radiation (Chai et al. 2009). The widening of the EZ by ~300-700% depends on the wavelength of the IR, visible or UV radiation. The effect of the electromagnetic energy is non-thermal (Chai et al. 2009). Unconventional models of water, which explicitly describe electrodynamic interactions (van der Waals dispersion forces or Clausius–Mossotti polarization), have been forwarded for explaining EZ phenomenologies (Elton et al. 2020, Yinnon et al. 2016, De Ninno et al. 2017, Del Giudice et al. 2013). These models have also been forwarded for explaining IPW phenomenologies (Zhang et al. 2015, Elia et al. 2018, Yinnon et al. 2016).
The peculiar outcomes of the contact between water and inert, insoluble hydrophilic polymers, together with the unconventional models needed for their rationalization, breed skepticism. The apt ripostes are that the outcomes are duplicatable, their related data are statistically significant, the data have been obtained with many diverse conventional scientific methodologies and some outcomes have already been confirmed by independent researchers (Elton et al. 2020, Elia et al. 2019, Elia et al. 2018, Yinnon et al. 2016, Elia et al. 2014a, Elia et al. 2013a, Elia et al. 2020, Elia et al. 2015, Del Giudice et al. 2006, Elia et al. 2011). In yet another attempt to convince that the outcomes are not due to pollutants, we recall that a pH of ~3 exists in the water bordering on the EZ stabilized by a Nafion® sheet and the pH of IPW-N also is ~3 (Zheng et al. 2006, Elia et al. 2013). Moreover, the pH of IPW is linearily correlated with log (χIPW) and χIPW may reach values as high as 3000 µS cm-1. To make an aqueous solution with such a high χ value, one needs to add about 3 grams of electrolytes to a liter of water. Our IC measurements show that IPW do not contain such large amounts of electrolytes.
Xerosydryle has plenteous implications for technology, industry, and applied and basic science. Firstly, many implications stem from our research pointing to its spontaneous formation in common artificial and natural systems. For example, in industrial closed pure water circuits, formation of Xerosydryle may prevent the ability to keep the circuits “clean.” Industrial slurries are present in many productive processes, and there Xerosydryle certainly forms (as our yet to be published data show). Seemingly, we need to become aware of Xerosydryle, just as mankind had to become aware of atmospheric pressure: it is everywhere, but only discovered by E. Torricelli in the 17th century.
Secondly, our findings indicate that Xerosydryle is a versatile material. Its thermostability, conceivably easy automatization of its fabrication, the cheapness of the raw materials required for its fabrication (water and reusable polymers) and its diverse forms (jelly-like polymer, powders, solid chunks, ceramic-like solids or network-like solids), all point toward its potential in technological and industrial applications.
Thirdly, Xerosydryle has implications for basic and applied research. Evaporation of water, which has been in recurrent contact with inert insoluble hydrophilic polymers, is common in natural and technological systems. Likely, at least some miniscule amounts of Xerosydryle are present in such systems and affect their properties. It might play yet unrecognized roles in such systems.
A major limitation of our study is that it provides little information about the chemical composition of Xerosydryle. Also, our data do not elucidate the ordering of its H2O molecules. Xerosydryle is soluble in water and in organic solvents. However, we have not yet gathered information on its reactivity with other chemicals. As such, our study calls for much additional research.
4. Materials and Methods
The experimental scheme and the next methods are the same as those specified in Elia et al. (2018): electric conductivity, pH, Ion Chromatography (IC), (Matrix-Assisted Laser Desorption/Ionization – Time of Flight) MALDI-TOF spectrometry coupled with MS (mass spectrometry), GS (gas chromatography) coupled with MS (mass spectrometry), Gel electrophoresis, optical microscopy. The next methods are the same as those specified in Elia et al. (2018) and Elia et al. (2020): lyophilization and TG (thermogravimetric) analyses.
4.1 Materials
CE – We use cellophane films with varying thinness, but with the same chemical composition: Innovia Film – Natureflex 21NP, 23 NP, 28NP, 31NP, 35NP and 42NP. Usage of the various films does not result in IPW with statistically significant disparity of its physicochemical properties.
PF – We use Carlo Erba (code: 289200123), 12 cm-wide, round filters.
N – We use 60–120 cm2, 50–180 µm-thin Nafion® films.
HC, S, CR, SW, CA – We use commercial materials, with specifications that these are 100% pure.
We assessed the incidence of inorganic pollutants in the polymers by incinerating these in an alkaline substance, dissolving the calcined specimen in nitric acid and analyzing the resulting solution with IC, as specified in Elia et al. (2018), Section 5.3.8. In all polymer types, no such pollutants are detectable.
4.2 Methods
4.2.1 Synthesis of IPW with CR, SW, S, CE, PF, HC, CA or N
We rinsed a polymer five times in 20 ml Milli-Q® water. We dried the polymer in air. We submerged the polymer in 10 – 50 ml Milli-Q® water. The water was contained in a bowl that is not made of a hydrophilic material, e.g., a Petri dish, polystyrene or plastic bowl. In the case of a sheet-shaped polymer (CE, PF, N), we mechanically, manually or with a magnet, stirred the fluid. We only lightly stirred the fluid so that 2 – 3 mm of it rippled against the sheet. In the case of a fiber polymer (CA, S, SW, CR, HC), after ~15-30 minutes we mildly squeezed it with our polyethylene gloved hand. We took 1 ml of the fluid, measured its χ and put the fluid back in the bowl. We gently moved the polymer. We repeated this sequence of stirring 20-50 times (or after each ~15-30 minutes squeezing), χ measurements and moving of the polymer. We took out the polymer and dried it in air. After ~12 hours, we put the polymer back in the bowl. We repeated tens of times this series of polymer submergence, stirring (squeezing), moving the polymer, drying the polymer and χ measurement of the fluid. χ increases after each series. The recurrent contacts required for obtaining statistically significant variations in χ, i.e., variations beyond the experimental error, depend on the amount of the fluid and the amount of polymer employed. For example, for a water/SW (in grams) ratio of ~41: after the first recurrent contact series, χ=22 μS cm-1; after the day 2 series, χ=46 μS cm-1; after the day 3 series, χ=76 μS cm-1; after the day 4 series, χ=116 μS cm-1; after the day 5 series, χ=131 μS cm-1. The fluid left in the bowl after the last polymer removal step, we labeled IPW.
4.2.2 SEM of IPW
We obtained images with the SEM – EDX FEI – Ispect S, Column E-SEM W. Source: 200V – 30 kV. Filament: tungsten. Microanalysis. EDAX.
4.2.3 FT-IR
We record IR spectra of RIPW in a KCl dispersion medium, using an FT-IR Jasco-FT-IR-430 spectrophotometer. The recording conditions for each FT-IR spectrum were: 64 scans, scanning speed of 2 mm/sec, a triangular apodization function and a resolution of 2 cm-1.
4.2.4 Differential Thermal Analyses (DTA)
We did the DTA analyses with a Netzsch thermoanalyzer model STA 409 Luxx. We weighed samples of about 10 mg. We heated the samples on alumina pans from 25 to 950 °C. The heat rate was 20 K/min. We heated the samples in air or in a N2 flow. We used α-Al2O3 as a reference material.
Supplementary
a. 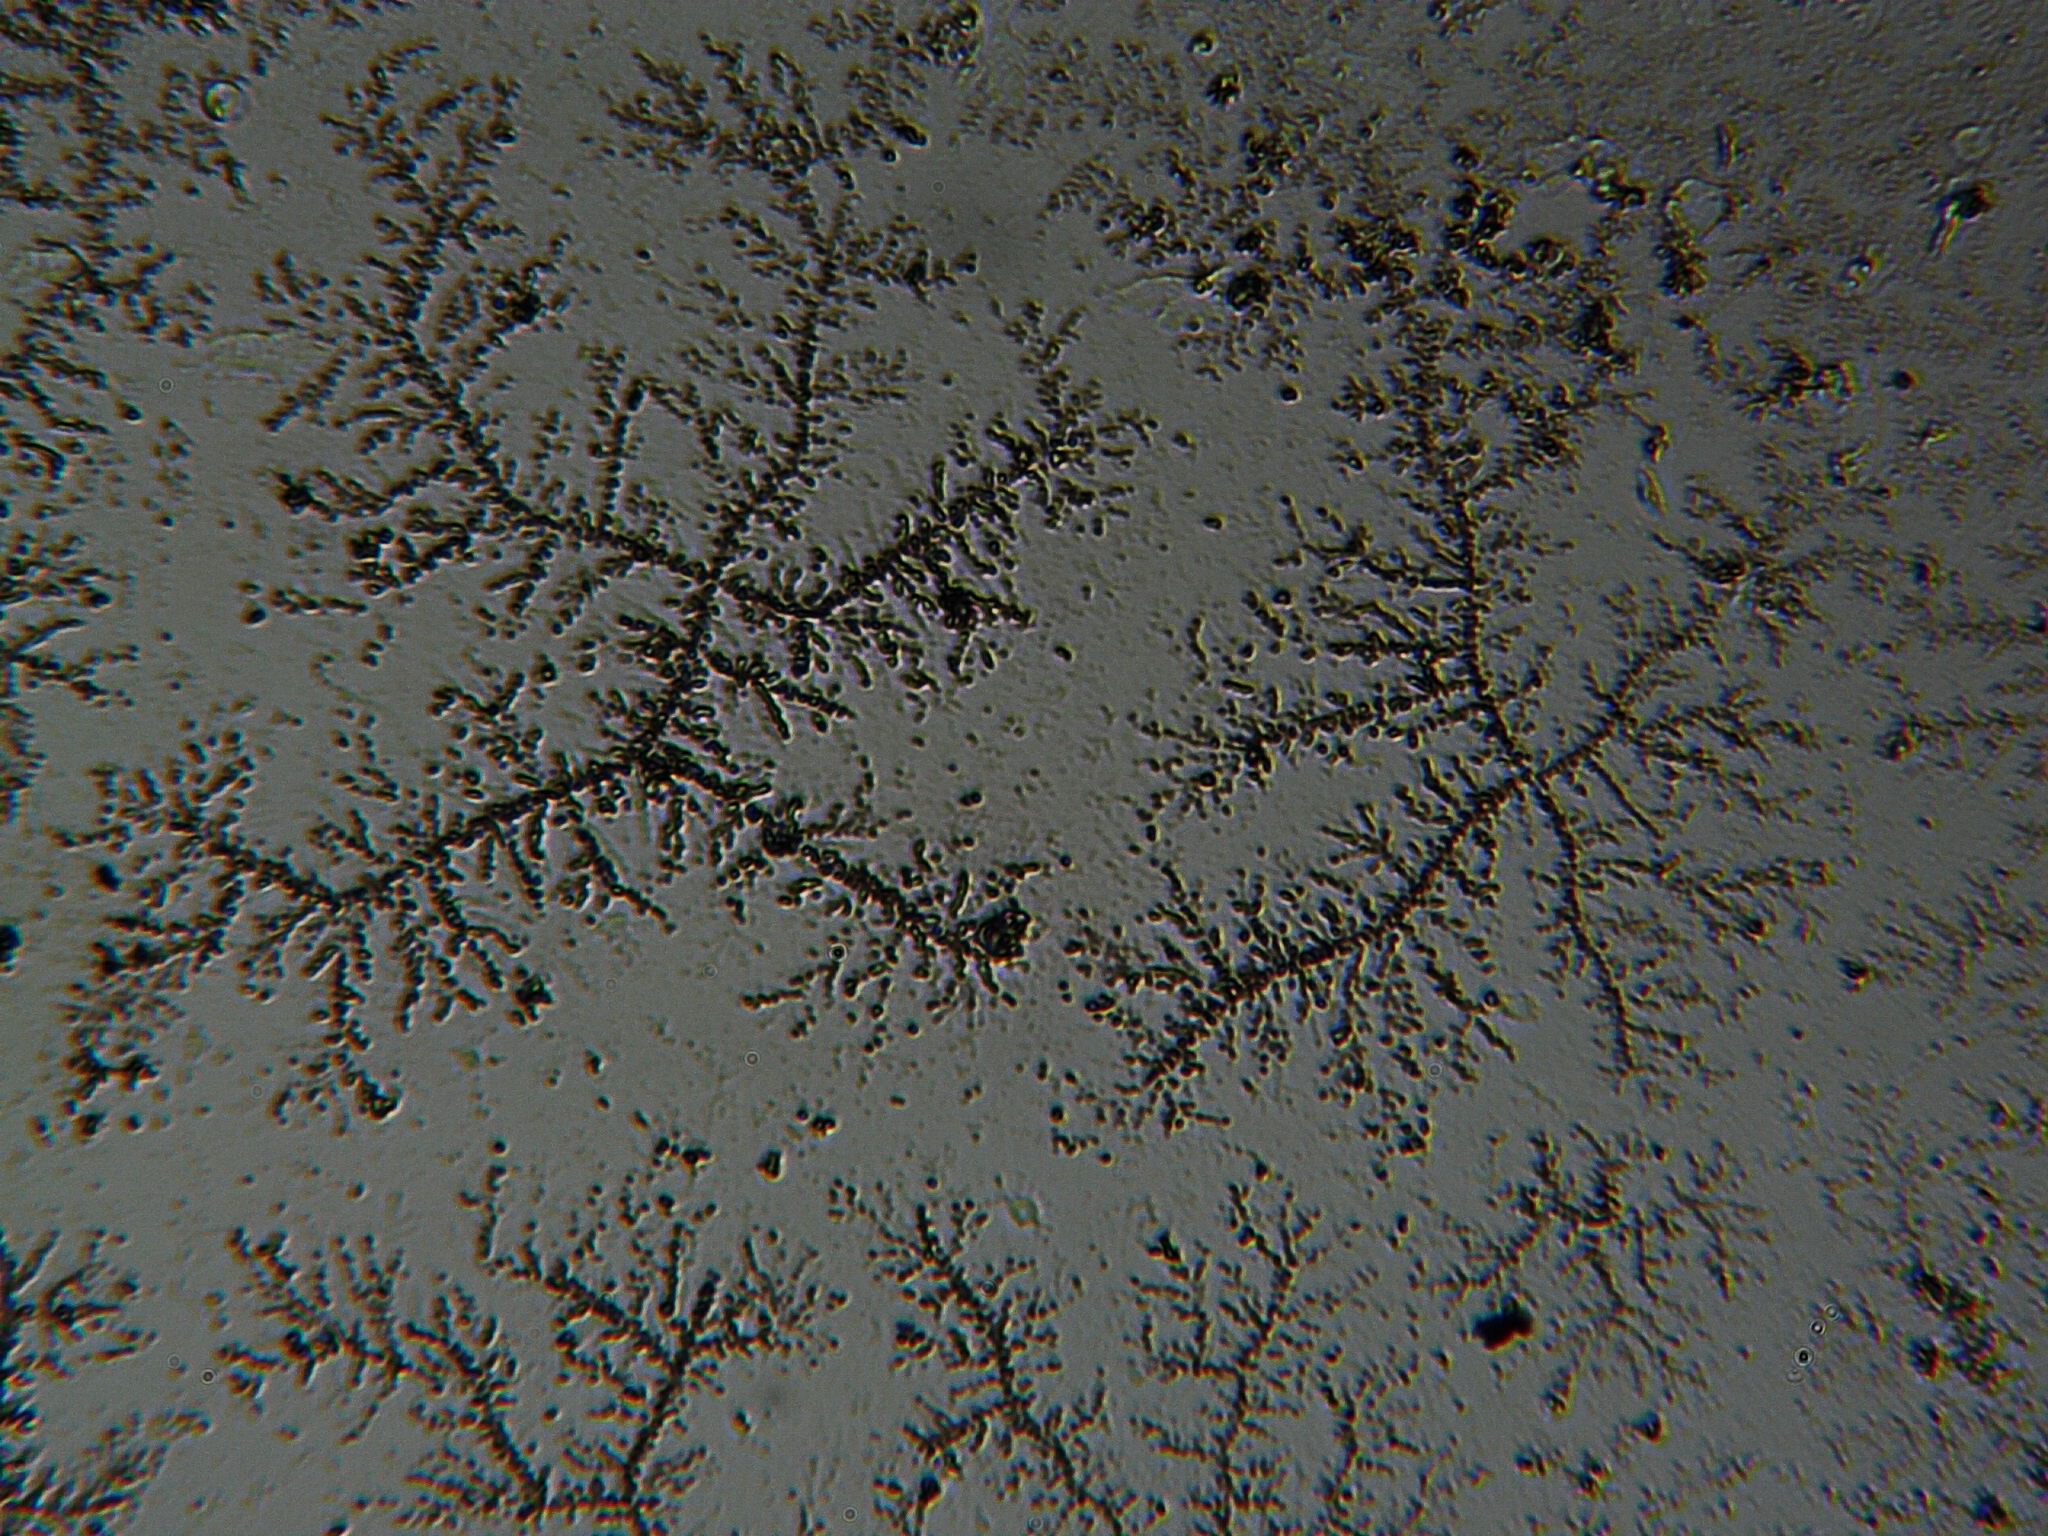 |
b. 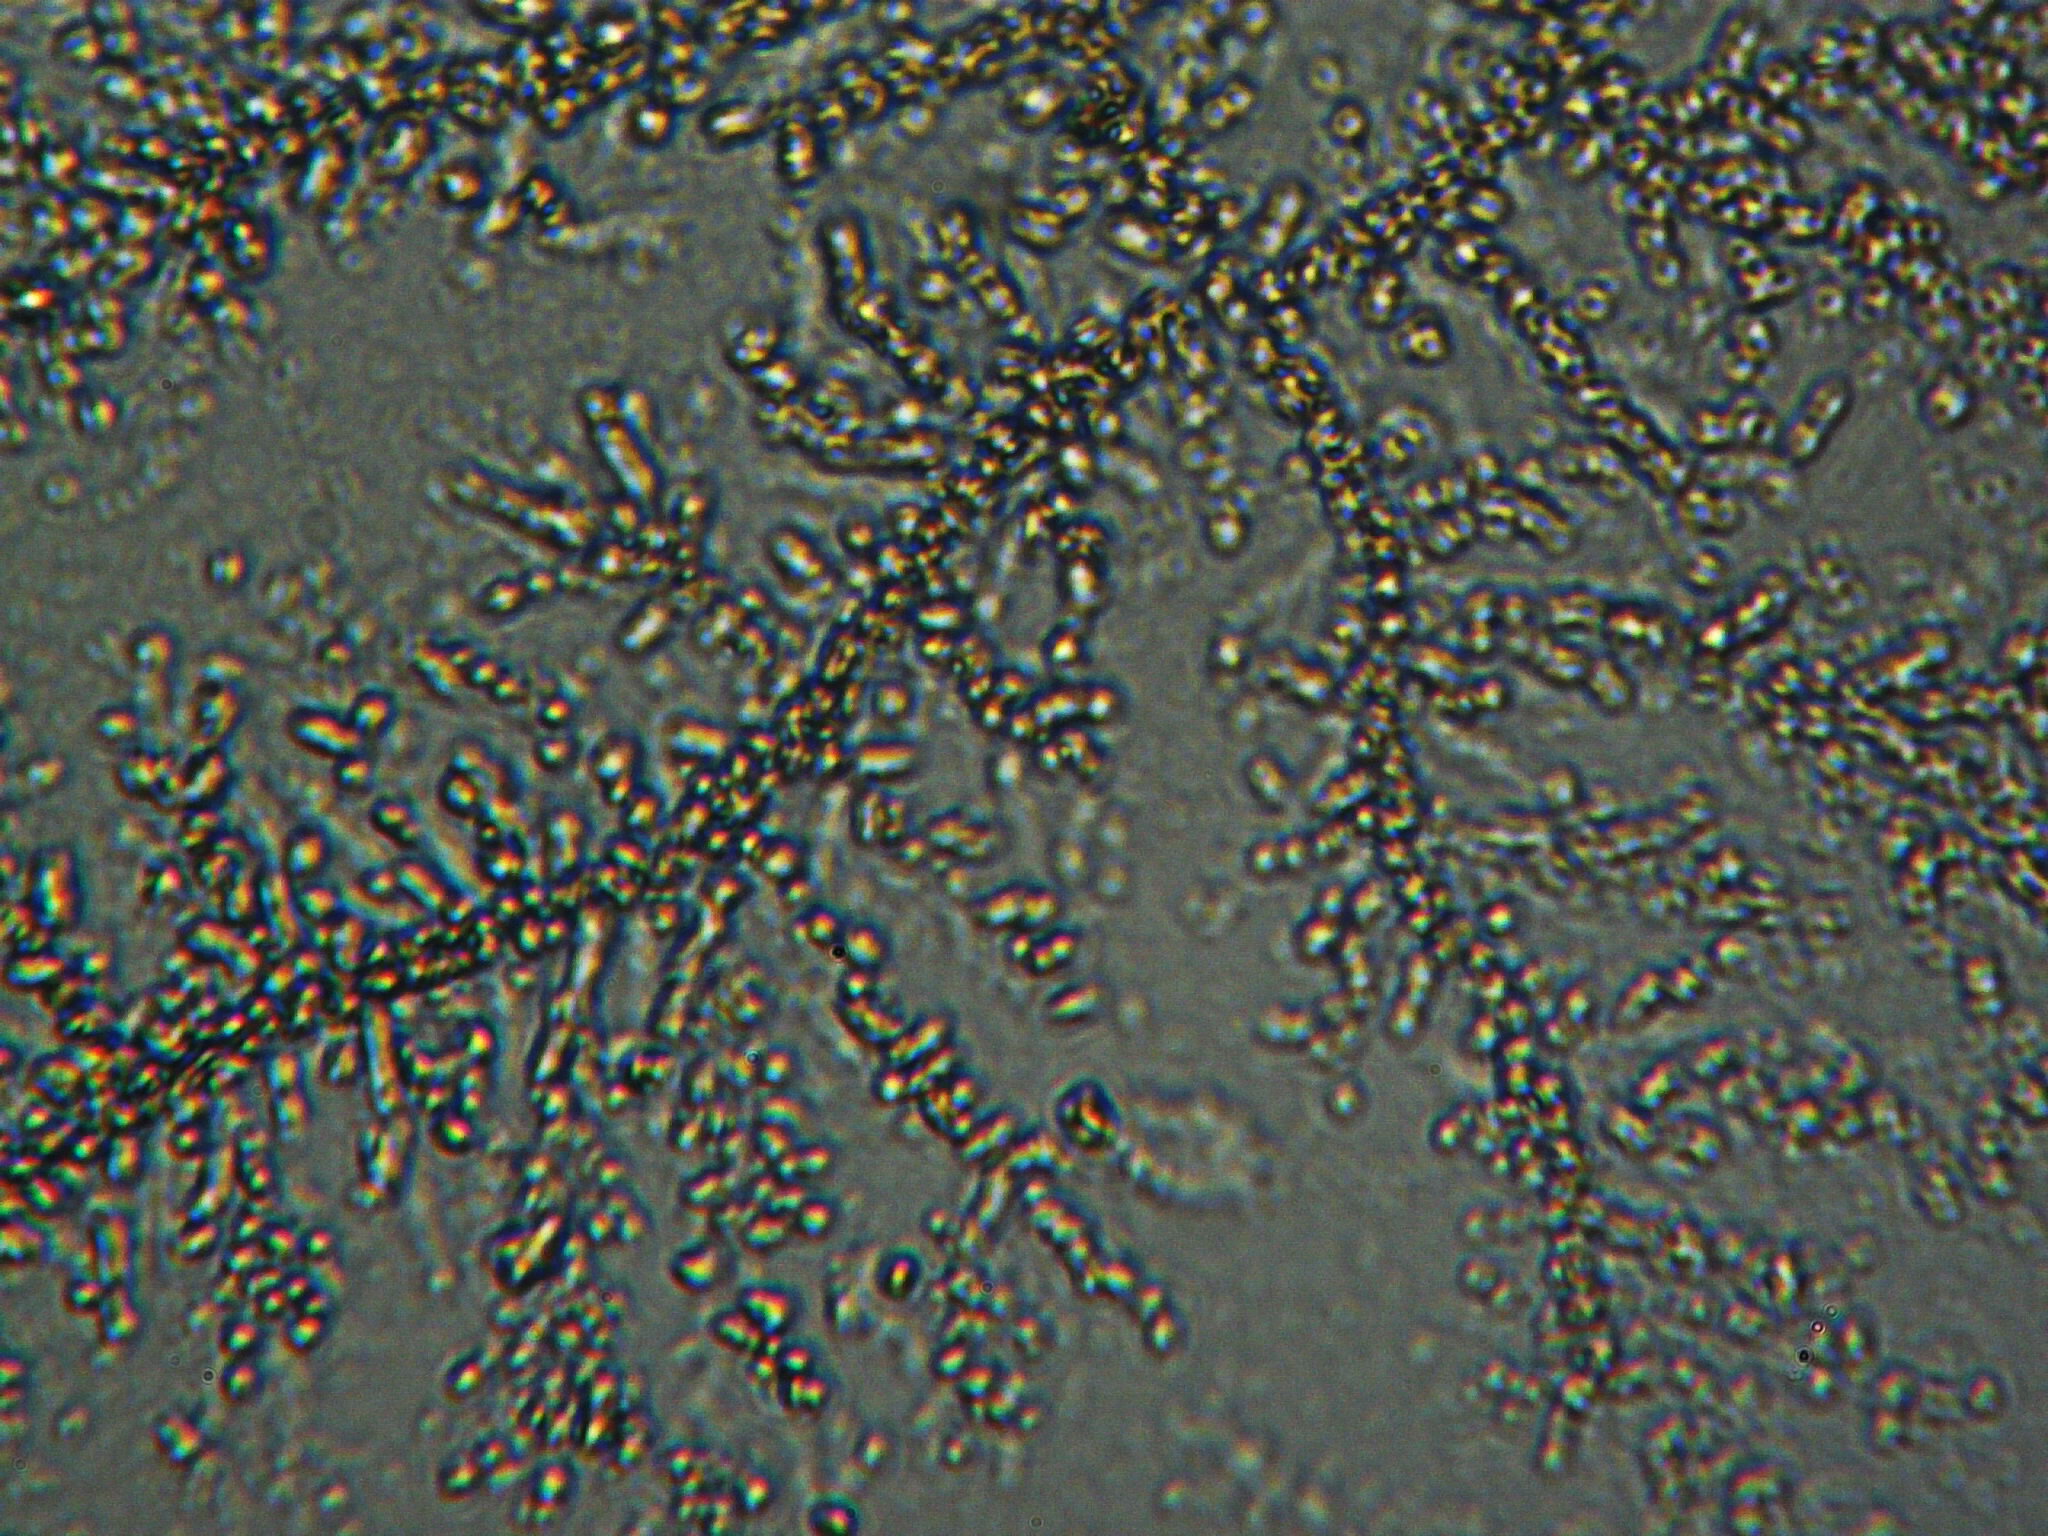 |
c. 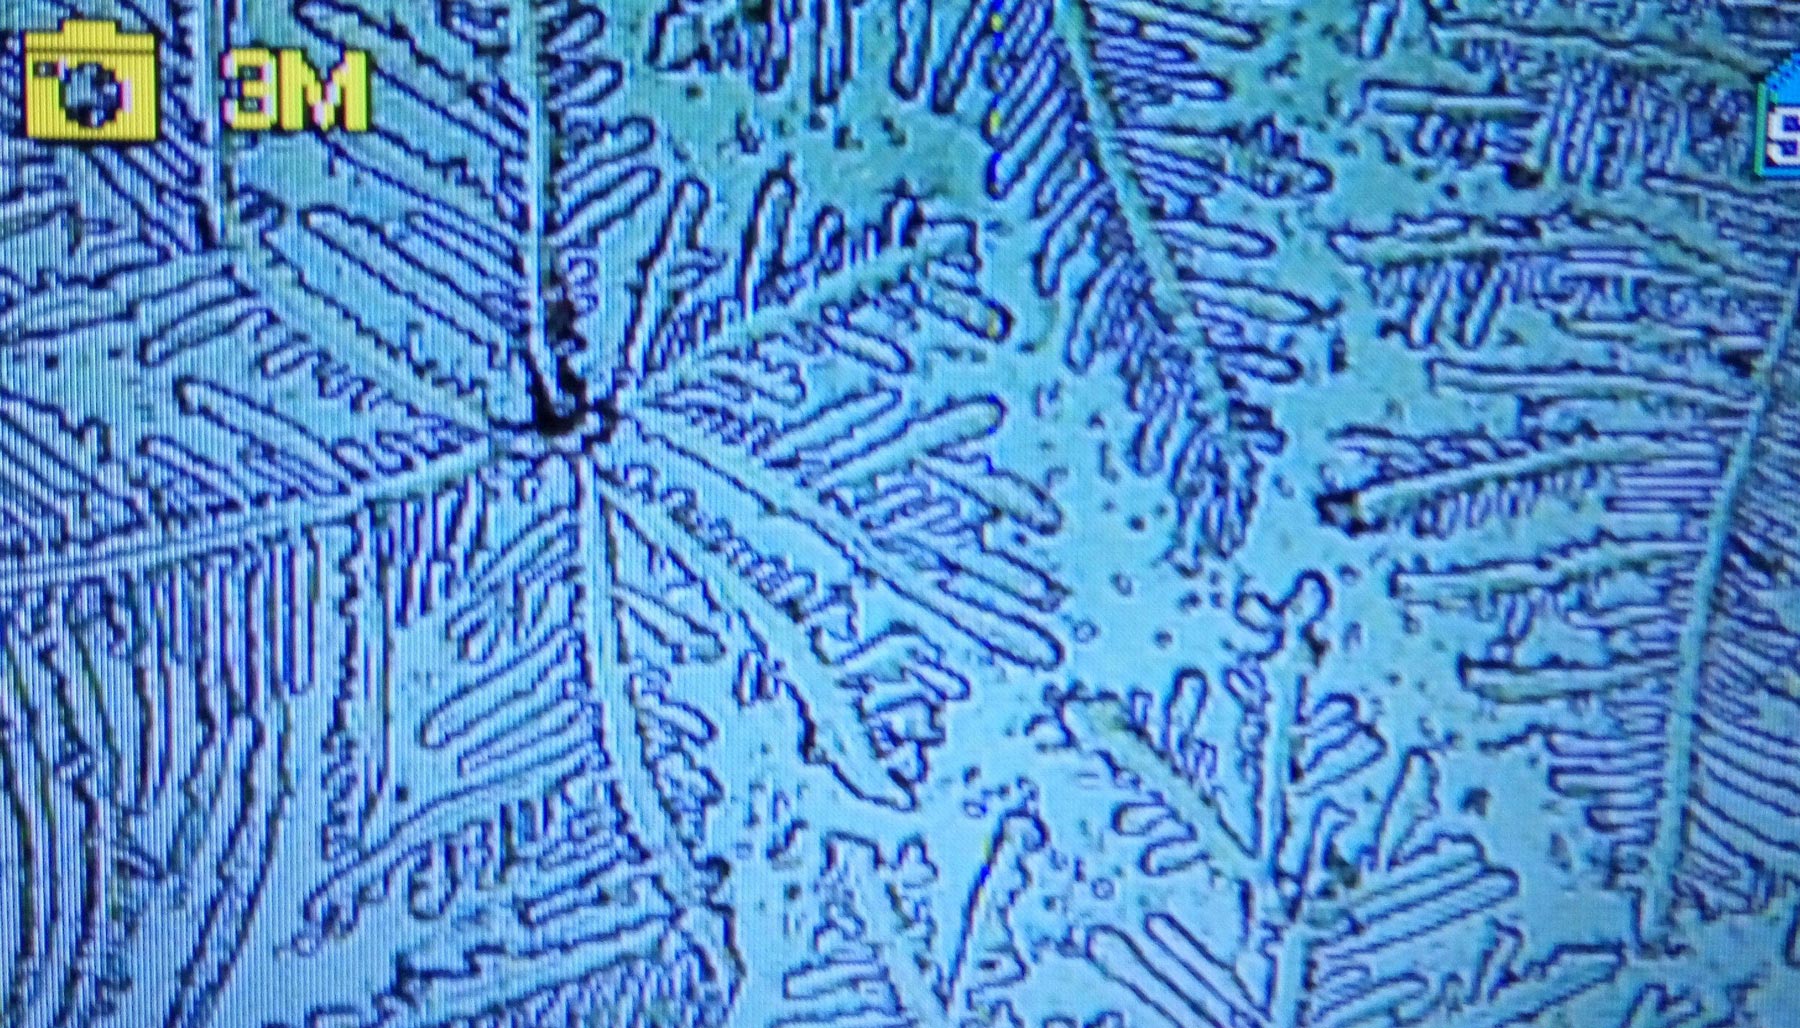 |
d. 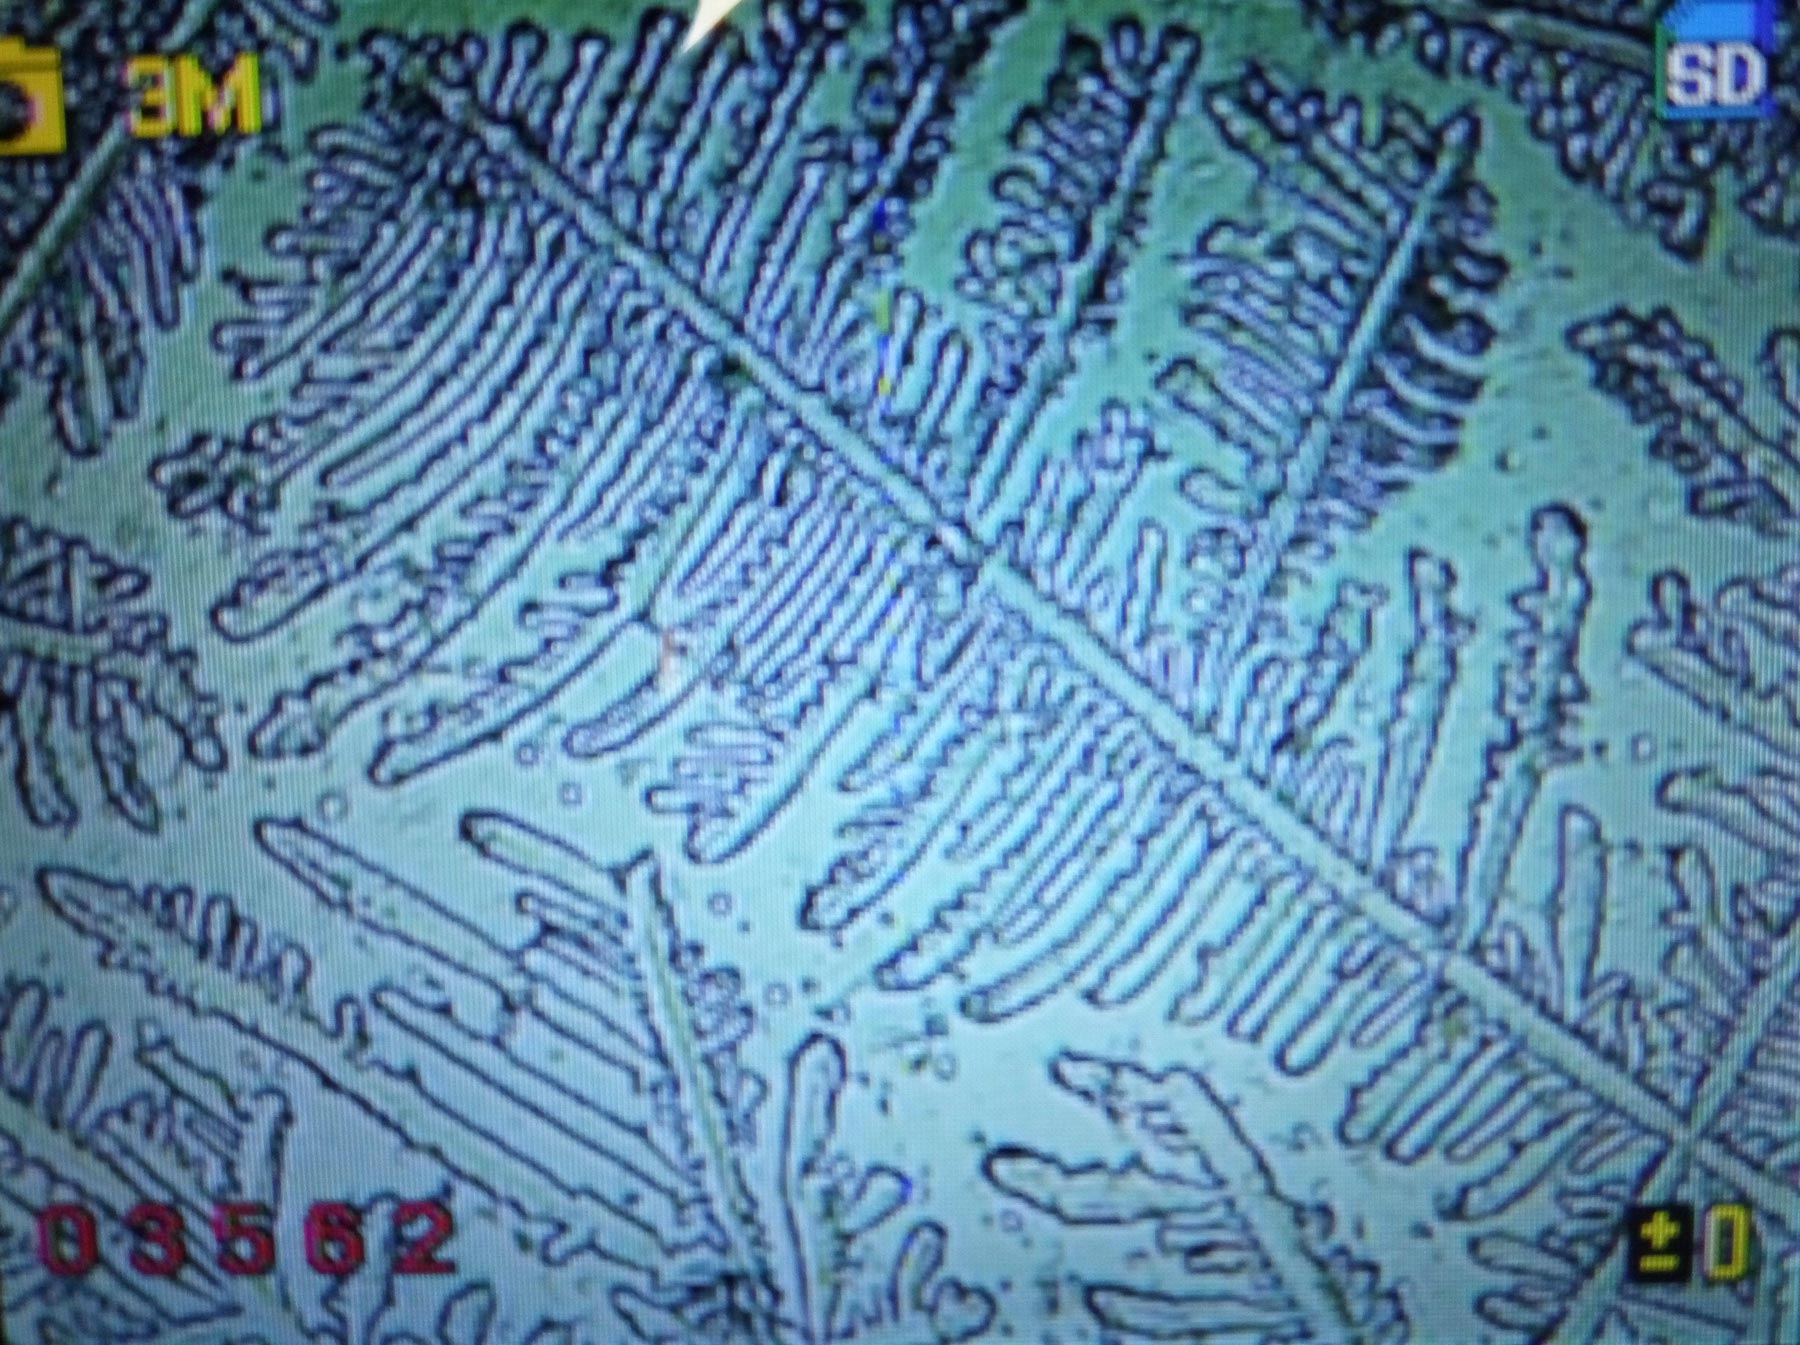 |
e. 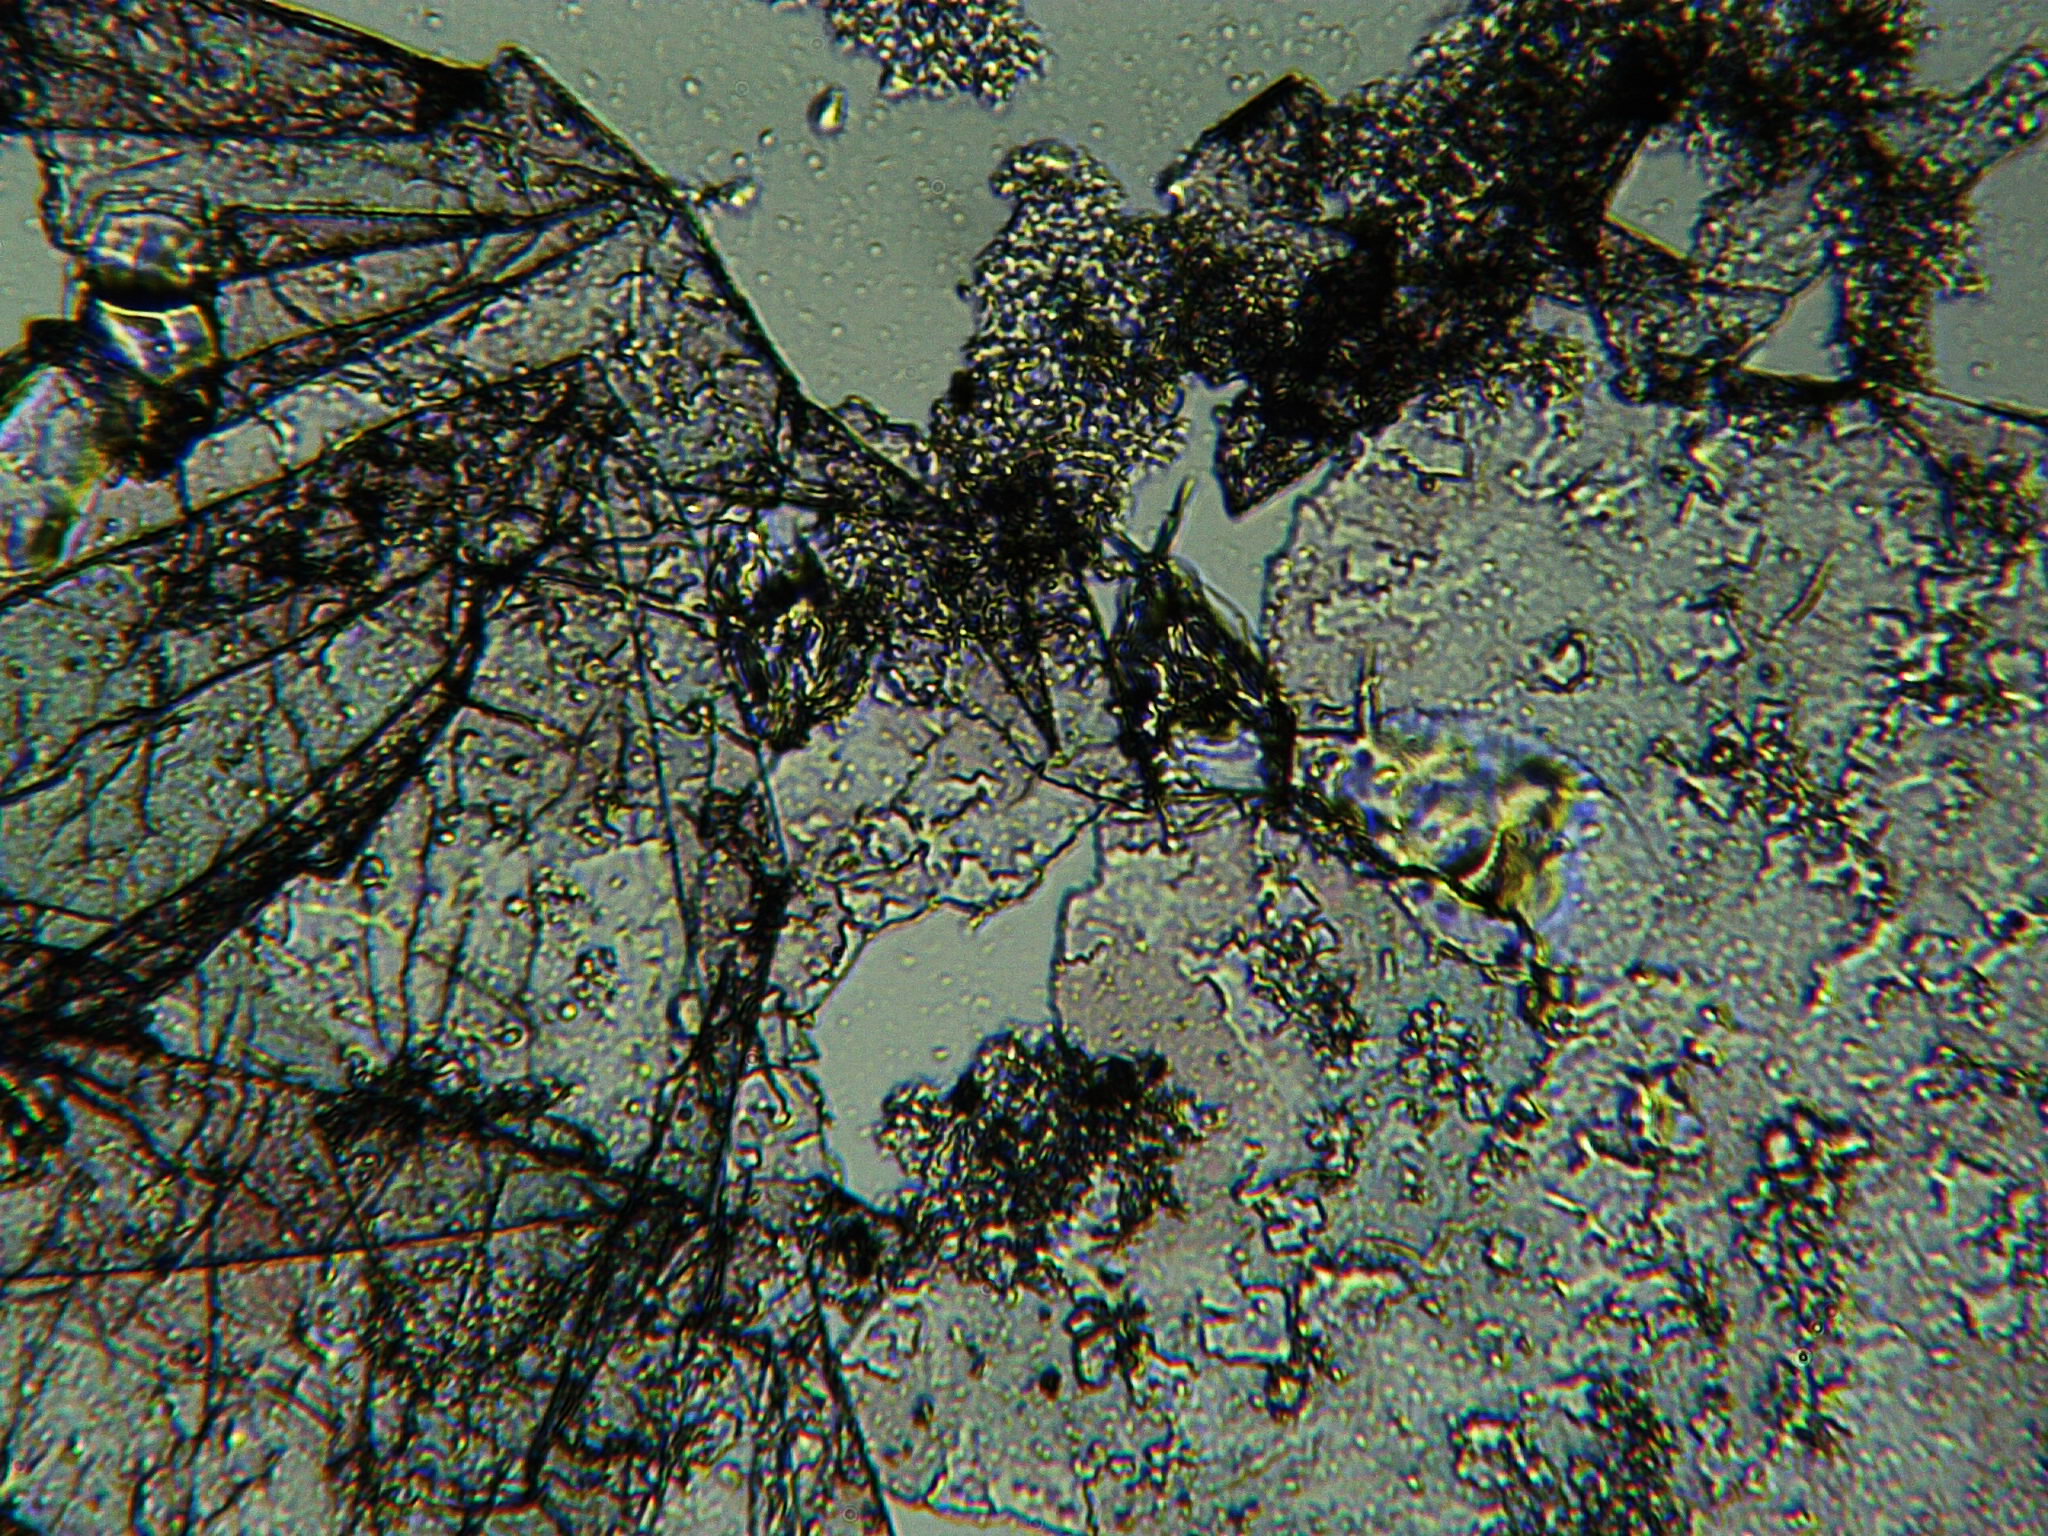 |
f. 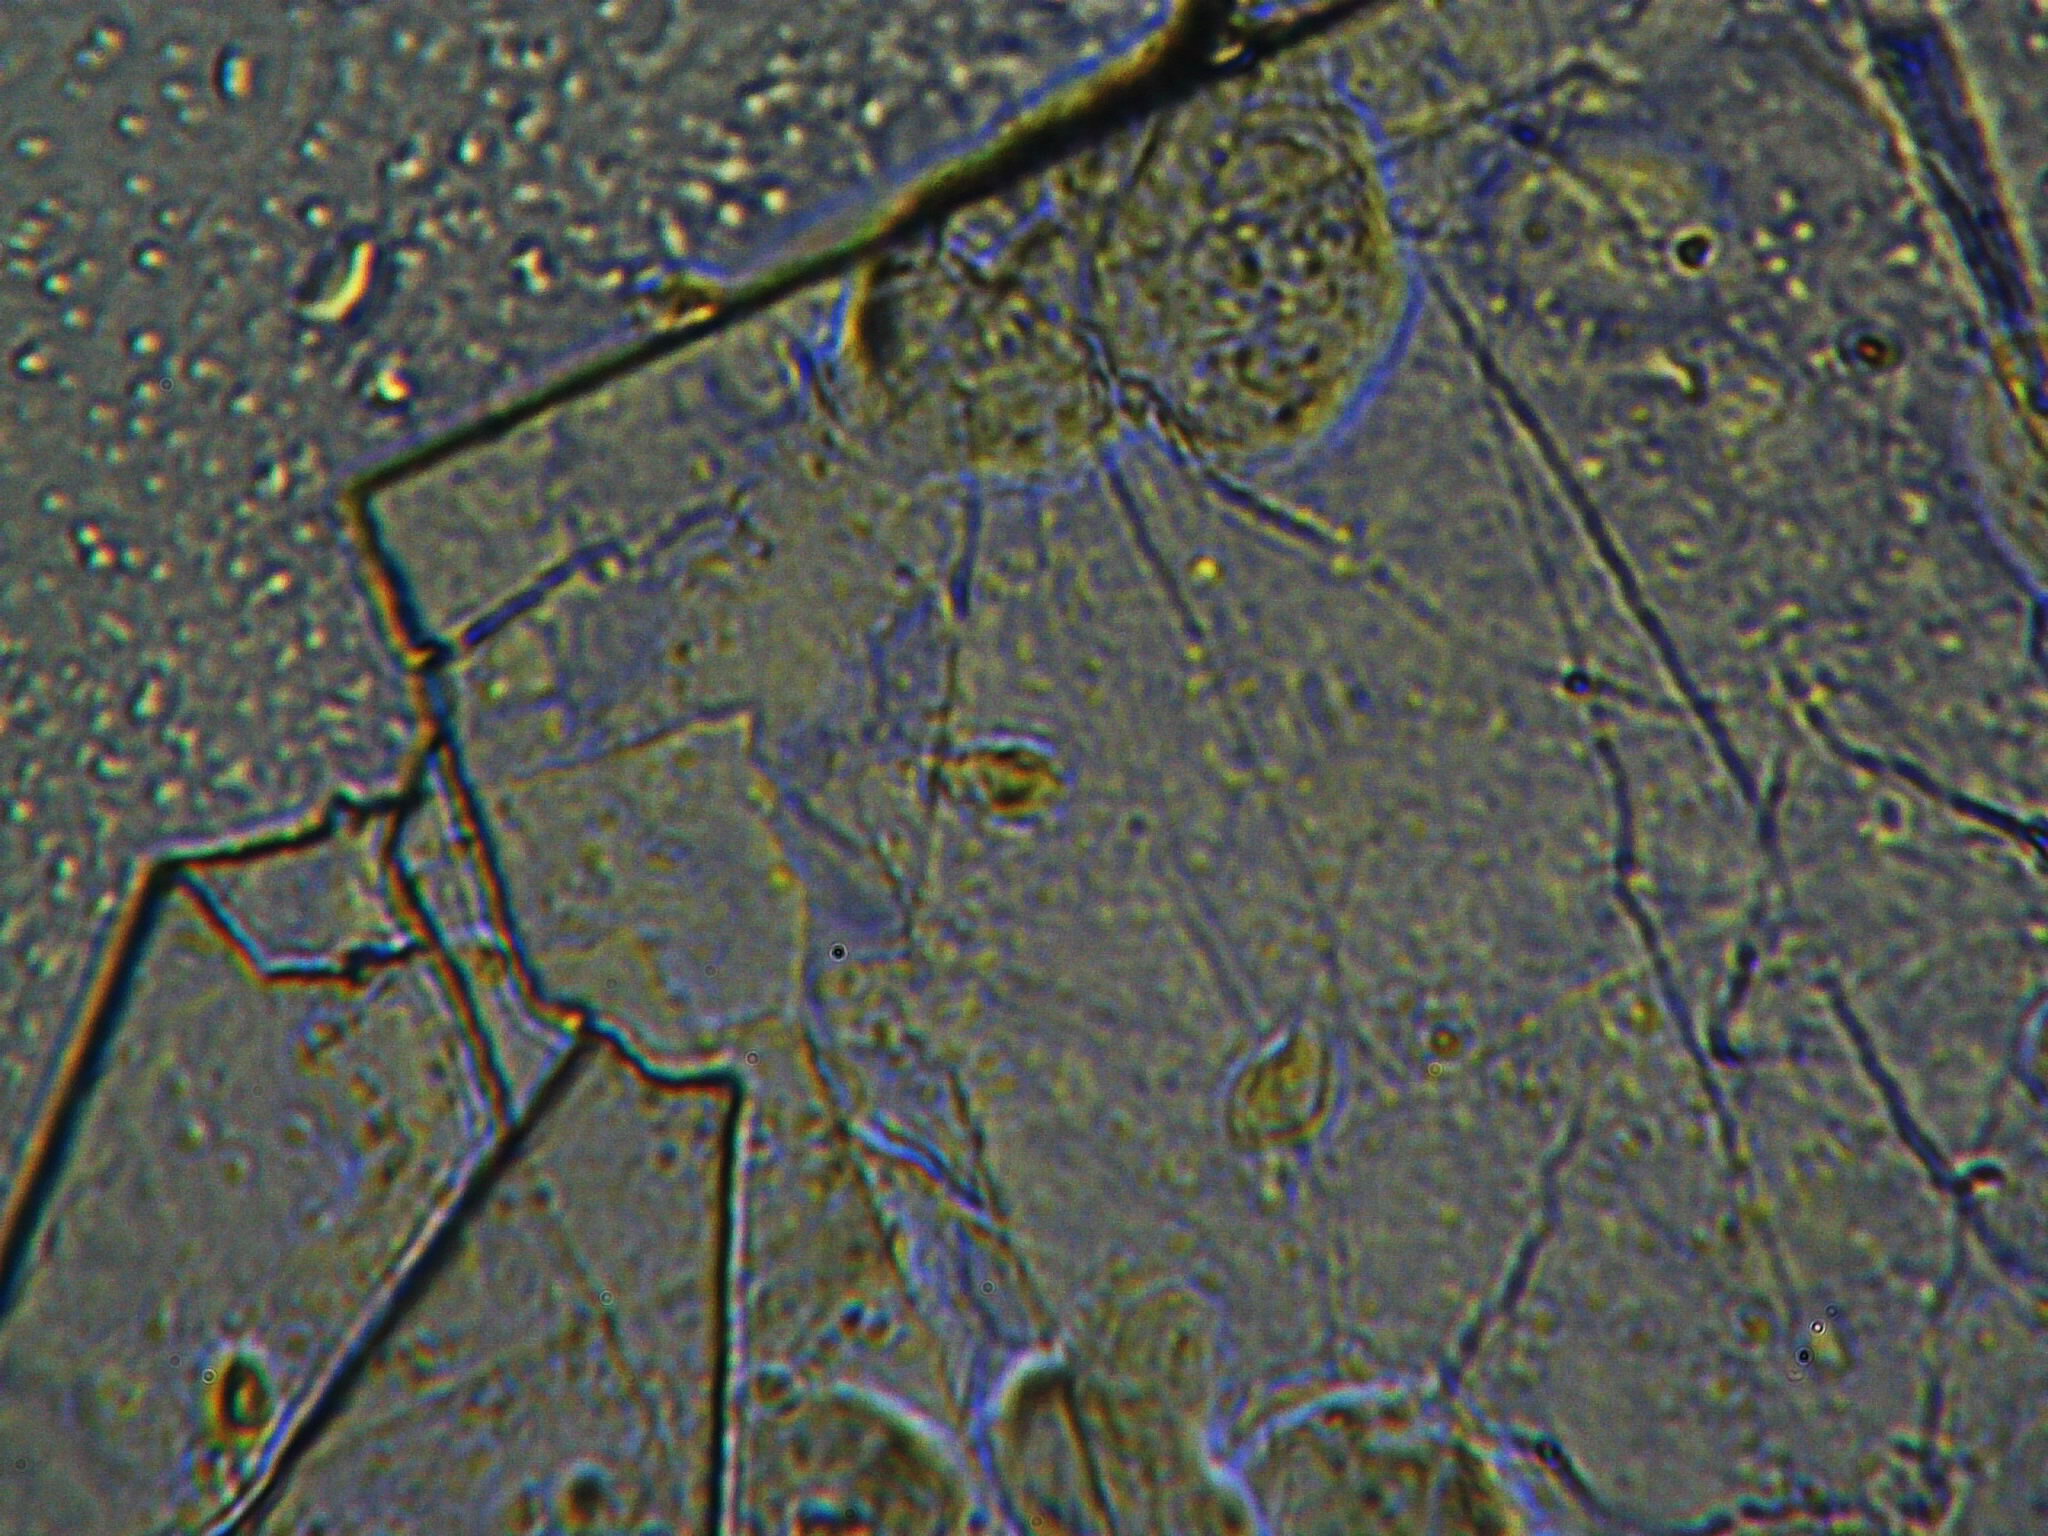 |
g. 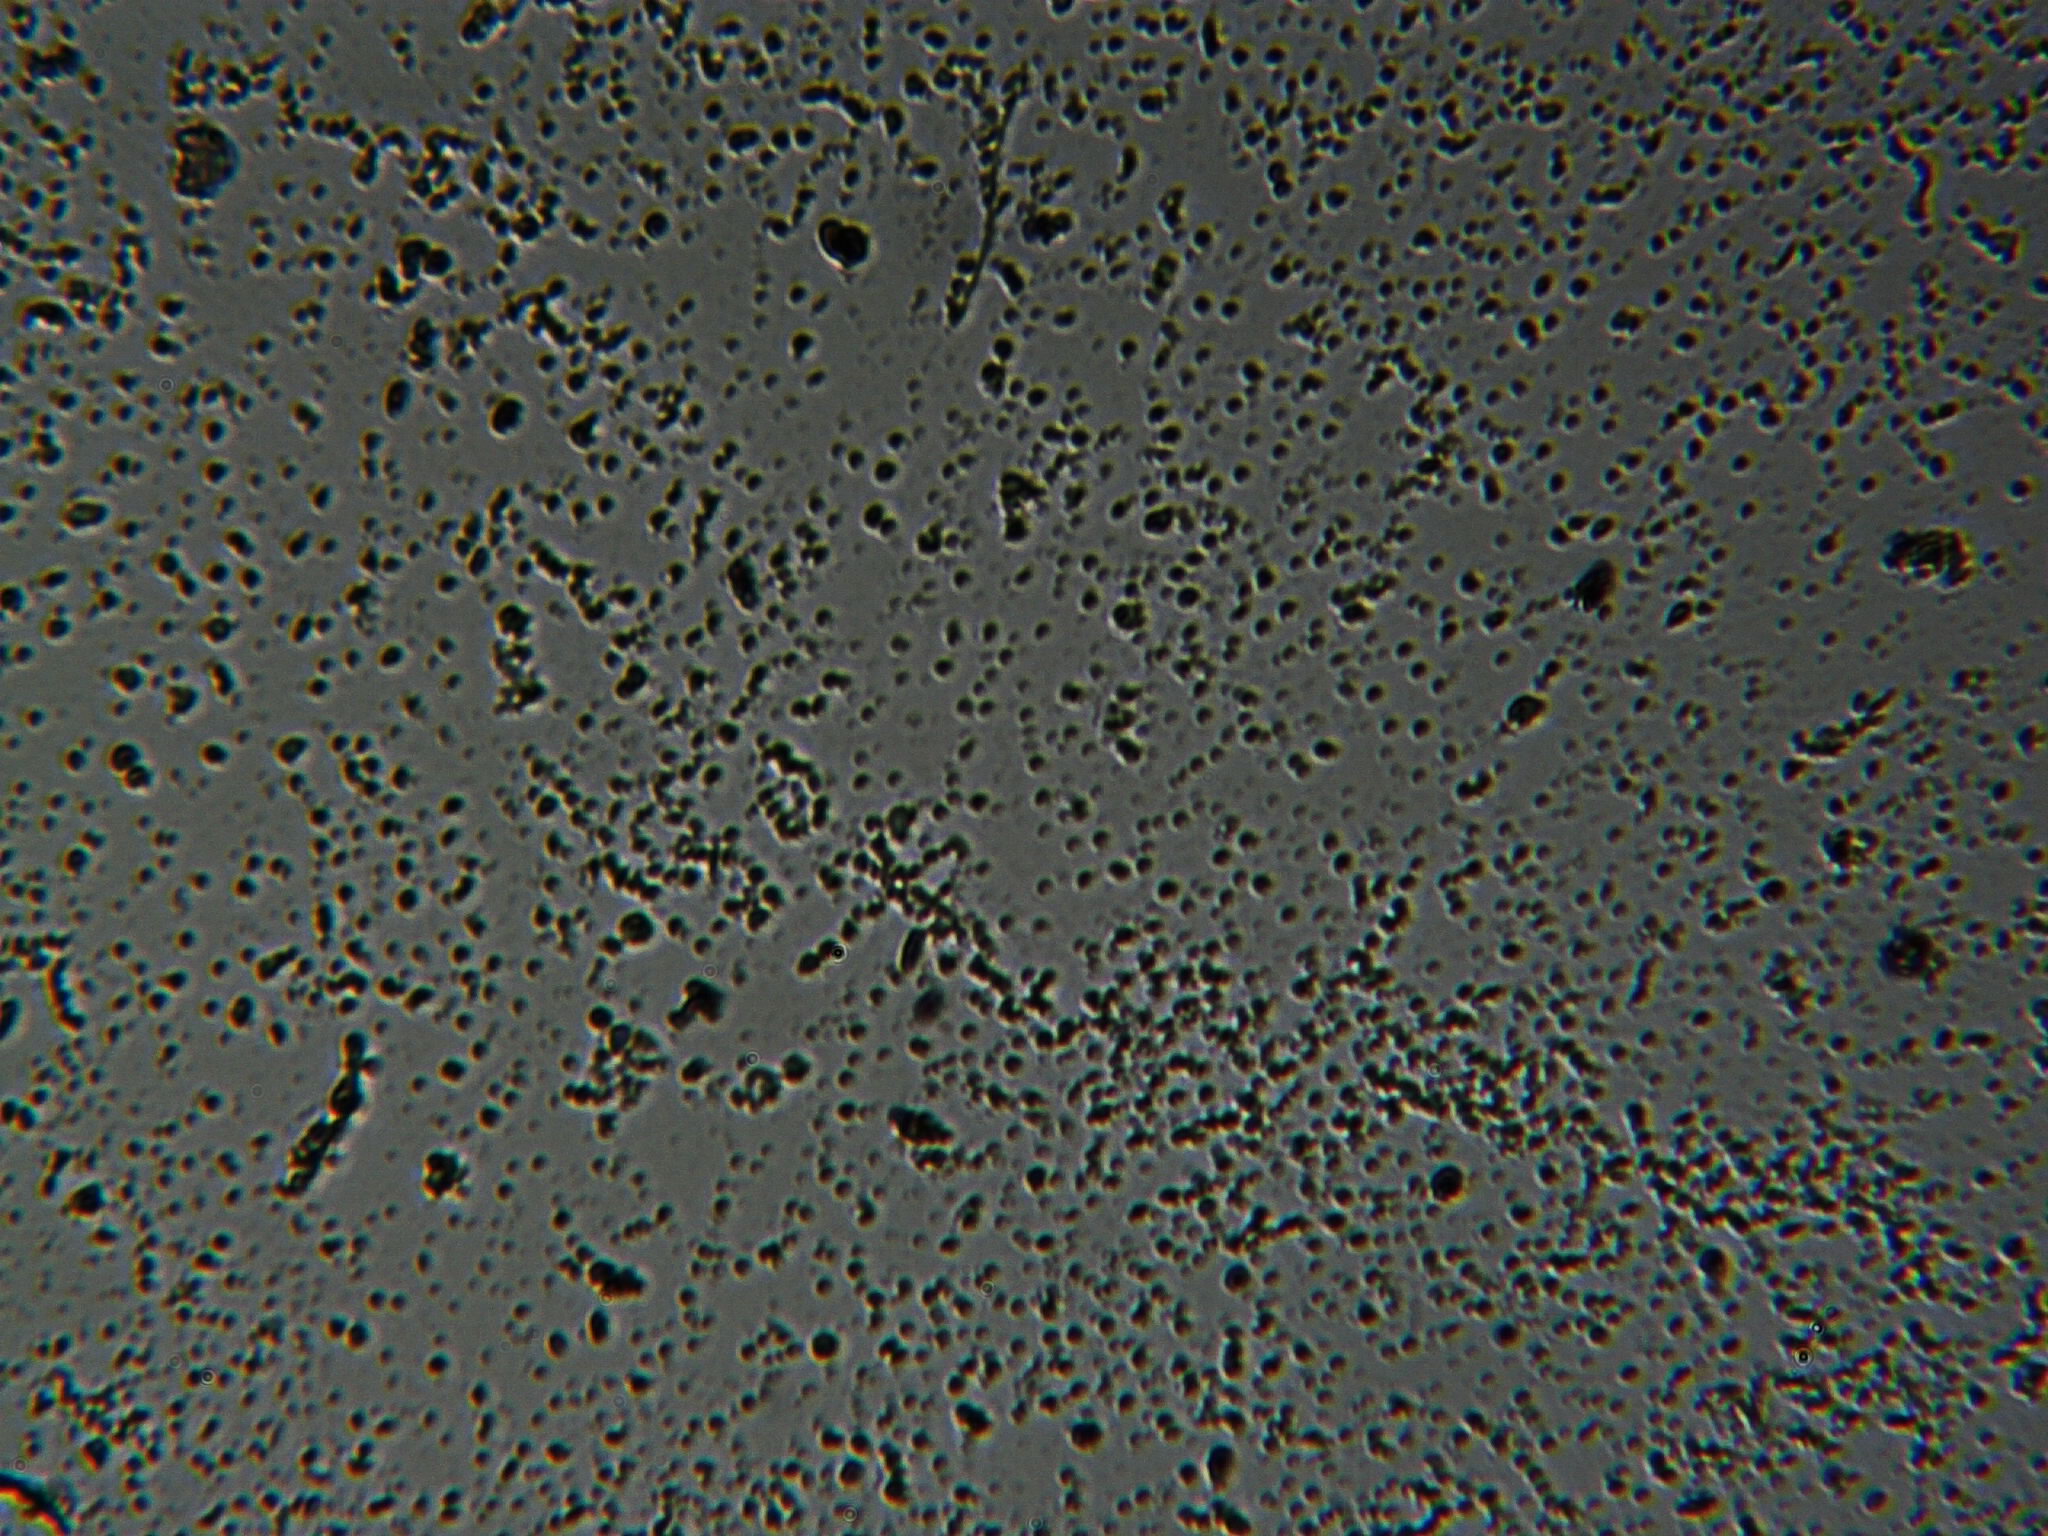 |
h. 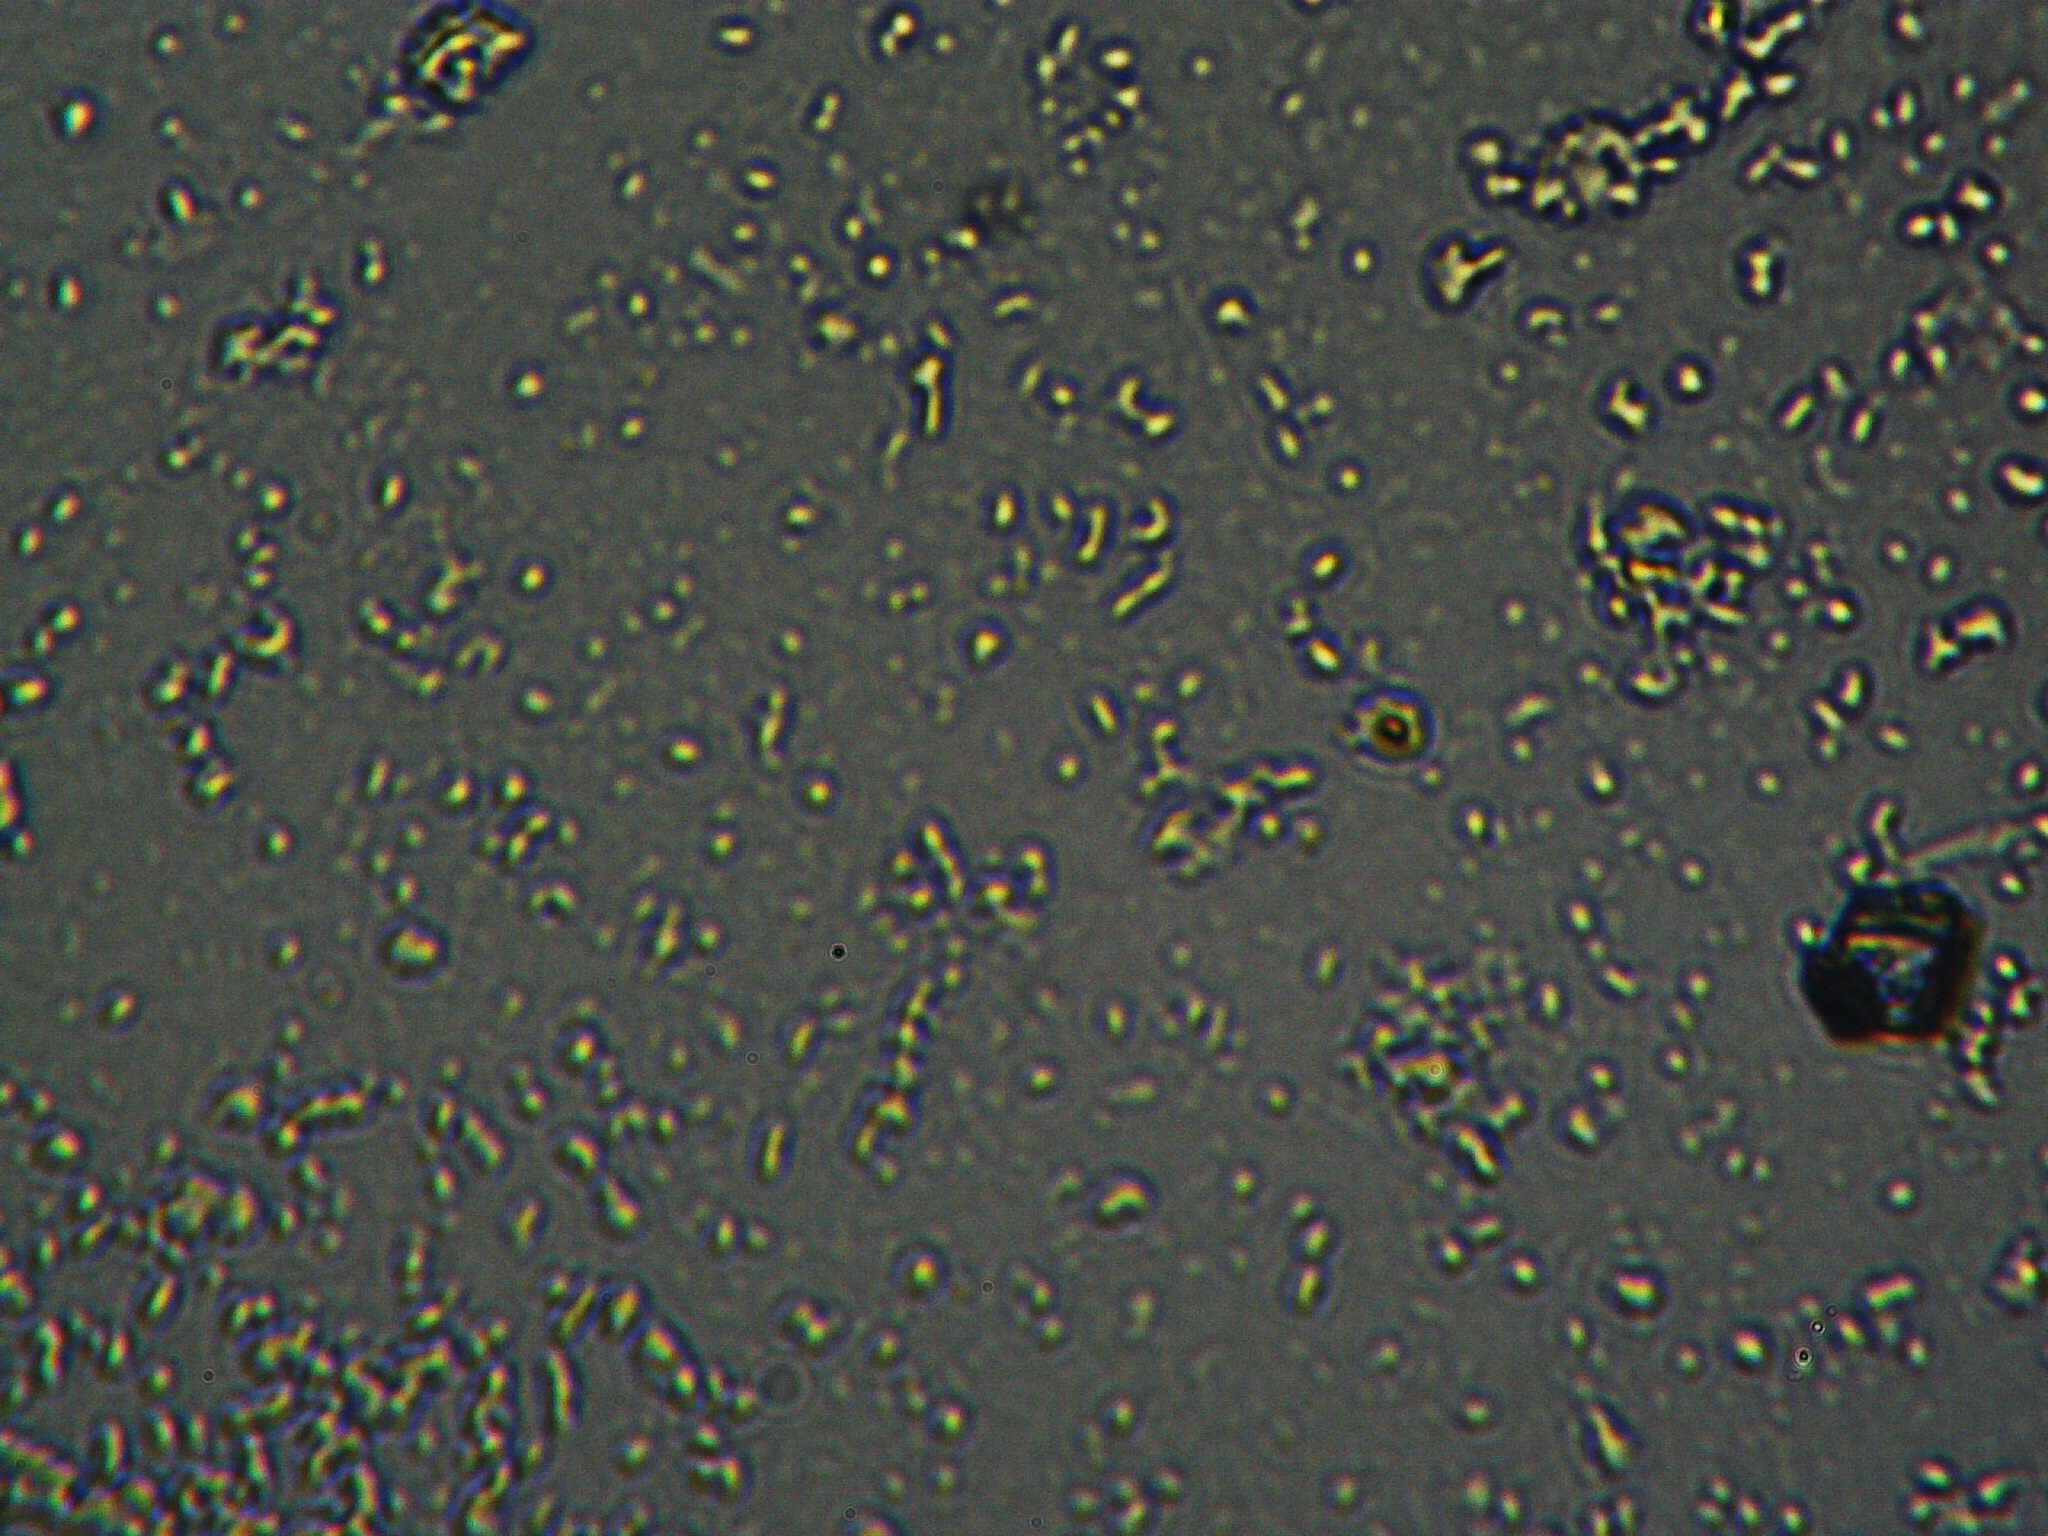 |
Figure S1. Optical microscopy. Figures a & b are, respectively, 125x and 500X magnification images of in air evaporated drops of IPW-HC with χIPW = 500 µS cm-1. Figures c & d are, respectively, 125x and 500X magnification images of in air evaporated drops of IPW-HC with χIPW = 688 µS cm-1. Figures e & f are, respectively, 125x and 500X magnification images of in air evaporated drops of IPW-CE with χIPW = 242 µS cm-1. Figures g & h are, respectively, 125x and 500X magnification images of in air evaporated drops of IPW-N with χIPW = 1014 µS cm-1.
a. 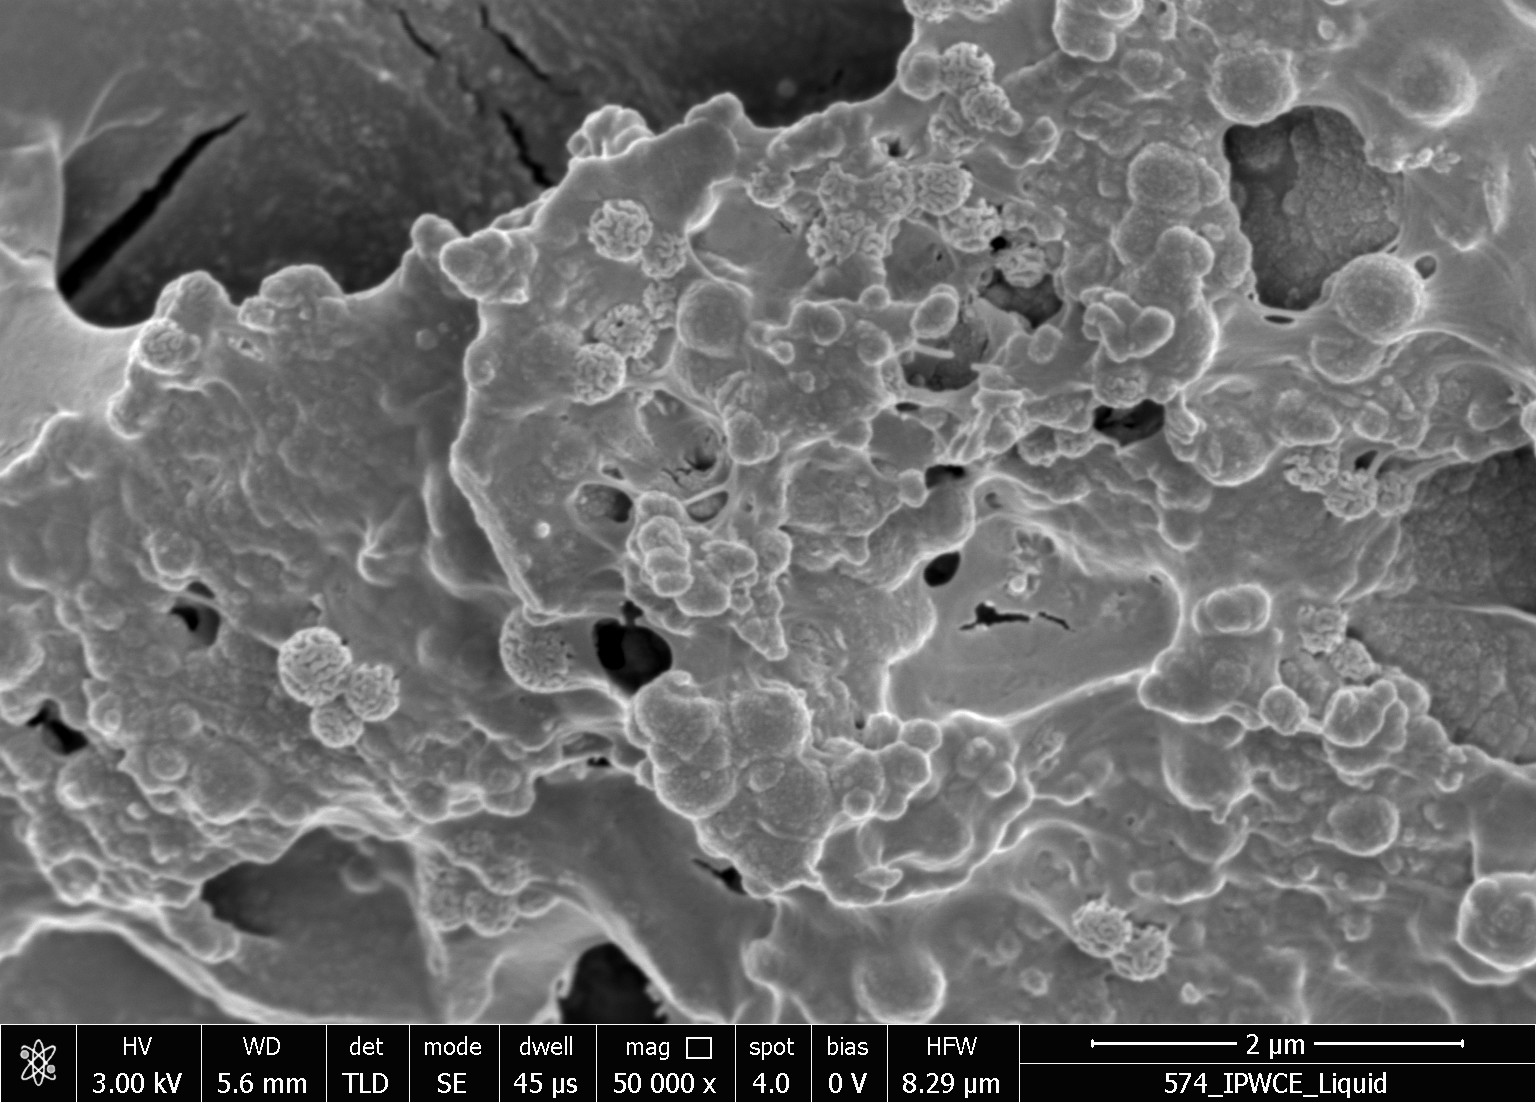 |
b. 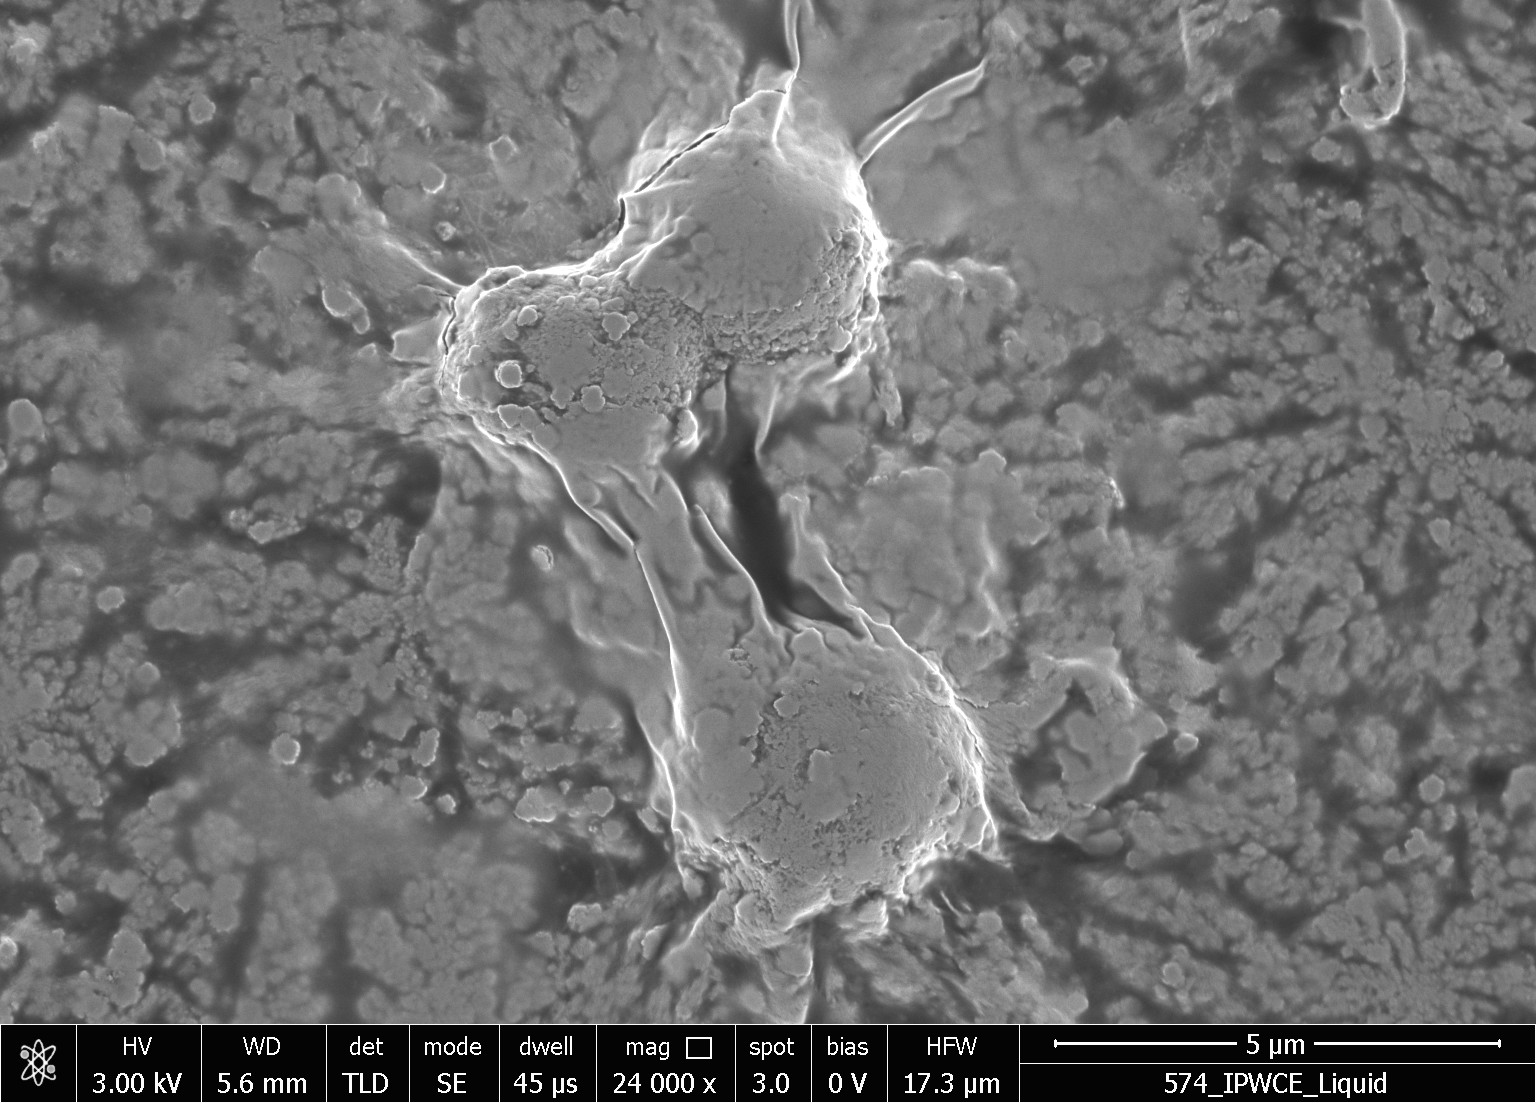 |
Figure S2. SEM images of in air evaporated drops of IPW-CE. Figures a & b are images at different resolution, which are detailed at the bottom of the images. χIPW of the IPW-CE is 229 µS cm-1.
Glossary
Cellophane (CE), paper filter (PF), Nafion® (N), hydrophilic cotton (HC), Crabyon (CR), sheep wool (SW), Silk (S), Cannabis (CA).
References
Noguchi H, Hiroshi M, Tominaga T, Gong JP, Osada Y and Uosaki K (2008). Interfacial water structure at polymer gel/quartz interfaces investigated by sum frequency generation spectroscopy. Phys. Chem. Chem. Phys.10, 4987-4993.
Zheng JM, Chin WC, Khijniak E, Khijniak E Jr, Pollack GH (2006). Surfaces and interfacial water: Evidence that hydrophilic surfaces have long-range impact. Adv. Colloid Interface Sci. 127, 19–27.
Elton DC, Spencer PD, Riches JD, Williams ED (2020). Exclusion Zone Phenomena in Water—A Critical Review of Experimental Findings and Theories. J. Mol. Sci. 21, 5041.
Zhang Y, Takizawa S, Lohwacharin J (2015). Spontaneous particle separation and salt rejection by hydrophilic membranes. Water 7, 1-18.
Hasegawa T, Ushida A, Goda N, Ono Y (2017). Organic compounds generated after the flow of water through micro-orifices: Were they synthesized? Heliyon 3, e00376.
Hasegawa T, Ono Y, Ushida A, Goda N (2020). Continuous organic synthesis in water around micro-orifices after flows. Heliyon 6, e03630.
Elia V, Napoli E, Germano R, Oliva R, Roviello V, Niccoli M, Amoresano A, Naviglio D, Ciaravolo M, Trifuoggi M, Yinnon TA (2019). New chemical-physical properties of water after iterative procedure using hydrophilic polymers: The case of paper filter. J. Mol. Liq. 296, 111808.
Elia V, Oliva R, Napoli E, Germano R, Pinto P, Lista L, Niccoli M, Toso D, Vitiello G, Trifuoggi M, Giarra A, Yinnon TA (2018). Experimental study of physicochemical changes in water by iterative contact with hydrophilic polymers: A comparison between Cellulose and Nafion. J. Mol. Liq. 268, 598–609.
Yinnon TS, Elia V, Napoli E, Germano R, Liu ZQ (2016). Water ordering induced by interfaces: an experimental and theoretical study. Water 7, 96-128.
Elia V, Ausanio G, De Ninno A, Germano R, Napoli E, Niccoli M (2014). Experimental evidences of stable water nanostructures at standard pressure and temperature obtained by iterative filtration. Water 5, 121-130.
Elia V, Napoli E, Niccoli M (2013). Physical–chemical study of water in contact with a hydrophilic polymer: Nafion, J. Therm. Anal. Calorim. 112, 937-944.
Elia V, Napoli E, Germano R, Roviello V, Oliva R, Niccoli M, Amoresano A, Toscanesi M, Trifuoggi M, Fabozzi A, Yinnon TA (2020). Water perturbed by Cellophane: Comparison of its physicochemical properties with those of water perturbed with cotton wool or Nafion. J. Therm. Anal. Cal. doi.org/10.1007/s10973-020-10185-0.
Elia V, Germano R, Napoli E (2015). Permanent dissipative structures in water: the matrix of life? Experimental evidences and their quantum origin. Curr. Top. Med. Chem. 15, 559-571.
Capolupo A, Del Giudice E, Elia V, Germano R, Napoli E, Niccoli M, Tedeschi A, Vitiello G (2014). Self-similarity properties of Nafionized and filtered water and deformed coherent states. Int. J. Mod. Phys. B 28, 1450007.
De Ninno A, Congiu Castellano A (2011). Co-ordination of water molecules in isotopic mixtures. J. Mol. Structure 1006, 434-440.
Elia V, Yinnon TA, Oliva R, Napoli E, Germano R, Bobba F, Amoresano A (2017). Chiral micron-sized H2O aggregates in water: Circular dichroism of supramolecular H2O architectures created by perturbing pure water. Water 8, 1-29.
Del Giudice E, Tedeschi A, Vitiello G, Voeikov V (2013). Coherent structures in liquid water close to hydrophilic surfaces. J. Phys.: Conf. Ser. 442, 012028.
De Ninno A (2017). Dynamics of formation of the exclusion zone near hydrophilic surfaces. Chem. Phys. Lett. 667, 322-326.
Sivasubramanian S, Widom A, Srivastava YN (2005). The Clausius–Mossotti phase transition in polar liquids. Physica A 345, 356 -366.
Del Giudice E, Preparata G, Vitiello G (1988). Water as a free electric dipole laser. Phys. Rev. Lett. 61, 1085-1088.
Chai B, Yoo H, Pollack GH (2009). Effect of Radiant Energy on Near-Surface Water. J. Phys. Chem. B, 113, 13953-13958.
Del Giudice E, Vitiello G (2006). Role of the electromagnetic field in the formation of domains in the process of symmetry-breaking phase transitions. Phys. Rev. A 74, 022105-1-022105-9.
Elia V, Napoli E, Niccoli M (2013). Calorimetric and conductometric titrations of nanostructures of water molecules in iteratively filtered water J. Therm. Anal. Calorim. 111, 815-821.
Elia V, Napoli E (2011). Nanostructures of water molecules in iteratively filtered water. Key Eng. Mater. 495, 37-40.
Elia V, Ausanio G, De Ninno A, Gentile F, Germano R, Napoli E, Niccoli M (2013). Experimental evidence of stable aggregates of water at room temperature and normal pressure after iterative contact with a Nafion® polymer membrane. Water 5, 16-26.
Elia V, Lista E, Napoli E, Niccoli M. A (2014). Thermodynamic characterization of aqueous nanostructures of water molecules formed by prolonged contact with the hydrophilic polymer Nafion. J. Therm. Anal. Calorim. 115, 1841-1849.
Elia V, Marchettini N, Napoli E, Niccoli M (2013). Calorimetric, conductometric and density measurements of iteratively filtered water using 450, 200, 100 and 25 nm Millipore filters. J. Therm. Anal. Cal. 114, 927–936.
Acknowledgments
Firstly, we want to remember the living memory of our friend – and deep coauthor of many papers – Tamar A. Yinnon who recently and prematurely left us for a better place, and was not able to see the publication of this common paper.
Moreover, we thank Prof. A.M. Yinnon for the proofreading of the manuscript.
We thank Dr. Andrea Sabelli, CEO of “Antico Opificio Serico” in San Leucio area of Caserta (Italy), seat of the ancient “Real Colonia della Seta del Regno di Napoli,” to have enthusiastically and freely supplied a good quantity of their raw silk for our experiments.
Funding
No Funding.
Authors’ Contributions
V.E. conceived and managed the research and wrote the first version of the manuscript. R.G. and R.O. assisted in these tasks. E.N. prepared the perturbed water samples. D.N. performed the chemical analysis. M.C. performed lyophilizations. G.D.P. performed FT-IR spectra measurements. D.C. carried out the DTA and TG analyses. T.A.Y. wrote the manuscript and contributed to its theoretical aspects. All authors discussed the results and commented on the manuscript.
Competing interests
The authors declare no competing financial interest.
Discussion with Reviewers
Reviewer #1: What is the sequence of the operations?
Authors: The sequence of operations is as follows:
The same polymer used in the previous experiment is used for each series of experiments with each species of insoluble polymers. Repetitions of hydration and dehydration are performed with a certain amount of double-distilled water until an increase in electrical conductivity (χ) is obtained, for example of 100 µS/cm. The time required for each step varies from a few days to even weeks. The liquid is lyophilized and the Xerosydryle is obtained and weighed. From the knowledge of the volume of the liquid, the weight is normalized to mg/liter.
This might be the first point in the graph in Figure 1.
The polymer that has been left to dry is recovered and placed in contact with “new” double-distilled water. The series of hydrations and dehydrations are repeated. The electrical conductivity increases with each step. When the χ reaches the value of 200 µS/cm, for example, the liquid is lyophilized and Xerosydryle is obtained. The solid is weighed and from the knowledge of the volume of the liquid, the weight is normalized to mg/liter.
This might be the second point in the graph in Figure 1.
The procedure is iterated from 6 to 15 times. It should be clear that with this procedure, the insoluble polymer is placed in contact with the perturbed liquid (IPW) many times and with bidistilled water to release the soluble components (impurities). After a certain number of iterations, the soluble impurities are inexorably transferred into the liquid.
Despite this, the linear trends of Figure 1 clearly indicate that the conductivity continues to increase at each step of the procedure.
Moreover, the quantities of solid obtained by freeze-drying reach the enormous value of 6g/liter! This corresponds to 6kg/m3 of material, working with bidistilled water, a quantity that cannot be counted in terms of impurities.
The fact that the material is “predominantly” water is attributable to the large number of diversified sensitive analytical measurements performed and published in the preceding dozen experimental papers on this topic.
Reviewer #2: What are the biological implications of Xerosydryle?
Authors: We were briefly treating the biological implications of the Xerosydryle existence and discovery in our other papers, suggesting that it may be the matrix of life itself. When the Xerosydryle is dissolved in water, in particular, it shows Circular Dichroism. Future research, not easy to perform, will be devoted to understanding if the right- or left-handed chirality is preferred under certain conditions; this may provide clues to understanding why almost all biologically produced chiral amino acids are left-handed, or about the dominance of the right-handed B-form of DNA.
It is very interesting that our measurements show that the thermal properties of the dissolved Xerosydryle in water resemble much of those of biological macromolecules (so called “denaturation”). However, they are more thermally resistant than biomolecules, and their chirality is observed to be not affected by the addition of sodium hydroxide (NaOH) or hydrogen chloride (HCl) in sufficient amounts to induce pH to go up to 13 or down to 3, respectively. Such a robustness and the observation that a change in the hydration state can lead to dramatic changes to the DNA structure may be related to one of the DNA-repair mechanisms. In general, the origin of biohomochirality is still inexplicable. Our data seem to suggest that mirror-symmetry breaking in water may significantly contribute to the origin as well as pervasiveness of biohomochirality. It will be very important to investigate the impact of chiral supramolecular H2O aggregates on prebiotic chemical reactions and abiogenesis processes.
The dynamical processes whereby these dissipative structures are stabilized (probably also taking advantage of surrounding impurities), and the ability of these structures to recreate the previous physicochemical properties when they are once again placed in pure water, is suggestively reminiscent of the ability of some simple living systems, such as bacteria or protists, to remain in a quiescent state when environmental conditions are no longer favorable to life. The process of encystment helps the microbe to survive until conditions become more suitable. When the encysted microbe finds an environment favorable to its growth and survival, the cyst wall breaks down (excystation). In particular, when sufficient water is present, the microbe returns to its characteristic far-from-equilibrium state – that of a dissipative, living structure. Dissipative structures in pure water consist of water molecule aggregates that can form as a result of various kinds of perturbations, including low energy ones. They have the ability to exist far from thermodynamic equilibrium for a long time, in the order of several years or more. When the bulk water is removed, in a similar manner to many simple lifeforms, they enter a “frozen” quiescent state in which they cease dissipating energy until sufficient bulk water again becomes available. Then, again just as simple life-forms do, they are able to return to an active state, i.e. becoming again dissipative structures, far-from-equilibrium systems.
Reviewer #3: You mentioned that Xerosydryle has some carbon content. Does it stem from CO2 in the atmosphere?
We tested very clearly but did not publish yet that by increasing the CO2 content in the atmosphere of the experiment, it consequently increases the carbon content in the solid.
To answer your specific question, all the TG analyses show very clearly that when the carbon of the organic sheets is breaking, obviously around 400 °C, and the whole sample is disappearing, nothing is happening in the TG analysis curve of the Xerosydryle obtained by the pure water interaction with that same organic sheet; moreover, the quantity of the Xerosydryle remains stable for many hundreds of degrees.
Obviously, we are strongly aware that, since Xerosydryle is not simply a new material, but a new class of materials, this goal will be very complicated to fulfill, but we count on not being alone in this exciting adventure anymore.