
![]()
SPECIAL EDITION
Water Structure
Homeopathic Drugs Modify Water Structure in Ethanol Water Solution in Their Extreme Dilutions as Revealed by Electronic and Vibrational Spectroscopy
Singh R K1, 2, Ghosh S2, Sukul N C* 2, 3, Pande N2, 4, Sukul A2, Nandi M5, Pal A5, Pal M5
1Department of Botany, Government General Degree College, Mangalkote, Panchanantala, Khudri Dighi, East Burdwan, West Bengal, India.
2Sukul Institute of Homeopathic Research, Santiniketan, West Bengal, India.
3Department of Zoology, Visva-Bharati, Santiniketan, West Bengal, India.
4Department of Geography, Panihati Mahavidyalaya, Sodepur, Kolkata, India
5Integrated Science Education and Research Centre, Visva-Bharati, Santiniketan, West Bengal, India
*E-mail for correspondence: ncsukul@gmail.com, htpps://orcid.org/0000-0001-5888-3369
Dr. Raj Kumar Singh Ph.D., Email. ID: rajfps@gmail.com, htpps://orcid.org/0000-0002-9787-6177
Sumit Ghosh M.Sc., Email. ID: sumitghosh7602@gmail.com, htpps://orcid.org/0000-0002-3766-9344
Prof. Nirmal Chandra Sukul Ph.D., Email.ID: ncsukul@gmail.com, htpps://orcid.org/0000-0001-5888-3369
Dr. Nivedita Pande Ph.D Email ID: niveditapande2017@gmail.com
Dr. Anirban Sukul Ph.D Email ID: anirsukul@gmail.com
Dr. Mahasweta Nandi Ph,D., Email. ID: mahasweta.nandi@visva-bharati.ac.in, htpps://orcid.org/0000-0002-3114-4774
Ananya Pal M.Sc., Email. ID: palananyachem@gmail.com, htpps://orcid.org/0000-0002-2761-2600
Manjula Pal M.Sc., Email. ID: palmanjula.chem@gmail.com, htpps://orcid.org/0000-0001-9756-3762
Keywords: High dilutions, Hydrogen bonding strength, Free water molecules, Electronic spectra, Vibrational spectra.
Received: July 28, 2021
Revised: October 4, 2021
Accepted: November 15, 2021
Published: April 25, 2022
Abstract
High dilutions (HD) of drugs used in homeopathy are too dilute to contain original drug molecules. Clinical and experimental evidence shows, however, that the HDs produce specific biological effects. Water structures in HDs are thought to be responsible for those effects. In our earlier experimental studies, we defined the water structure in terms of free water molecules (FWM) and the hydrogen bond strength (HBS) of the water hydroxyl in the aqueous ethanol solvent medium of HDs. The objective of this preliminary study is to further confirm the components of water structure by electronic (ES) and vibrational spectroscopy (VS). HDs, prepared by serial dilution of a drug followed by succussion, are called potencies. Three common homeopathic drugs, Bryonia alba, Rhus toxicodendron and Thuja occidentalis, and three potencies of each drug were analyzed by ES and VS using appropriate statistics. The results show that the potencies tested differ from each other with respect to FWM and HBS of the water hydroxyl. We conclude that the drugs could modify the water structure in an EtOH water solution, and this modification would continue to exist in HDs beyond the Avogadro number. Original drug molecules influence the HBS in the HDs.
Introduction
The therapeutic system of homeopathy, first introduced by Dr. Samuel Hahnemann in 1796 (Hahnemann S,1833a; Hahnemann S,1833b), uses highly diluted drugs (HDs). Most of these HDs are too dilute to contain original drug molecules. For this reason, homeopathy has been regarded as scientifically unsound. There is experimental evidence, however, that shows that HDs produce effects in humans, animals, plants and even in enzymes in a cell-free medium (Sukul and Sukul, 2004). Experimental studies reveal that water structures in HDs of drugs are mainly responsible for producing the biological effects (Mahata CR, 2013; Rey I, 2003, Rey I, 2007). We elucidated the water structure in HDs in terms of free water molecules and the hydrogen bond strength of OH of water from the experimental results obtained by NMR, FT-IR, Raman and Electronic Spectroscopy, and also Differential Scanning Calorimetry and Thermogravimetry (Konar et at., 2016; Chakraborty et at., 2014; Ghosh et at., 2021; Sukul et at., 2002; Mondal et at., 2020).
HDs are prepared by serial dilution of a drug followed by mechanical agitation or succussion in several steps. These HDs are called potencies, and the number of dilutions applied for the preparation of the potencies indicate their rank (Sukul and Sukul, 2004; Boericke and Tafel,1920; GOI, 2007). In the present study we have used three potencies: 6cH, 12cH and 30cH for three common drugs, Bryonia alba, Rhus toxicodendron and Thuja occidentalis. Our objective is to see whether these potencies show any difference from each other with respect to hydrogen bonding strength (HBS) of the water hydroxyl and free water molecules. To achieve this objective, we have analysed the HDs by electronic and vibration spectroscopy. This is a preliminary study.
Highlights
Water structures in high dilutions (HD) of drugs used in homeopathy have been suggested by some scientists as possible active agents for their specific therapeutic effects. Using NMR, FT-IR, UV Spectroscopy, DSC and Thermogravimetry, we defined the water structure in terms of free water molecules and hydrogen bond strength of OH of water in an EtOH water mixture. This study further confirms our earlier results.
Materials and Methods
Drugs
Three potencies of each of the three homeopathic drugs, Rhus toxicodendron, Bryonia alba and Thuja occidentalis,were tested in this study. The potencies used were 6cH, 12cH and 30cH. Mother tinctures (MT) or alcoholic extract of these drugs, were also tested. All the drug samples were prepared in 90% EtOH. The drugs were supplied at our request by a well-known homeopathic pharmacy, Hahnemann Publishing Company (Hapco) Kolkata, established in 1917. The pharmacy also provided the same blank solvent medium (90% EtOH) used to prepare the drugs. All the drugs were prepared for our research in January 2021. Using UV absorption spectra and a standard graph in our laboratory, the percentage of the ethanol contained in all the samples was determined to be 90%.
UV-Spectra
UV-Spectra of all the test samples were obtained in our laboratory by a UV-VIS Spectrophotometer (Shimadzu, UV-VIS 1900i, Software Lab Solutions UV-VIS) at a room temperature of 24oC. The blank solvent medium was used as a baseline for all the test samples in the wavelength range of 200-300 nm, scan speed medium and a data interval of 0.5 nm. UV-Spectra of the mother tinctures (MT-θ) of each of the three drugs, Rhus tox-θ, Bryonia-θ and Thuja-θ were taken in the same wavelength region. An average of 5 spectra of each sample was recorded and the margin of error (MOE) between paired spectra was calculated to see whether the difference between the paired spectra was significant. MOE was calculated using the following equation: MOE = Z*×σ/√n where Z* = Z score, σ = SD, n = number of samples (Banerjee PK, 2004; Rumsey DJ, 2016).
Fourier Transform Infrared (FT-IR) Spectra
Fourier Transform Infrared (FT-IR) spectra of the drug samples were measured at 24oC on a Shimadzu IR Affinity -1S Fourier Transform Infrared (Spectrum two) using the attenuated total reflection (ATR) technique. The energy resolution was 0.5 cm-1. The baseline was corrected for atmospheric humidity and CO2. One drop of each sample was put in the sample groove, and the tip of a single reflection pure diamond crystal was brought in contact with the sample drop to record the whole spectrum in the wave number range of 4000 to 500 cm-1. We focused mainly on OH-stretching and OH-bending (v2) bands. Forty-five scans were averaged for each spectrum to improve signal to noise ratio. The ratio of absorbance intensities (A) at 3240 cm-1 (strong hydrogen bonding) and 3360 cm-1 (weak hydrogen bonding) was determined for quantifying the contour shape of the OH-stretching band (Burikov et at., 2010). The same was done for the OH-bending (v2) band. Here the ratio is between A 1580 cm-1 and 1690 cm-1. The results are presented for the stretching (Figure 7, 9) and the bending band (Figure 8, 10), respectively. The ratio values were determined after normalization of the spectra for OH-stretching and OH-bending bands.
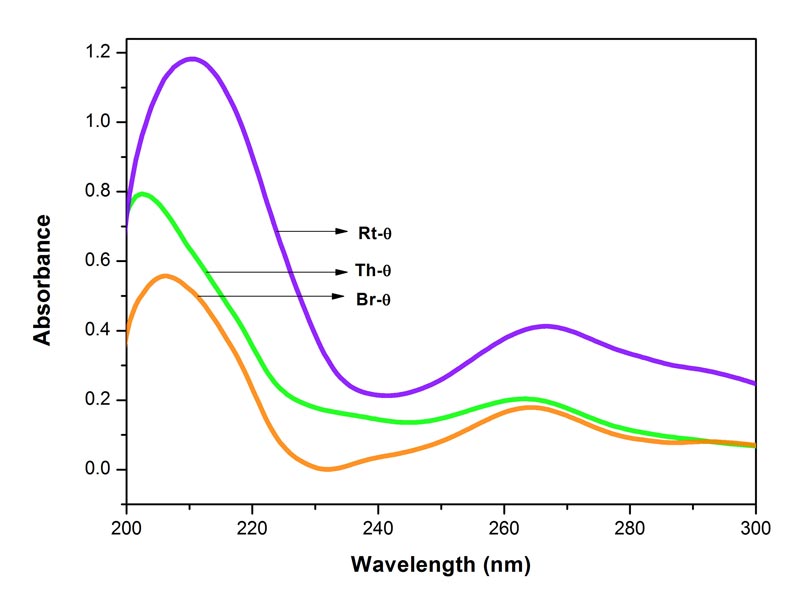
Figure 1: Electronic spectra of Bryonia alba, Rhus toxicodendron and Thuja occidentalis
mother tinctures (θ) in 90% EtOH. Each spectrum represents an average of 5 spectra, baseline was 90% EtOH. MOE between Br-θ and Rt-θ 0.0016%, between Rt-θ and Th-θ 0.0011%, and between Br-θ and Th-θ 0.0010%. Since the MOE is very low, the difference between the paired spectra is significant.
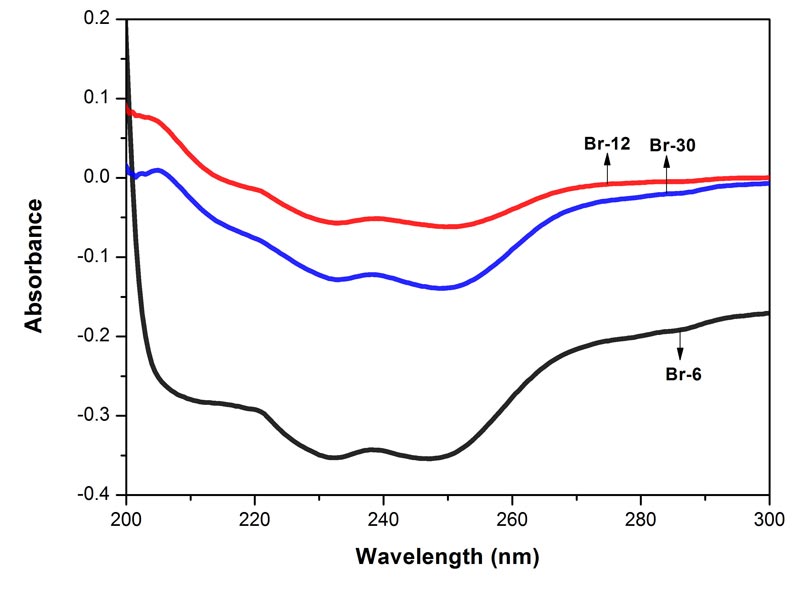
Figure 2: Electronic spectra of the three potencies of Bryonia alba in 90% EtOH. Each spectrum represents an average of 5 spectra, baseline was 90% EtOH. MOE between Br-6 and Br-12 0.0015%, between Br-6 and Br-30 0.0012%, and between Br-12 and Br-30 0.0002%. Since the MOE is very low, the difference between the paired spectra is significant.
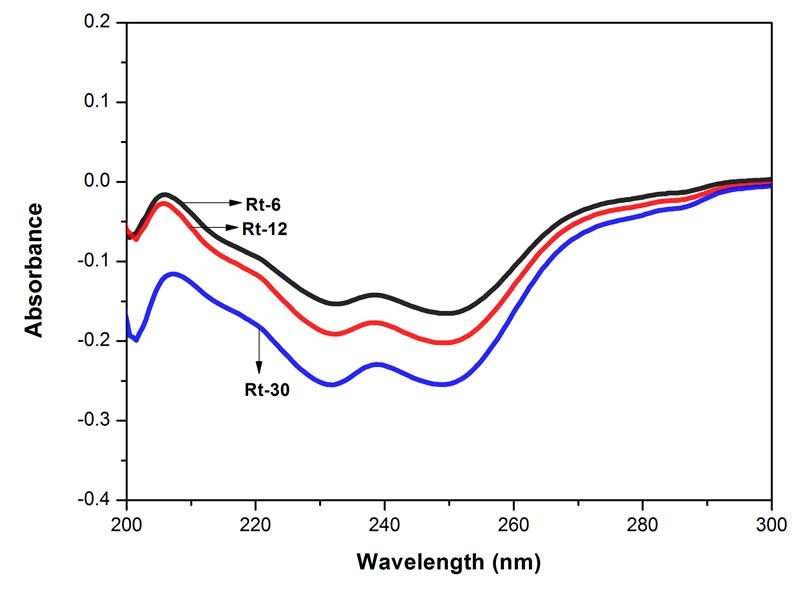
Figure 3: Electronic spectra of the three potencies of Rhus toxicodendron in 90% EtOH. Each spectrum represents an average of 5 spectra, baseline was 90% EtOH. MOE between Rt-6 and Rt-12 0.00000%, between Rt-6 and Rt-30 0.0002%, and between Rt-12 and Rt-30 0.0001%. Since the MOE is very low, the difference between the paired spectra is significant.
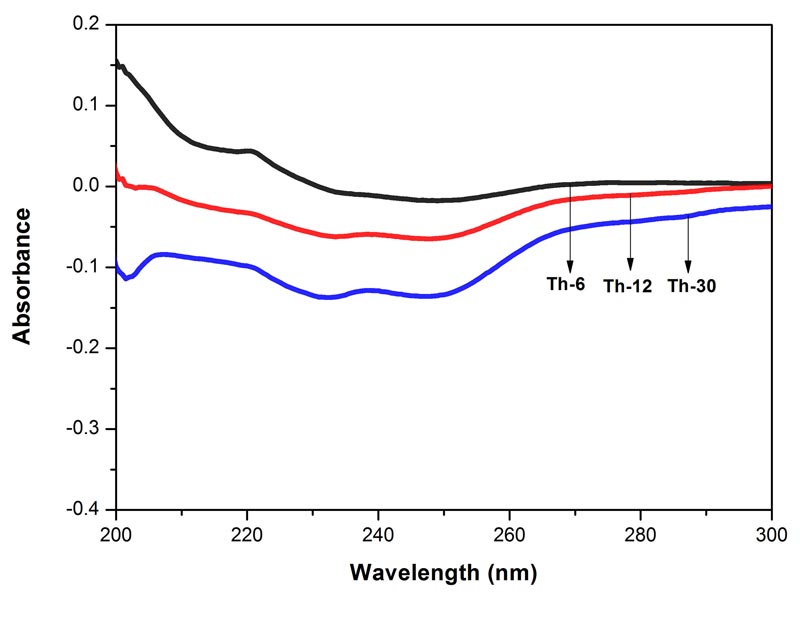
Figure 5: Histogram showing frequency shift of OH-stretching band in water, EtOH and different potencies, 6, 12 and 30cH, of Bryonia alba, Rhus toxicodendron, and Thuja occidentalis, all in 90% EtOH, except water.
Results
Electronic Spectra
The spectra of the three potencies of each of the drugs show both positive and negative absorption (Figures 1-4). The spectra of the mother tincture of each of the three drugs show positive absorption. All the spectra show differences from each other with respect to pattern and intensity. MOE values are given in the legends to each of the figures. Since the values are very low the difference between the paired spectra is significant.
FT-IR Spectra
The frequency at the peak of each OH-stretching band is plotted against the test samples in Figure 5. Water shows the lowest frequency. The three drugs and the potencies of each drug show differences from each other with respect to the peak frequency of the OH-stretching band (Figure 5).
The maximum frequency of the v2 band (OH-bending) is plotted against the test samples. Water shows the lowest frequency. All three drugs and their potencies differ from each other with respect to the peak frequency of the v2 band (Figure 6). The OH-stretching band was normalized for the three potencies of Bryonia alba, Rhus toxicodendron, Thuja occidentalis and their MTs (Figure 10). Ethanol and water were included in each case. The ratio values for both OH-stretching (Figure 7) and OH-bending bands (Figure 8) differ from each other in the potencies of the three drugs and their MTs (Figures 9,10). The ratio values of MTs are always higher than their corresponding potencies (Figures 9,10).
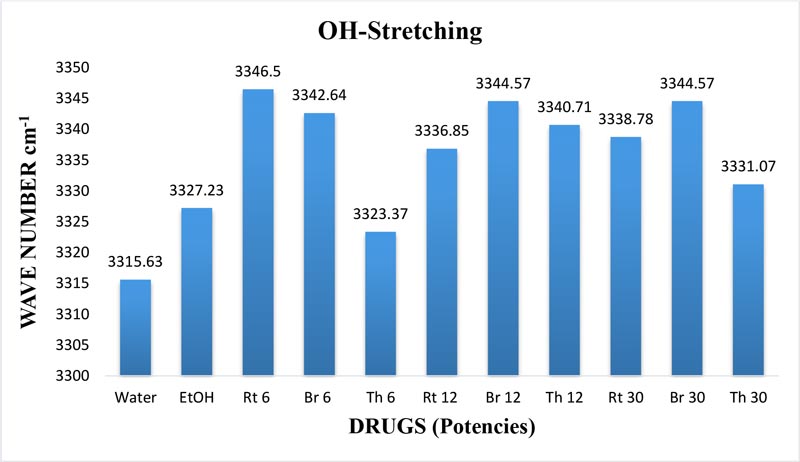
Figure 5: Histogram showing frequency shift of OH-stretching band in water, EtOH and different potencies, 6, 12 and 30cH, of Bryonia alba, Rhus toxicodendron, and Thuja occidentalis, all in 90% EtOH, except water.
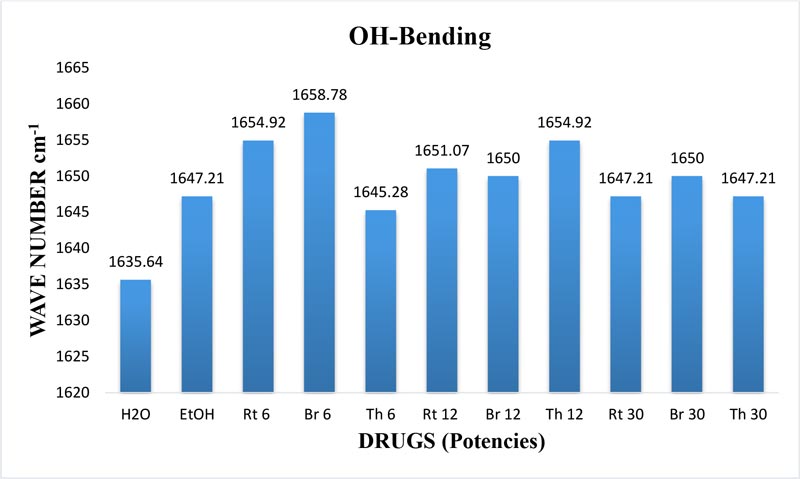
Figure 6: Histogram showing frequency shift of OH-bending (v2) band in water, EtOH and different potencies, 6, 12 and 30cH, of Bryonia alba, Rhus toxicodendron, and Thuja occidentalis, all in 90% EtOH, except water.
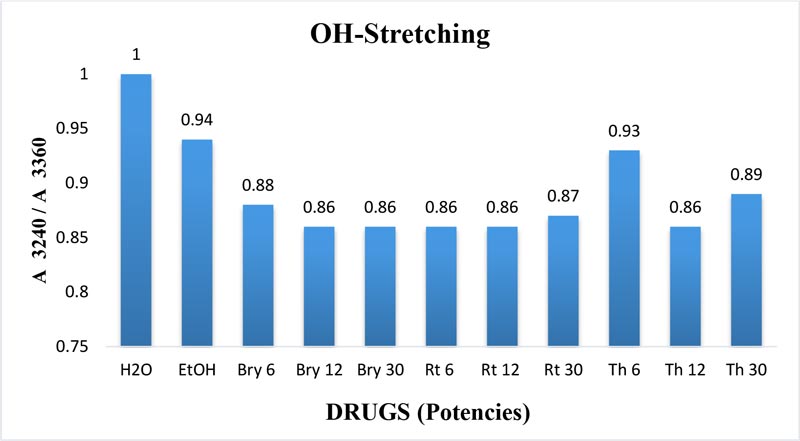
Figure 7: Ratio of absorbance intensities of OH-stretching band of three potencies, 6, 12 and 30cH, of Bryonia alba, Rhus toxicodendron, and Thuja occidentalis, in 90% EtOH at wave number 3240 cm-1 and 3360 cm-1. 90% blank EtOH and water are also included. Calculation was done after normalization.
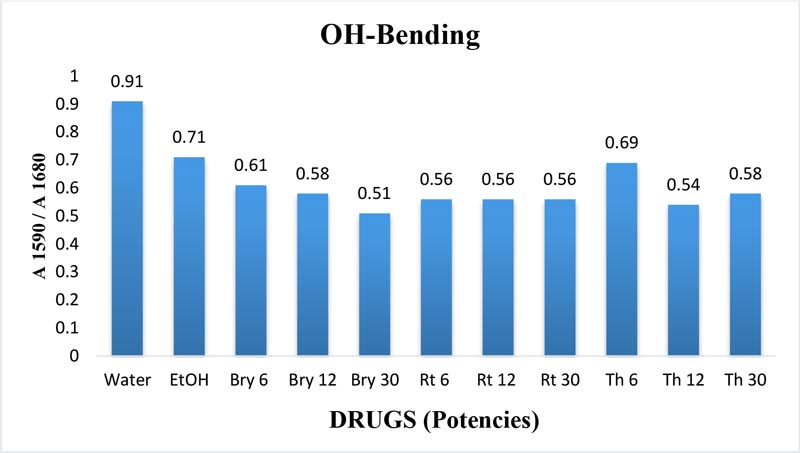
Figure 8: Ratio of absorbance intensities of OH-bending (v2) band of three potencies. 6, 12 and 30cH, of Bryonia alba, Rhus toxicodendron, and Thuja occidentalis in 90% EtOH at wave number 1590 cm-1 and 1680 cm-1. 90% blank EtOH and water are also included. Calculation was done after normalization.
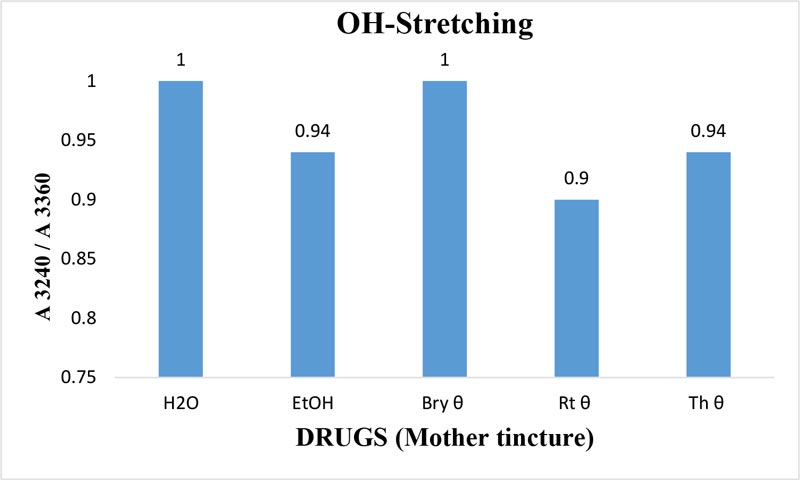
Figure 9: Ratio of absorbance intensities of OH-stretching band of Bryonia alba, Rhus toxicodendron, and Thuja occidentalis MTs in 90% EtOH at wave number 3240 cm-1 and 3360cm-1.90% blank EtOH and water are also included. Calculation was done after normalization.
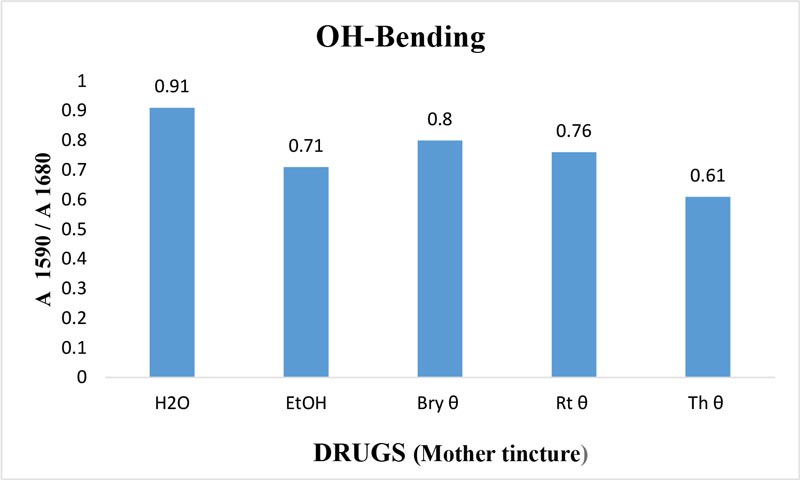
Figure 10: Ratio of absorbance intensities of OH-bending (v2) band of Bryonia alba, Rhus toxicodendron and Thuja occidentalis MTs in 90% EtOH at wave number 1590 cm-1 and 1680 cm-1. 90% blank EtOH and water are also included. Calculation was done after normalization.
Discussion
Electronic Spectra
Molecules of a test sample absorb or emit electromagnetic radiation due to changes in the electronic arrangement or their electronic energy. Potencies of the three homeopathic drugs and their ethanol medium contain only two types of molecules, water and ethanol. But the spectral pattern and intensities of absorption differ from each other. This means that the contents in the test samples are not identical. It is known that ethanol and water do not form a homogeneous mixture and contain different proportions of ethanol aggregates, water aggregates and non-hydrogen bonded water or free water molecules (Dixit et at., 2002; Yoshida and Yamaguchi, 2001). These factors might have contributed to the different spectral patterns of the test samples. The negative absorption as observed in the test samples indicates that the intensity of the transmitted light is higher than that of the incident light. The phenomena have been reported to occur in the electronic spectra of water, ethanol and chloroform (Ji et at., 2016). The water and ethanol aggregates may have played some role in this matter.
FT-IR Spectra
The OH-stretching band includes both water and EtOH. EtOH self-associates, forming different structures of dimers, trimmers and multimers through hydrogen bonds. Some non-hydrogen bonded free units also occur (Schwager et at.,1996). All the drug samples show higher frequencies than EtOH alone except Thuja 6, although the concentration of EtOH in all the test samples was the same (90%, Figure 5). The higher frequency indicates EtOH multimers (Coggehal and Saier, 1951). Variation in frequency in different drug samples may be due to variation in free water molecules, and the aggregates of EtOH and water (Dixit et at., 2002; Yoshida et at., 2001). Higher ratio values indicate more bound molecules, and lower ratio values indicate more free units (Burikov et at., 2010). MTs have stronger hydrogen bonding (Figure 9) than their corresponding potencies (Figure 7) as observed in the OH-stretching band. The same is true for the OH-bending band (Figure 10). This means that all MTs have more bound molecules than their potencies. Potencies have more free units than their MTs.
The v2 band exhibits the bending frequency of water alone. Mizuno et at (1995) demonstrated that the v2 band shows an increase in blue shift with an increasing concentration of EtOH. The authors further confirmed the results by the NMR experiment showing the chemical shift of the water proton. In our study, the variation in the frequency of the v2 band also indicates the variation in the hydrogen bond strength in water hydrogen in different drug samples because the blue shift indicates stronger hydrogen bond strength in water hydrogen (Mizuno et at., 1995). Hydroxyl hydrogen forms the hydrogen bond that shows higher bonding strength in different potentized drugs without any change in the concentration of EtOH. So, we can assume that this increase in hydrogen bond strength of the water hydrogen results from the original drug molecules in the MTs of the potencies.
Since we have a very high concentration of EtOH in all test samples, the water molecules could occur around the hydroxyl group of EtOH to form hydrogen bonds with those OH groups. Our study provides further evidence that the variation in hydrogen bond strength in the water hydroxyl occurs in the water aggregates of EtOH mixture. Hydrogen bonding strength plays an important role in different potentized drugs and in different potencies of the same drug. Thus, we can define the water structure in homeopathic potencies in terms of the relative proportion of free water molecules, the hydrogen bond strength of water hydroxyl in EtOH water mixture, and the free units of EtOH and water clusters in said mixture. Mechanical agitation/succussion generates some stable nanobubbles in the EtOH water medium (Ushikubo et at., 2010). However, the same rank of the potency (6,12 or 30) of different drugs shows variation in spectra although it has received the same number of succussions.
Burikov et at. (2010) demonstrated that hydrogen bonding strength in the water hydroxyl is higher, around 15-20% w/w EtOH concentration in EtOH water mixture. According to the authors, this enhanced hydrogen bonding strength is due to the presence of transient EtOH hydrates. Above that concentration of EtOH, the hydrogen bonding strength in the water hydroxyl is due to the formation of chain aggregates of EtOH water molecules. The authors further concluded that in an EtOH water mixture there are 4 types of components: these are pure water, water-rich hydrate (EtOH.5H2O), EtOH-rich hydrate (EtOH.1H2O) and pure EtOH. In our study the EtOH concentration is fixed at 90% v/v. But there is a variation in the ratio of absorbance intensities (Figure 7). This shows that the hydrogen bonding strength of the water hydroxyl varies from drug to drug and potency to potency of the same drug. This variation may be attributed to the influence of the original drug molecules in the MT, and serial dilution and succussion applied to prepare the potency rank.
Conclusions
1. Serial dilution followed by succussion increases the hydrogen bonding strength of the water hydroxyl in an EtOH water mixture, irrespective of the original substances used to prepare the potencies.
2. Hydrogen bonding strength depends on the chemical physical nature of the original drug.
3. Number of serial dilutions followed by succussion do not increase hydrogen bonding strength proportionately in a linear form in the potency ranks.
4. MTs have stronger hydrogen bond strength than their corresponding potencies. This means that potencies have more free OH groups than their corresponding MTs.
5. Potencies have variations in free OH groups or free water molecules.
Discussion with Reviewers (DWR)
Reviewer 1: The manuscript is lacking any indication of the error margin in these measurements, making it difficult to interpret the “UV-spectra.”
Answer: Margin of error (MOE) was calculated from the following formula (Rumsey DJ, 2016). MOE = Z*×σ/√n where Z* = Z score, σ = SD, n = number of samples.
This was mentioned under “Materials and Methods.”
Reviewer 2: Nanobubbles are produced during mechanical agitation of drug solutions. This leaves a lot of room in the interpretation of the results.
Answer: Mechanical agitation/succussion generates some stable nanobubbles in the EtOH water medium (Ushikubo et at., 2010). However, the same rank of the potency (6,12 or 30) of different drugs shows variation in spectra although it has received the same number of succussions.
This was mentioned under “Discussion.”
References
Banerjee PK (2004). Introduction to biostatistics (a textbook of biometry). New Delhi. S. Chand & company pvt. Ltd
Boericke and Tafel (1920). American Homeopathic Pharmacopeia. 9th ed. Philadelphia.
Burikov S, Dolenko T, Patsaeva S, Starokurov Y, Yuzhakov V (2010). Raman and IR spectroscopy research on hydrogen bonding in water-ethanol system. Molecular Physics 108:2427-2436. https://doi.org/10.1080/00268976.2010.516277
Chakraborty I , Dutta S, Sukul A ,Chakraborty R, Sukul NC (2014).Variation in free and bound water molecules in different homeopathic potencies as revealed by their Fourier Transform Infrared spectroscopy(FTIR). Int J High Dilution Res. 13:189. https://doi.org/10.51910/ijhdr.v13i49.716
Coggeshall ND, Saier EL (1951). Infrared Absorption Study of Hydrogen Bonding Equilibria.J.Am.Chem.Soc. 73:5414. https://doi.org/10.1021/ja01155a118
Dixit S, Crain J, Poon WCK, Finnery JL, Soper AK (2002). Molecular segregation observed in concentrated alcohol-water solution. NATURE 416: 829-832. https://doi.org/10.1038/416829a
Ghosh S, Singh RK, Sukul NC, Pande N, Sukul A (2021). High dilutions of drugs show distinct variation from each other in their electronic spectra. Ind. J. Natural Sci. 12 (67), 32828-32833.
Government of India (2007). Homeopathic Pharmacopoeia of India. New Delhi. Government of India, Controller of Publications.
Hahnemann S (1833a). Organon of Medicine. 5th ed. Translated by R E Dudgeon (1893). Indian ed. (1994). Pratap Medical Publishers Pvt Ltd, New Delhi. 224.
Hahnemann S (1833b). Organon of Medicine. 6th ed. Translated by W Boericke (1921). I J Publishers, Delhi. 314.
Ji Y, Ji Z, Yao M, Qian Y, Peng Y (2016). Negative absorption peaks in the ultraviolet-visible spectrum of water. Chemistry Select 1: 3443-3448. https://doi.org/10.1002/slct.201600587
Konar A, Sarkar T, Chakraborty I, Sukul NC, Majumdar D, Singha A, Sukul A (2016). Raman Spectroscopy reveals variation in free OH groups and hydrogen bond strength in ultra high dilutions. Int J High Dilution Res. 15: 2. https://doi.org/10.51910/ijhdr.v15i2.819
Mahata CR (2013). Dielectric dispersion studies of some potentised homeopathic medicines reveal structured vehicle. Homeopathy. 102:262-267. https://doi.org/10.1016/j.homp.2013.07.003
Mizuno K, Miyashita Y, Shindo Y,Ogawa H (1995). NMR and FT-IR studies of Hydrogen Bonds in Ethanol-Water Mixtures. J.Phys.Chem. 99:3225-3228. https://doi.org/10.1021/j100010a037
Mondal P, Sukul NC, Dey A, Bhattacharjee A, Sohel MA, Sengupta A, Sukul A (2020). High dilutions of two drugs induce changes in crystal water structure of lactose as revealed by thermogravimetry and differential scanning calorimetry. Indian J Biochem Biophys. 57: 467-470.
Rey I (2003). Thermoluminescence of ultra-high dilutions of lithium chloride and sodium chloride. Phys. A. 323: 67-74. https://doi.org/10.1016/S0378-4371(03)00047-5
Rey I (2007). Can low-temperature thermoluminescence cast light on the nature of ultra-high dilutions? Homeopathy. 96: 170-174. https://doi.org/10.1016/j.homp.2007.05.004
Rumsey DJ (2016). Statistics For Dummies (2nd ed.) John Wiley & Sons, 2016 USA
Schwager F, Marand E, Davis RM (1996). Determination Self-Association Equilibrium Constant of Ethanol by FTIR Spectroscopy. J.Phys.Chem. 100: 19268-19272. https://doi.org/10.1021/jp9613448
Sukul NC, Sukul A (2004). High dilution effects: Physical and biochemical basis. Dordrecht. The Netherlands: Kluwer Academic Publisher.
Sukul NC, De A, Sukul A, Sinhababu SP (2002). Potentized Mercuric chloride and Mercuric iodine enhance α-amylase activity in vitro. Homeopathy. 91: 217-220. https://doi.org/10.1054/homp.2002.0051
Ushikubo FY, Furukawa T, Nakagawa R, Enari M, Maniko Y, Kawagoe Y, Shiina T, Oshita S (2010). Evidence of the existence and the stability of nano-bubbles in water. Colloids and Surface A: Physiochem. Eng. Aspects. 361: 31-37 https://doi.org/10.1016/j.colsurfa.2010.03.005
Yoshida K, Yamaguchi T (2001). Low-frequency Raman Spectroscopy of Aqueous Solutions of Aliphatic Alcohols. Z. Naturforsch. 56a: 529-536. https://doi.org/10.1515/zna-2001-0801