
 Analysis with Gas Discharge Visualization of the Possible Effects on Water
in Different Containers
Analysis with Gas Discharge Visualization of the Possible Effects on Water
in Different Containers
Abella A1, Amorós A1, González M1*, del Corral A1 i Peña J1
*ELISAVA, Barcelona School of Design and Engineering, La Rambla 30-32, 08002, Barcelona, Spain.
*Correspondence E-mail: mgonzalez@elisava.net
Keywords: water; Gas Discharge Visualization; electrode; vortex; structure
Keywords: Surface Barrier; Surface Cover; Gravel; Evaporation
Received September 7, 2016; Revised March 28, 2017; Accepted May 15, 2017; Published July 31, 2017; Available Online July 31, 2017.
Abstract
Water has some unique properties which are only now beginning to be understood. One of these is the memory of water. In fact, water can retain some properties of materials that were once in contact with it. This might be due to formation of structured water. Specialized bottles that claim to enhance this property have emerged in the market.
The current study explores the possible effects of shape, volume, material and color of different containers used for storing water. Additionally, we have also investigated and compared the properties of water filled in some so-called “vitalizing” bottles versus that filled in standard containers.
Using the computerized biophysical Gas Discharge Visualization (GDV) method, we demonstrate significant differences among various types of containers and conclude that the color, shape, material and volume of a container can influence the properties of water.
Introduction
The current study explores the effects of shape, material, volume and color of the container used to store water. Specialized containers such as “vitalizing” bottles, for example the Vitbot (Web ref. 1, Jurendic and Pavnova, 2012), Flaska (Web ref. 2), Ying and Yang (Web ref. 3), that spontaneously form a vortex within the water were also compared with standard containers (Figure 1).
The study was carried out using electrophotonic analysis. This technology is based on the Gas Discharge Visualization (GDV) (Web ref. 4), a method of monitoring water properties based on measuring and computerized processing of photon emission stimulated by electromagnetic field from the water surface (Korotkov, 2010).
The results presented in this paper reveal that there were significant differences observed in the electromagnetic properties of water depending on the type of container used, as well as on the factors such as color, volume, material and shape. Present studies support the ideas proposed in previous studies (Pollack, 2013, Emoto 2003, Chara et al. 2011) indicating that alteration in the structure of water affects its properties.
Materials and Methods
Gas Discharge Visualization Device:
The study of electrophotonic parameters of liquids has been carried out using an EPI/GDV device, Bio-Well, with water electrode, a commercially available instrument (Bio-Well, 2016) (Figure 2). It is important to mention that the electrode testing, with the Bio-well using 5.2.3.0 professional software, does not determine the quality of water, but measure the perceived influence of the environment on the water. For this reason it is important to monitor the temperature of the water in the specific environment and always use the same type of water. In order to have the similar experimental conditions, these experiments were carried out inside an isolating lead box (445 x 460 mm) with a lead wall of 4 mm and medium-density fiberboard of 10 mm (see Figure 2). Furthermore, in order to control the temperature during the experiments, the temperature of the room was kept at a constant at 24°C.
Description of Experimental Parameters:
An electrode accessory was added to the Bio-Well device (Web ref. 5), a water sensor that analyzes the different parameters such as intensity, energy and area. The intensity parameter corresponds to the flow of glowing photons reordered by the CCD matrix of the web camera containing the GDV recorder. The sensor analyzed energy in the body functions by taking measurements in different parts. The scale is 0 to 100 (0-20 low, 20-60 normal and 60-100 high) (Oliva AM, 2014). The area is the number of light-struck pixels digitized in the computer (Korotkov et al., 2010). It shows the level of adaptation of the water to internal and external influences (environment). All of these parameters were analyzed; however, we have only presented the results pertaining to the area as all three parameters have shown the same pattern.
Measurements and Statistical Analysis:
Each measurement was taken for a period of 30 minutes, plus the 3 minutes for calibration, equivalent to 33 minutes in total and 360 GDVgrams. After the three repetitions, 1080 values were obtained, divided in three groups. Each measurement was performed three times in the same conditions in consecutive days, in order to find the average results and standard deviations and see if the experiments were reproducible. For this purpose, the statistical method of Mann-Whitney test was used. According to this test, the p-value indicates the probability of obtaining an equal or more extreme result than the one observed. The p-value equal to or less than 0.05 is considered to be significant. These measurements were taken without interruption, so when an experiment with a particular packaging ended, the bottle was cleaned with water, left to dry and filled up again for further testing.
Description of Containers:
Both standard containers, such water bottles like spray bottles, oilers, Solan de Cabras (Web ref.6) and Bezoya (Web ref.7) and laboratory containers as Erlenmeyer flasks and beakers, as well as vitalizing bottles commercialized as Vitbot, Flaska, Ying and Yang were used. The characteristics of three groups of containers are listed in Table 1 and shown in Figure 1.
The main features of the vitalizing bottles that have been used are explained below:
Vitbot bottles, with their ovoid design with Phi proportions, allow the formation of an internal vortex and as a result, the liquids contained in Vitbot bottles are said to regain and preserve their vitality. To produce the internal vortex, the bottle was shaken for 1 minute at 120 rpm before the analysis, and then it was inserted into the lead box to take the measurements.
Flaska is a reusable health- and environment-friendly glass water bottle. These bottles are programmed by using the TPS procedure (Technology of Programming Silicon). A bottle programmed in this way changes the vibrational structure of water.
Yang bottles, commercialized by Vitrocuantic, have the objective of achieving dynamization, activation, cicatrization and act as developers of biological growth. Ying bottles seek harmony between relaxations, and help to prevent inflammation by fluidifying the liquids. Both Yang and Ying bottles have encapsulated information.
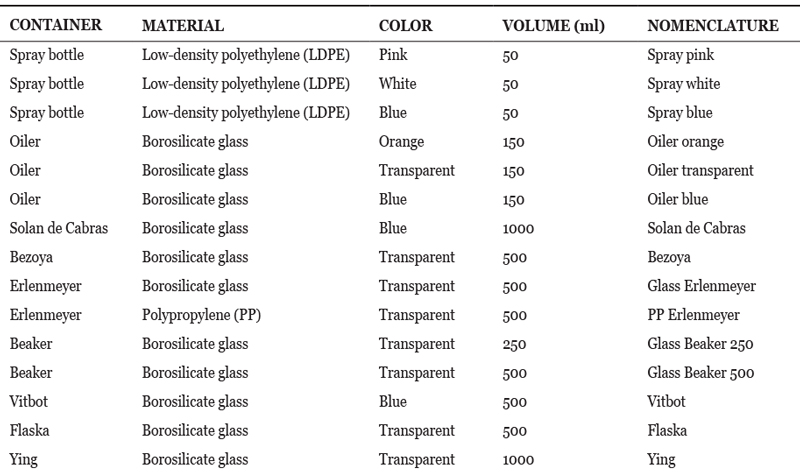
Table 1: Material, color, volume and nomenclature of the containers.
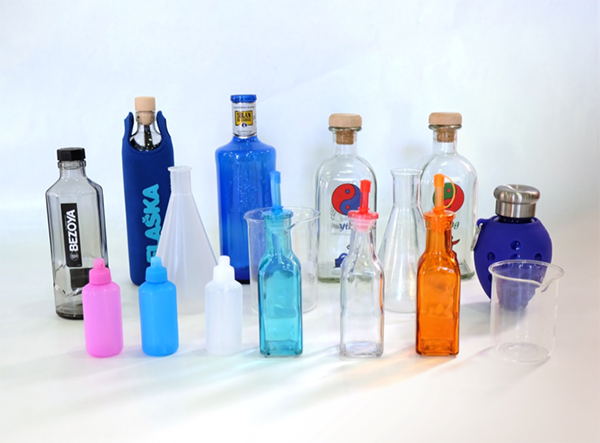
Figure 1: The containers used in different experiments: standard bottles, vitalizing bottles and laboratory containers. From the top to the bottom and from left to right: Flaska, Solan de Cabras, Ying,Yang, Bezoya, PP Erlenmeyer, Glass Beaker 500, Glass Erlenmeyer, Vitbot, Spray pink, Spray blue, Spray white, Oiler blue, Oiler transparent, Oiler orange and Glass Beaker 250
Methodology
The experiments were carried out using non-reused natural mineral water contained in a PET packaging of the brand Aquabona (2.5l). The water used had a constant temperature of 23±0.4ºC during the whole experiment.
The amount of water used introduced in each measurement was determined depending on the volume of the container. The containers used for the experiments that had a volume of 500 ml contained 300 ml of water. For other capacities, the amount of water changed according to the specific volume of the container. So, for instance, for containers of 1000 ml the volume of water was kept at 600 ml; for containers of 250 ml it was 150 ml; for the 150 ml 90 ml and, finally, for containers of 50 ml the volume of water was of 30 ml.
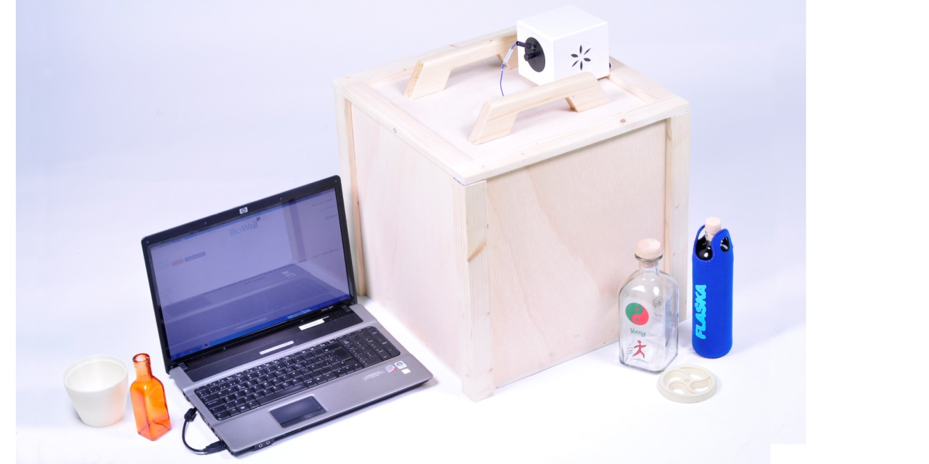
Figure 2: The materials and instruments used in the analysis: computer with Bio-Well software 5.2.3.0, GDV, lead box and containers for the study.
All the experiments started with a calibration of 3 minutes and then GDV up to 350 GDVgrams were measured for each test, for a time of 30 minutes. The EPI/GDV device captured the electro-photonic image every 5 seconds. The data obtained from the area based on the GDVgrams are displayed in the results section.
To obtain data on different containers with respect to material, volume, color and shape, the following strategy was used:
In experiment I, to analyze the effect of the material, containers with the same volume, color and shape, but different material, were used. In this experiment Erlenmeyer containers made of polypropylene (PP) and borosilicate glass were adopted.
In experiment II, beakers of identical shape, material and color, but different volume (250 ml and 500 ml), were used.
The aim of experiment III was to study the effect of color and therefore bottles with the same volume, material and shape but different color were used. The colors selected were neutral white, cold blue and warmer colors, such as pink and orange.
In experiment IV the effect of shape on different containers was analyzed. For this reason bottles with different shapes, but identical material, color and volume, were used to make a valid comparison.
Results and Discussion
As mentioned above, the parameters measured during current investigations were area, intensity and energy. Since the results were similar for these parameters, only the area results were presented in this paper.
Experiment I: Material
This experiment was carried out using Erlenmeyer flasks made of different materials, borosilicate glass and polypropylene, to analyze the influences of these materials on water.
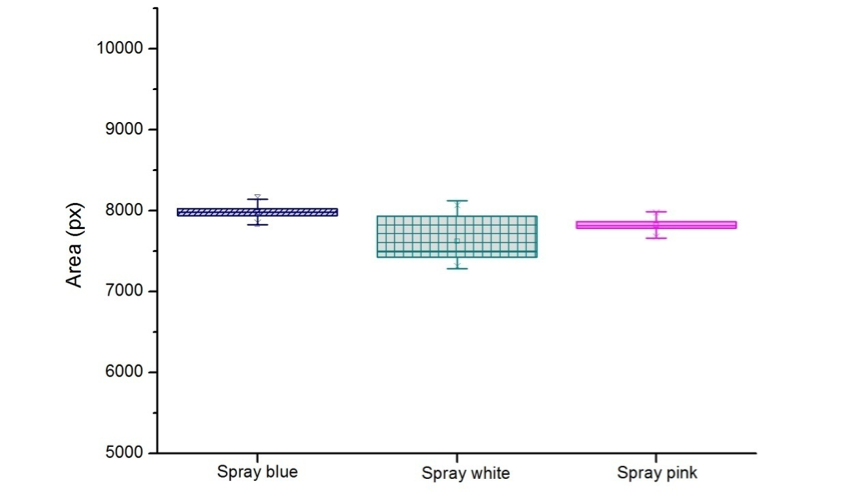
Figure 3: Area in pixels corresponding to different Erlenmeyer.
Results presented in Figure 3 show that the borosilicate glass Erlenmeyer presents higher area values than the polypropylene container (p=0), suggesting that there were significant differences in the properties of water kept in bottles made with different materials.
Experiment II: Volume
The next graph shows the comparison among beakers with a difference in volume but with identical shape, color and material.
As observed in the graph (Figure 4), even though there were seems to be little differences in terms of values, glass beaker 250 ml showed higher values than that of glass beaker of 500ml. Therefore, it can be concluded that the lower volume of the container enhances the area parameter of water.
Experiment III: Color
This experiment consisted of two different tests to analyze the effects of the color of the bottles. The first test used blue, white and pink spray bottles made of low density polyethylene. The second test was carried out using blue, transparent and orange oiler bottles made of borosilicate glass.
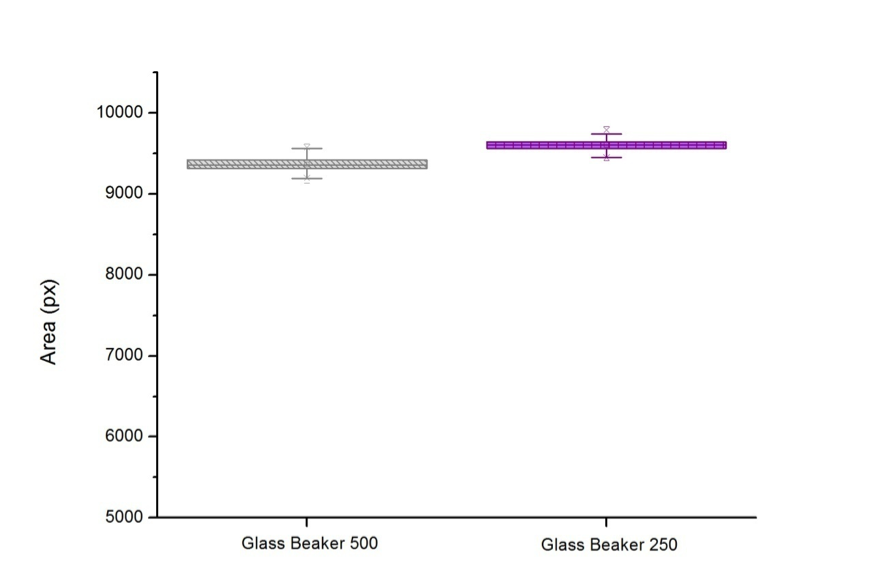
Glass Beaker 500 and Glass Beaker 250: p = 1.341E-05
Figure 4: Area in pixels corresponding to different beakers.
Spray Blue and Spray White: p = 6.867E-01
Spray White and Spray Pink: p = 1.848E-02
Spray Blue and Spray Pink: p = 3.969E-06
Figure 5: Area in pixels corresponding to LDPE spray bottles of different colors.
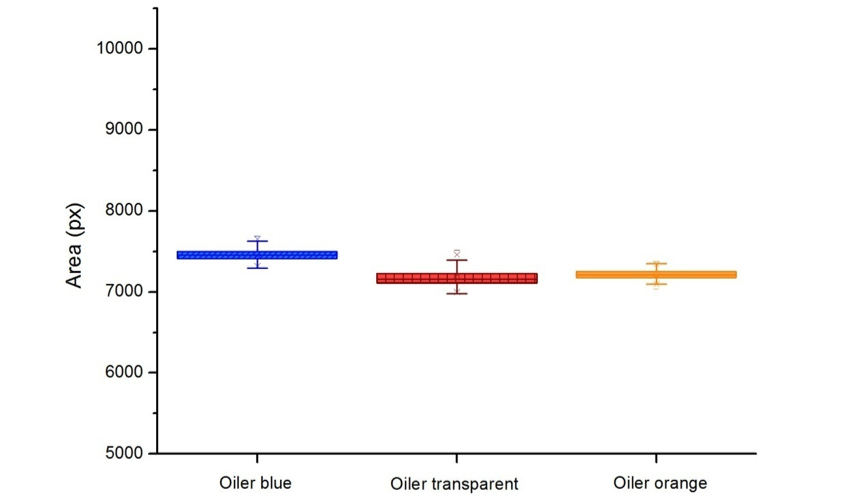
Oiler Blue and Oiler Transparent: p = 3.145E-30
Oiler Transparent and Oiler Orange: p = 2.053E-07
Oiler Blue and Oiler Orange: p = 1.216E-10
Figure 6: Area in pixels corresponding to oiler bottles of different colors. Graphs presented in Figures 5 and 6 show the results obtained by the colors of the bottles. Comparing both graphs, it can be seen that the blue bottles had higher area values than other colors used, which seems to be independent of materials used. Analysis of data also showed that differences in the areas obtained with different colored bottles were significant (p<0.05).
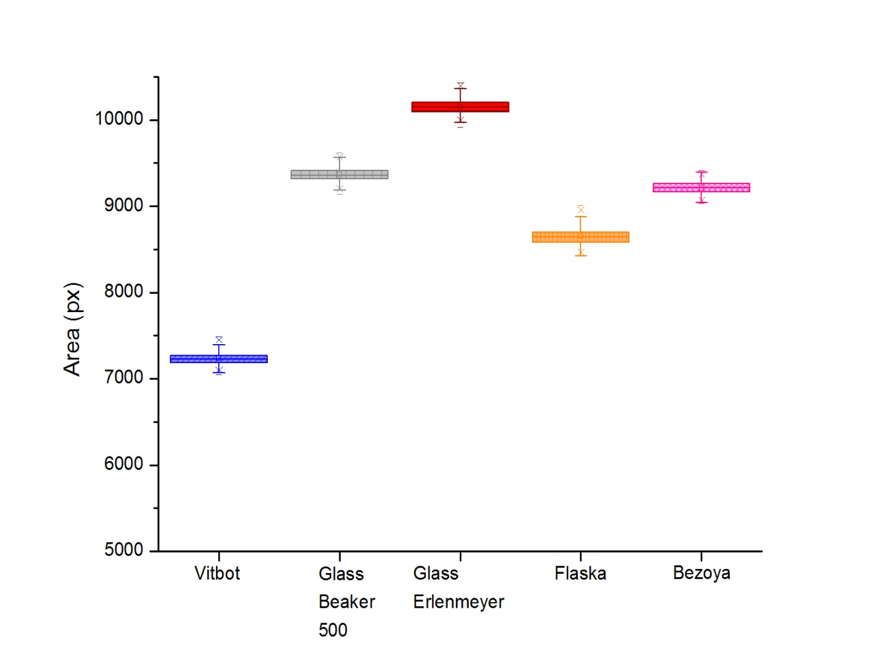
Vitbot and Glass Beaker 500: p = 1.072E-20
Vitbot and Glass Erlenmeyer: p = 2.194E-20
Vitbot and Flaska: p = 1.326E-34
Vitbot and Bezoya: p = 6.513E-09
Glass Beaker 500 and Glass Erlenmeyer: p = 3.283E-19
Glass Beaker 500 and Flaska: p = 1.477E-28
Glass Beaker 500 and Bezoya: p = 1.496E-05
Glass Erlenmeyer and Flaska: p = 4.396E-24
Glass Erlenmeyer and Bezoya: p = 1.842E-01
Flaska and Bezoya: p = 2.417E-09
Figure 7: Area in pixels corresponding to different containers with 500 ml: standard laboratory containers and vitalizing bottles.
Experiment IV: Shape
The aim of this experiment was to analyze the effect of shape and see if there are any differences among standard and vitalizing bottles. All containers were made of borosilicate glass and had a volume of 500 to 1000 ml and were all transparent, except for one that was blue.
In the first graph (Figure 7), bottles hold 500 ml and the bottles from Figure 8 –Solan de Cabras, Ying and Yang- hold 1000 ml of capacity. The graphs present significant differences among all the containers, the smallest differences being between Glass Beaker 500 and Yang. The results show that Erlenmeyer has the highest area value and Vitbot has the lowest one (see Figure 7). It should be pointed out that the Vitbot is a vitalizing bottle, and the only one that generates a vortex because of its ovoid shape and the Phi proportion. Previous studies have shown (Web ref. 1-3, Jurendic and Pavuna, 2012) the importance of the presence of a vortex on structure of water. On the other hand, Erlenmeyer is made of the same material (borosilicate glass) and has the same volume as Vitbot, but its geometry with a flat base doesn’t allow the generation of any vortex.
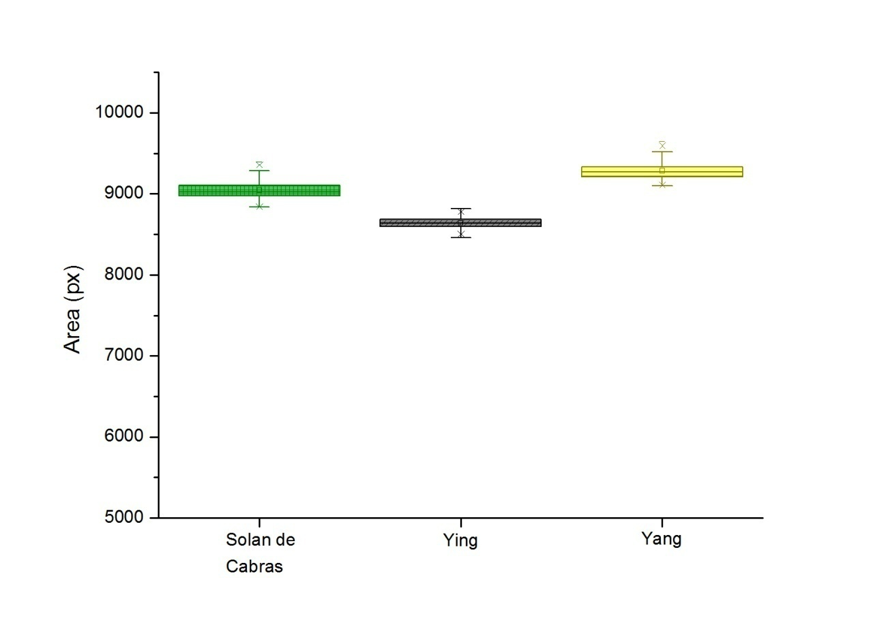
Solan de Cabras and Ying: p = 2.487E-05
Ying and Yang p = 2.459E-08
Solan de Cabras and Yang: p = 1.430E-53
Figure 8: Area in pixels corresponding to different containers with 1000 ml: standard laboratory containers and vitalizing bott
The data set obtained with Bezoya and Yang bottles appear in the graph right below the Erlenmeyer, with the second highest area values. On the other hand, the data on Glass Beaker, the Ying and Flaska bottles fall below the previous two bottles (Figures 7 and 8), having almost similar values.
There are minor overlaps in some containers, but the p-value indicates that there are significant differences in the results obtained from different containers.
Conclusion
The data reported in this paper and analyzed above allows drawing the following conclusions:
• Using a statistical non-parametric Mann-Whitney U test to analyze the results, we show that significant differences occur in the electromagnetic properties of water depending on material, volume, color and shape.
• The material of the container influences the properties of water, as shown by the results obtained by the GDV comparing the Borosilicate Glass and the PP Erlenmeyer.
• The volume of a container does influence significantly the state of the water with minor differences.
• The color of the container does significantly affect the parameter area of the water, whatever the material of the container is. The comparison of the different colors tends to show that blue containers have the highest area values, where warmer colors, like pink or orange, have the lowest.
• The shape of certain containers can raise the parameter area of the water -Erlenmeyer- or can reduce it -Vito-. The main result demonstrates that the Vitbot, with its vortex, generates the lowest area values compared to the other containers. This result could be related to the presence of the vortex mentioned above and the fact that it generates structured water. The Ying and Yang bottles present differences between themselves confirming the claims of their manufacturer Vitrocuantic.
The analysis of these effects (material, volume, color and shape) could be of interest to packaging designers and designers in general and could be taken into account in the production of liquid containers and bottles, such as office water dispensers or everyday carrying bottles (EDC bottles).
Finally, it can be concluded that GDV technology can be a useful tool to compare liquid containers and show the influence of different parameters in a noninvasive and simple way.
Acknowledgments
The authors would like to thank ELISAVA, Barcelona School of Design and Engineering.
References
Jurendic T, Pavuna D (2012). On Fractal Geometry for Water Implosion Engineering. Water 4:82-89
Korotkov K, Orlov D (2010). Analysis of Stimulated Electrophotonic Glow of Liquids. Water 2: 29-43.
Pollack G (2013). The fourth phase of water. Ebner and Sons Publishers: Seattle WA : pp19 – 21.
Emoto M (2003). Messages from water and the universe. Hay House, Inc.: United States 2: 33-54.
Chara O, McCarthy AN, Grigera JR (2011). Crossover between Tetrahedral and Hexagonal Structures in Liquid Water. Phys Lett A 375 (3): 572-76.
Oliva AM (2014). Lo Que Tu Luz Dice. Sirio: Málaga 2:123-131.
Web References
1. Vitbot. (2016). Vitbot. http://www.vitbot.com/ [05-05-2016]Flaska. (2016).
2. Flaska. http://www.flaska.us/the-water-bottle [10-06-2016]
3. Vitrocuantic. (2016). Ying and Yang bottles. http://vitrocuantic.com/ [15-05-2016]
4. Structured Water Unit. (2011). Analysis of Natural Action Water Devices with the EPI / GDV camera. https://www.structuredwaterunit.com/articles/lab-results/analysis-of-natural-action-water-devices-with-the-epi-gdv-camera [11-03-2016]
5. Bio-Well. (2016). Water sensor. http://2www.bio-well.com/gb/products/accessories/ [09-01-2017]
6. Solan de Cabras. (2016). Solan de Cabras. http://solandecabras.es/nuestros-productos/aguas/ [25-04-2016]
7. Bezoya. (2016). Bezoya. http://www.bezoya.es/bezoya-el-agua/ [18-04-2016]