
 Chiral micron-sized H2O aggregates in water: Circular dichroism of supramolecular H2O architectures created by perturbing pure water
Vittorio Eliaa,2, Tamar A. Yinnonb, Rosario Olivaa, Elena Napolia, Roberto Germanoc, Fabrizio Bobbad, Angela Amoresanoa
aDepartment of Chemical Sciences, University ‘‘Federico II’’ Complesso Universitario di Monte. S.Angelo, Via Cintia, I-80126 Naples, Italy.
bK. Kalia, D.N. Kikar Jordan, 90666, Israel.
cPROMETE Srl, CNR Spin off, via Buongiovanni, 49 I-80046 San Giorgio a Cremano (Naples), Italy.
dPhysics Department “E. R. Caianiello”, University of Salerno, 84084 Fisciano (SA), Italy.
1 Author contributions: V.E. conceived and managed the research. R.G. assisted in aforementioned. E.N. prepared the perturbed water samples. R.O. measured the Circular dichroism and Fluorescence spectra. F.B., A.A. and E.N., respectively, carried out the Atomic force microscopy, MALDI-TOF/MS and GC/MS, electric conductivity and pH measurements. T.A.Y. contributed to the theoretical aspects of the research and wrote the manuscript. All authors discussed the results and commented on the manuscript.
2To whom correspondence should be addressed: Vittorio Elia, Dipartimento di Scienze Chimiche Università “Federico II” Napoli, Via Cintia 32, Napoli I-80126, Italy, Tel.+393490843931,E-mail: eliavit@unina.it
3The authors declare no conflict of interests
Keywords: Water; chiral; supramolecular aggregates; structured water; perturbed water
Received June 6, 2016; Revised July 15, 2016; Accepted July 17, 2016; Published: March 2, 2017; Available online: March 3, 2017
Abstract
Creating chiral water aggregates in liquid water challenges scientists. Such aggregates are expected to be significant for many technologies (e.g., chiral sensing or genesis), as well as for the decades-long search for the origins of the pervasiveness of chirality in nature and biohomochirality. Water molecules (H2O) are achiral. The possibility of H2O forming chiral aggregates in liquid water has recently been predicted by computer simulations. Lately, we demonstrated that micron-sized supramolecular H2O aggregates are producible by perturbing pure water, i.e., immersing a hydrophilic membrane in Milli-Q water, stirring the liquid, removing and drying the membrane, and then repeating these steps. In this paper, we report the first experimental evidence that these H2O aggregates are chiral. Circular dichroism spectra of the liquid remaining after removal of the membrane signify an excess of one enantiomer or homochirality. The spectra resemble those of β-sheet ordered biomolecules. Lyophilizing the perturbed water produces a ponderal solid residue. To ensure that impurities (molecules released by the membrane, organic- or bio-contaminants) do not underlie the aforementioned phenomena, we employed state-of-the-art analytic techniques (Matrix-Assisted Laser Desorption/Ionization Time Of Flight and Gas Chromatography both coupled to Mass Spectroscopy, and Ion Chromatography). The perturbed water only contains 10-6 M Fluorine and Sulfate ions released by the membrane and minuscule amounts of contaminants. Our finding that chiral H2O aggregates may form when water flows adjacent to a hydrophilic membrane conceivably may elucidate mirror-symmetry breaking in abiogenesis.
Introduction
Chiral structures, i.e., objects non-superposable on their mirror image, are abundant in nature (1). Some typical ex-amples are: our hands, the α-helix secondary structure of proteins, dextro- or levo-rotatory molecules like glyceraldehyde. The latter cause, respectively, right-handed (dextro) and left-handed (levo) optical rotation. In 1848, Pasteur showed that chiral crystals are composed of chiral molecules, i.e., dextro- or levo-rotatory isomers (enantiomers) or a mixture of these (racemate) (2). He later discovered the selectivity of some microbial metabolism towards a compound’s dextro- or levo-enantiomers, i.e., enantioselectivity (3). Since then, many molecules in natural biosystems have been found to be chiral and to have the same chirality (biohomochirality) (1). For example, deoxyribonucleic acid (DNA) only contains dextro-rotatory carbohydrates. Biohomo-chirality has been extensively studied. As to its origin, numerous hypotheses exist (4), including water playing a role (5) (see SI Appendix, text S1); yet this remains enigmatic.
If indeed water underlies biohomochirality, this has important implications for many processes, e.g., enantioselective syntheses (4). Water molecules (H2O) are achiral. Yet it is conceivable that solvent water containing H2O ordered in chiral structures sets off mirror-symmetry breaking. Some solvents cause such asymmetry (6, 7). For example, optical inactive benzyl and benzophenone when dissolved in levorotatory 2,3-butanediol exhibit optical activity in the n → π* carbonyl absorption (8), presumable because of hydrogen bonding between the solvent and the carbonyl group.
Chiral H2O clusters have been observed in the gas-phase or adsorbed on inert surfaces (9-11), e.g., cyclic water trimers or tetramers. However, in bulk water — to the best of our knowledge — these have not been observed. Yet their formation is plausible: Firstly, helical clusters of H2O forming in liquid water has recently been predicted by computer simulations (12). Secondly, many types of chiral supramolecular aggregates composed of achiral molecules have been realized (13-25). Typical examples are hexahelicene and some other helicenes (13). These are ortho-condensed polycyclic aromatic hydrocarbons. Their basic units are small molecules lacking any asymmetric carbons or stereo-centers, e.g., benzene. The units are angularly annulated, winding either in a right- or left-handed way, resulting in chiral non-planar helical conformations. The basic force underlying the helicity of these polycyclic aromatics stems from the steric strain between their end units. Other important examples are chiral liquid crystals composed of achiral molecules, e.g., bent-core molecules (14-18) or hydrocarbon chain linked mesogenic dimers (19, 20) (see SI Appendix, text S2).
The chirality of aggregates composed of achiral molecules may be due to hydrogen bonding, π-π interactions, attractive or repulsive electrostatic interactions, van der Waals contacts, steric hindrance, and a combination of these or other factors (7, 14, 18). Their chirality may arise in different processes. For example:
- Surfaces may induce chirality (7). At solid/liquid interfaces about 80 percent of physisorbed achiral molecules order chirally (21). The “up-down” asymmetry of interfaces restricts symmetric ordering. Factors like polar and azimuthal tilt or the rearrangement of the molecular backbone may induce the chirality (21).
- Stirring liquids may induce chirality (7, 22-24). Laminar flows or vortexes may align achiral macromolecules or supramolecular entities into chiral structures, because symmetry breaking is highly sensitive to weak asymmetric forces (23, 24).
- Liquid-liquid transitions in single-component isotropic liquids may cause mirror-symmetry breaking (25).
- During synthesis or on cooling below a critical temperature, chirality can arise spontaneously (7, 14, 15, 18, 19-22).
Recently we developed a protocol which contains elements of the first three processes of the above list. We triggered a liquid-liquid transition in pure (Milli-Q) water at ambient conditions by repetitive immersing a Nafion membrane and stirring (28-32).* The water left over after removal of the membrane we denoted as iterative Nafionized water — INW. We revealed that INW contains about 10-4 mol / L of micron-sized supramolecular H2O aggregates (30). Fig. 1 displays a Fluorescence Microscopy picture of a typical aggregate. INW contains about 10-6 mol / L molecular components (Fluorine, Sulfur) released by Nafion (28, 30). At such low concentrations, these components cannot underlie the micron-sized aggregates. Neither can these cause INW’s physicochemical properties, which significantly differ from those of Milli-Q water (28-33).
INW’s various physicochemical variables are correlated (28-31, 33). The ultra-violet (UV) radiation absorbance at the wavelength of the relative maximum (270 nm) and the electric conductivity (χ) of INW are linearly correlated (see Fig. 1b in Ref. 28). The size of the aggregates and χ are linearly correlated (see Fig. 3 in Ref. 28). The heat of mixing (ΔQmix) of INW with an aqueous NaOH solution 0.01 m (mol kg-1) and the χ of INW are linearly correlated (see Fig. 1 in Ref. 29). The density of INW and χ are linearly correlated (see Fig. 2 in Ref. 31).† The pH and the logarithm of χ of INW are linearly correlated (see Fig. 2 in Ref. 29). It should be emphasized that these are linear correlations between widely varying physicochemical properties, i.e., the UV absorbance, the size of the aggregates, the heat released by interaction with alkaline solutions, the concentration of hydrogen ions, the density of the liquid and the quantity of electrical charge transported in a unit of time. The correlations indicate that a single cause, i.e., the aggregates, underlie the physicochemical properties of INW (28-33).

Figure 1. Fluorescent microscope picture of INW. A 1% in weight carboxylate-modified polystyrene latex beads solution is dispersed in INW. The 200 nm sized beads carry green fluorescent probes and emit bright, high contrast colors when illuminated by 465 nm light. Micron sized irregular shaped structures are observable, on which the beads appear to be clustered.
We isolated INW’s supramolecular H2O aggregates by freeze-drying (lyophilization) or evaporation of INW at ambient conditions, i.e., by removing its bulk water (28). Lyophilizing 250 ml INW leaves about 25 mg of a ponderal solid residue (RINW) (see Fig. 2). RINW is stable at ambient conditions. It is a phase of water differing from aqueous vapor, liquid or ice (28, 31). Since our previous analyses suggest ferroelectric (proton) ordering of its H2O (31), an issue currently under further investigation, this phase has important implications for numerous technologies.‡
*Liquid-liquid transitions in water are intensively studied (26, 27).
† The density of INW is higher than that of the unperturbed water (31). Accordingly, the density of the aggregates in INW has to be higher than that of the unperturbed bulk water.
The aim of our current study was to investigate whether INW is optical active. Therefore, we studied the ultra UV circular dichroism spectra of INW. To elucidate some of their features, we also studied the UV absorption and emission spectra of INW.

Figure 2. Appearance of RINW. This figure shows the ponderal solid residue left over after lyophilizing INW.
Results
Sample characterization. INW is a far-out-of equilibrium, self-organizing, dissipative and hysteretic system (28-32). Its aggregates constantly reorganize. These may amass, partly break up and subsequently congregate, or completely disintegrate. Therefore, INW’s physi-cochemical properties incessantly change. For example, during the first 90 days after preparation of samples, the electric conductivity (χ) of some samples first increased and subsequently decreased, for others first decreased and then increased, while also continuous diminishments were observed (see Fig. 1 in Ref. 31). The increments and decrements in some cases reached ~50% of the χ value measured immediately after the last membrane removal step. It is, therefore, impossible to prepare samples with equivalent χ values. The same is true for the other physicochemical variables. Actually, due to INW’s far-out-of equilibrium properties, just the measuring techniques themselves may affect the values of its physicochemical properties. However, since the values of the various physicochemical variables of INW samples are correlated (28-33), the effects of the measuring techniques can be regarded as inconsequential for revealing their phenomena. In other words, INW’s phenomena are repeatable but not quantitatively reproducible. An example of such repeatability but not quantitative reproducibility are the bands in the UV radiation spectra of INW. For all samples, a band with maximum around 270 nm has been observed (28). However, the absorbance at the maximum of the band varied over identically prepared samples, i.e., samples prepared with the same number of iteration steps, the same membrane and the same volume of water. As noted previously, the absorbance was correlated with the χ of the sample.
‡Lately isolation of supramolecular H2O aggregates, which formed adjacent to Nafion membranes, was achieved with a spontaneous phase separation technique (34). The technique sheds light on the H2O ordering process occurring adjacent to the membrane and on the subsequent accumulation of the supramolecular H2O aggregates into a separate phase. Liquid-liquid transitions in water followed by spontaneous phase separation is also inducible by other membranes, granted that just as Nafion these are hydrophilic, e.g., regenerated cellulose membranes (34).
We characterized INW samples by their χ values. We prepared samples with different χ. We placed a washed Nafion membrane (with 60 – 120 cm2 surface and 50 – 180 micron thickness) in 10 – 20 ml Milli-Q water (kept in an open Pyrex or Polystyrene Petri dish). We stirred the liquid so that 2 – 3 mm of it laps against the membrane. We employed mechanical, magnetic or manual stirring methods. Subsequently, we took off 1 ml of the liquid (far from the membrane surface), measured its χ and returned it to the liquid. We turned over the membrane. We repeated tens of times this sequence of stirring, χ measurement and membrane turn over. Each time χ increased. We removed the membrane and dried it in air. We returned the dried membrane to the agitated water sample. We redid aforementioned sequences. We iterated 10 – 20 times this cycle of membrane immersion, liquid agitation by stirring and membrane turn over, membrane removal, membrane drying and membrane re-immersion. χ depends on parameters like volume of the treated water, membrane size, durance of its stirring and fluctuating environmental conditions. χ of the liquid left over after the last membrane removal step we denote as χINW. The typical properties of INW, which we reported in our previous publications (28-33), as well as those we report below, are obtainable by preparing samples with different Nafion sheets or reusing a sheet for several months.
χINW values of some of our samples reached values somewhat higher than 1000 μS cm-1. These values significantly differ from the χ of Milli-Q water. The latter is about 1 – 2 μS cm-1. Thus the preparation of INW may lead to a three orders of magnitude increase in χ. The differences are not due to the presence of Nafion, because we measured χINW after removal of the membrane from the perturbed liquid. As we noted above, χINW is linearly correlated with all the physicochemical variables of INW previously reported by us.
The viscosity of the supramolecular aggregates in INW differs from that of bulk water. This enables visualizing some of INW’s textural aspects with Fluorescence Microscopy motion-pictures. SI Appendix Video S1 presents a typical example. It clearly depicts dissimilarities between an INW sample and Milli-Q water, e.g., the non-homogenous structure of INW versus the homogeneity of Milli-Q water. It also reveals that the shapes and sizes of INW’s structures vary widely. In addition, it displays that the random movement of these structures is much slower than that of bulk H2O. The video complements textural aspects of INW previously revealed by our group. For example, with light scattering, we revealed that the sizes of INW’s structures are in the range of 50-300 microns (see Fig. 3 in Ref. 28). Moreover, we revealed the scale-free self-similar fractality of INW supramolecular structures by analyses of the correlations between INW’s physicochemical properties (33).

Figure 3. SEM image of RINW. This figure shows the solid material left over after lyophilization of INW.
To expose the relation between INW’s structures and those composing the RINW obtained after lyophilizing the INW sample (see Fig. 2), we present a scanning electron microscopy (SEM) picture of RINW in Fig. 3. It illustrates that on removing bulk water from INW, its micron-sized structures persist. To gain insight into their agglomeration and fine-structure, in SI Appendix Fig. S1 we present Atomic Force Microscopy (AFM) images of the deposit left over after evaporating INW in air at ambient conditions. SI Appendix Fig. S1 presents a 1 μm and a 100 nm scale image. The 1 μm scale image displays that the morphology formed on the surface mainly resembles that of a polymeric network: irregular shaped chunks are linked by fibrils. The diameters of the chunks and the length of the fibrils in between the chunks both are in the hundreds of nm range. The heights of the chunks reach about 2 nm, whereas those of the fibrils are somewhat smaller (about 1 nm). In addition, globules are observable. Their diameters are of the order of nanometers. These globules sometimes interconnect the fibrils at branching points, but occasionally these are just incorporated along the fibrils. The globules seem to act as nucleation points for a fibrillogenesis process. The 100 nm scale AFM image evokes that the fibrils form by accumulation of small spherical grains. Amassment of such grains ostensibly also underlies formation of the chunks. The aforementioned morphological features appear in all the different areas of the sample surface. Repetition of scans over the same surface area did not alter its morphologies. The same morphological features appear when INW is dropped on a hydrophilic mica substrate and when it is dropped on a hydrophobic pyrolytic graphite sheet. Moreover, the morphologies resemble those observed for water perturbed with other methods, e.g., iterative filtrations (32). The currently available data on INW are insufficient for a definite identification of the differences between the chunks and the fibrils. However, the explanations of some of INW’s properties, which we presented in Ref. 31, provide some clues. We elaborate on these clues in the Discussion with Reviewers Section.
Impurity Analyses. To guarantee that impurities neither constitute the micron-sized structures in INW and its residues, nor underlie its physicochemical characteristics, we employed state-of-the-art analytical techniques. These evince:
- INW and RINW are composed of H2O and contain only miniscule amounts of organic or biological contaminants, as shown by our mass spectra (MS) analyses (see SI Appendix, Figs. S2-S4). We performed the MS analyses with two different ionization techniques: Matrix-Assisted Laser Desorption/Ionization Time Of Flight (MALDI-TOF) and Gas Chromatography (GC) coupled to electron impact ionization. Organic and biological matter constitute less than 2% of RINW.
- Inorganic ions do not underlie the high χINW values, as our ion chromatography (IC) analyses show. IC evinces that the sole inorganic ions present in the Nafion membranes are Fluorine (F- ) and Sulfate (HSO4–) ions. Nafion is a sulfonated tetrafluoroethylene based fluoropolymercopolymer (35). The concentration of F- and HSO4– in INW is about 10-6 mol / L. Therefore these ions cannot underlie the observed χINW values, because these values are about three orders of magnitude larger than χ of Milli-Q water. The F- and HSO4– also cannot be related to the low pH values of INW — the pH of INW can reach values as low as 2.5 which are to be compared with the pH of about 6 of Milli-Q water (28, 29). To ensure that the Nafion membranes cannot release other inorganic molecules, we incinerated membranes in an alkaline environment and dissolved the calcinated samples in aqueous HNO3 (see SI Appendix, Materials and Methods — IC). IC analyses of the resulting solutions show that the only inorganic molecules present in the calcinated samples are F- and HSO4– ions (SI Appendix, Table S1). The concentrations of these ions in the Nafion membranes are, respectively, 171 mg/g (17% ww) and 73 mg/g (7% ww).
- RINW consists of H2O aggregates with evaporation characteristics and phase transition temperatures agreeing with those predicted by quantum and classical physics theories of H2O ensembles. Our thermogravimetric analyses exposed these thermodynamic features of RINW (31).
- The UV absorbance of INW resembles that of other structured waters. The UV spectrum of INW is presented in Fig. 1a in Ref. 28. Studies of UV spectra of some other structured waters are presented in Ref. 36-40. These studies pertain to water adjacent to Nafion or other hydrophilic membranes, and to aqueous solutions.§ INW and the aforementioned structured waters absorb in the 200 – 400 nm wavelength range. Conversely, gas phase H2O, bulk water, amorphous, hexagonal or cubic ice do not significantly absorb radiation in this range (36, 45, 46). For gas phase H2O, its lowest-energy band of the electronic spectrum covers the 151 – 182 nm range with a maximum at 168 nm (36, 45). In pure bulk liquid water (36, 45, 46), this band is broader and blue-shifted. Its maximum is at 151 nm and its absorbance falls off monotonically by about ten orders of magnitude in the 151 – 400 nm range (it is only about 0.0001 cm-1 at 320 nm — see Ref. 46). Amorphous, hexagonal or cubic ice have absorbance features similar to those detailed in the previous sentence (36, 45).
The analytical findings of paragraphs (a) – (d) indicate that impurities do not underlie INW’s phenomena. Moreover, these signify that RINW and the micron-sized structures in INW are composed of supramolecular ordered H2O.
Circular Dichroism (CD) of INW. Figs. 4-6 present the main results of our CD measurements. These figures depict the CD spectra of INW, i.e., the difference between its absorbance of left and right circularly polarized light as a function of the UV radiation’s wavelengths. The difference [the Delta Absorbance (∆A) in milli-degrees (mdeg)] is normalized for optical length quartz cuvette (0.5 cm). The CD spectrum of the control, i.e., Milli-Q water with χ in the range of 1 – 2 µS cm-1, is flat (see Fig. 6). Fig. 4 pertains to INW samples with different χINW values, kept at a temperature (T) of 20 oC. This figure shows that the samples’ CD spectra significantly vary with their χINW. Fig. 5 pertains to an INW sample at different T values. Its CD spectra were measured after it was kept for 20 minutes at each T value. This figure shows that for T≤80 oC the sample’s CD spectra are similar, but at T=90 oC its ∆A values are significantly less than those at T≤80 oC. Fig. 6 pertains to a sample before and after its filtration with Syringe filters (450 nm) of Corning® (the T of the sample is 20 oC). This figure shows that filtering of a sample reduces ∆A and shifts its minima and maxima to shorter wavelength.

Figure 4. CD spectra of INW samples with different electric conductivity. The CD in mdeg is plotted as a function of the wavelength in nm for samples with electric conductivity as specified in the inset. The temperature of the samples is kept stable at 20 oC.
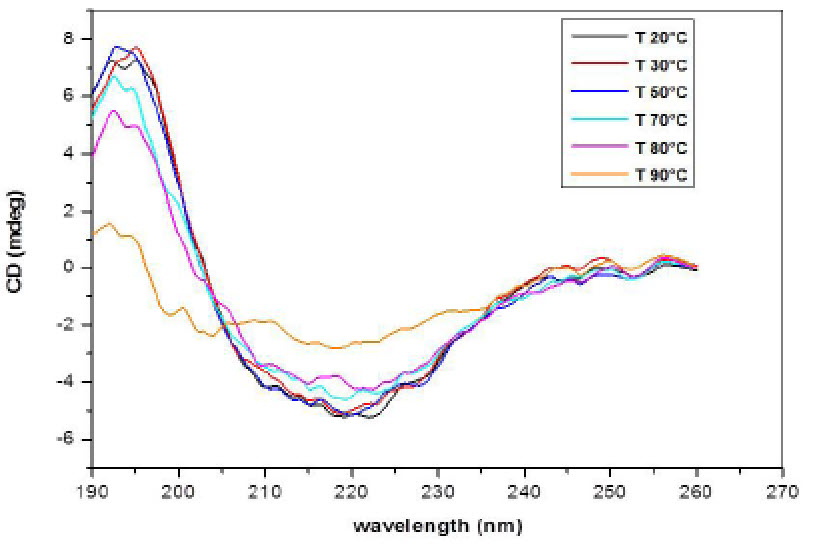
Figure 5. CD spectra of an INW sample at different temperatures. The CD in mdeg is plotted as a function of the wavelength in nm for a sample with electric conductivity of 848 µS cm-1, after it is kept for 20 minutes at the temperature specified in the inset.
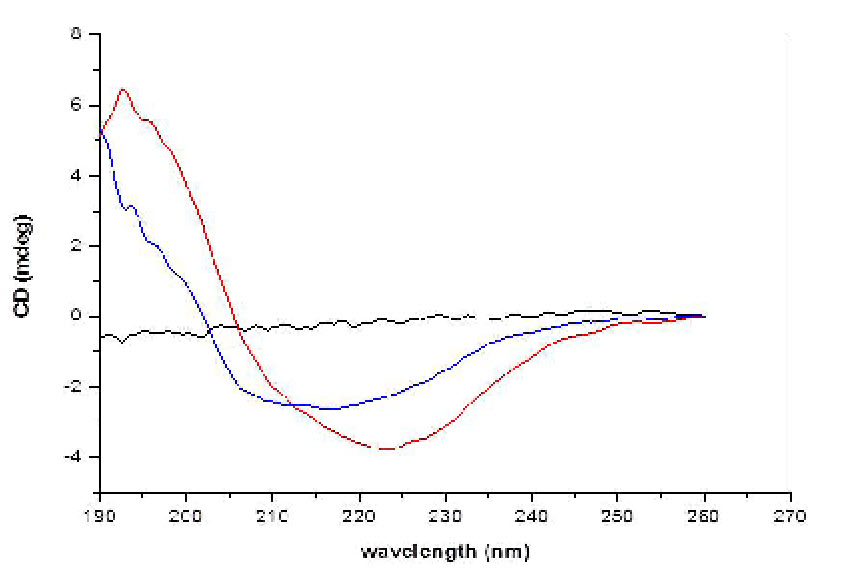
Figure 6. CD of the control and of filtered INW. The CD in mdeg is plotted as a function of the wavelength in nm for an INW sample before its filtration (red line) and after its filtration (blue line). The electric conductivity of the INW sample before its filtration was 825 µS cm-1. The black line presents the CD as a function of the wavelength for the control, i.e., Milli-Q water.
The detailed CD features of INW revealed by our measurements are as follows:
i. ∆A differs from zero at wavelengths in the 240 – 190 nm range (see Figs. 4-6). ∆A maxima and ∆A minima are located at wavelengths of about 195 – 198 nm and 215 – 222 nm, respectively. The sizeable ∆A values reflect that INW contains chiral aggregates. Moreover, these values signify that one type of enantiomer is in excess or that only one type is present (i.e., homochirality).
ii. The CD spectra of INW resemble those of β-sheets (47). We emphasize that their large ∆A values, e.g., ∆A = -16 mdeg, cannot be attributed to biological or organic contaminants. The minuscule amounts of contaminants and compounds, identified by our MALDI-TOF/MS, GC/MS and IC analyses, cannot lead to the observed large ∆A values.
iii. ∆A maxima are larger than ∆A minima (see Fig. 4-6). This phenomenon is remarkably similar to that observed for biological macromolecules. The disparity reflects the degree of twist in β-Sheets (47). Weakly twisted sheets have maxima and minima of approximately equal magnitude. For strongly twisted sheets, the maximal ∆A is much larger than the minimal one.
iv. ∆A maxima and minima, and the wavelengths at which these appear, depend on χINW of the samples (see Fig. 4). Since preparation parameters affect χINW, the dependence signifies that varying the preparation protocol leads to differences in the secondary structure of INW’s aqueous macromolecules (its structures solely composed of H2O). This phenomenon is noteworthy similar to the one observed for biological macromolecules.
v. Since the CD spectra depend on the samples’ χINW values (see Fig. 4) and these values correlate with the sizes of INW’s supramolecular aggregates (28), we investigated the effects of the aggregates’ dimensions on the CD features. Fig. 6 shows that filtering of a sample with a 450 nm sized pores’ filter reduces ∆A, and shifts its minima and maxima to shorter wavelengths. It reduces the ∆A maximum by about 75 percent and shifts the wavelength of the ∆A minimum by about 20 nm. Similar phenomena were observed for samples with different χINW values. These results corroborate our previous findings that the dimensions of the structures in INW are of the order of microns (28).
vi. The stirring technique employed for preparing INW samples (for their agitation) affects their CD spectra. Mechanical, magnetic and manual stirring lead to variations in the value of ∆A at its maximum and the frequency at which the minimum in ∆A appears. These findings, in combination with those presented in paragraph v, indicate that the stirring method affects the sizes of the supramolecular H2O structures. These findings enable a rough estimate of the bonding energies between the H2O constituting the aggregates. The energy applied to water by stirring it, and the percentage of this energy available for break-up of micron-sized H2O aggregates are assessed in Ref. 37. The assessment indicates that the energy required for loosening an H2O from an aggregate is about 0.01 – 1 eV. This estimate sets an upper bound for the interaction energies underlying the chirality of INW’s aggregates.
vii. On heating from 20 oC to 80 oC, the CD spectra of INW change only slightly. However, on heating above 80 °C, their spectra flatten very slowly (i.e., the typical β-sheet features blur and the ∆A values return to those of pure water) (see Fig. 5). Keeping INW for three days at T=90oC in an oven is required for its CD spectra to become nearly flat, e.g., ∆A < 3 mdeg (see SI Appendix, Fig. S5). The loss of CD of INW on heating is not a reversible process. After cooling to T=20oC of samples previously kept for three days at T=90oC, their CD spectra remain flat. Moreover, on immersing a Nafion membrane for two hours in a cooled sample, on stirring of its liquid and on recurrent overturning the membrane, the sample does not regain its CD. Apparently, only during the very slow liquid-liquid transition induced by the membrane in its interfacial water and the accumulation of the resulting H2O orderings in a separate phase, as observed in Ref. 34, the chiral conformations evolve. Indeed theories predict that during very slow phase transitions, when the control parameter slowly changes, symmetry breaking bifurcations may play a decisive role (23).
The thermal properties of INW strikingly resemble those of biological macromolecules (47). However, unlike biomolecules and some other chiral compounds composed of achiral molecules (7), the chirality of INW’s structures is not attributable to hydrogen bonding. The energy of hydrogen-bonds between H2O in water at ambient conditions is about five times the energy of its thermal fluctuations (48). The energy of these fluctuations is of the order of kT, with k representing the Boltzmann constant. kT only slightly increases (from 0.025 eV to 0.031 eV) on heating water from T=20oC to T=90oC. Thus, the disappearance of chirality on heating INW to 90oC cannot be due to the destruction of hydrogen bonds between its H2O. This inference is confirmed by our addition of sodium hydroxide (NaOH) or hydrogen chloride (HCl) to INW in amounts sufficiently to induce its pH to go up to 13 or down to 3, respectively. INW’s chirality is resistant to such changes in its pH.
viii. The CD spectra of RINW resemble those of their “mother” INW. Moreover, on adding Milli-Q water to RINW samples, the solid residues dissolve and the resulting liquids (the “daughter” INW) have CD spectra resembling those of their mother INW. Actually, the daughter INW have all the typical characteristics of the mother INW. For example, the linear correlation between the log (χINW) and pH values of the daughter INW is the same as that of the mother INW. Yet the differences between the UV absorbance, the χINW and the values of other physicochemical variables of the daughter INW and those of Milli-Q water are much smaller than the analogous differences for their mother INW. For example, we lyophilized an INW sample with χINW =260 µS cm-1 and pH=3.2. The resulting RINW we dissolved in Milli-Q water and we added additional Milli-Q water until the volume of the liquid was the same as that of the mother INW sample. We measured the χINW and pH of the daughter INW, which respectively were 58.5 µS cm-1 and 4.0. The discrepancies between the values of physicochemical variables of the mother INW and their daughter INW mean that only a small part of the aggregates were unaffected by lyophilizing the mother INW and the solvation of RINW.
UV Spectral Analyses of INW. In our attempts to trace the source of the UV CD spectral characteristics of INW, we studied its UV radiation absorbance and emission. Fig. 7 presents the UV-visible (UV-vis) fluorescence spectra of an INW sample, of its serial diluted liquids and of the control Milli-Q water. The spectra result from excitation of the liquids with 280 nm radiation. INW has a distinctive absorption peak in the 250 – 320 nm range with maximum at 280 nm (see Fig. 1a in Ref. 28); the peak is absent in bulk water (36, 45, 46). The bandwidth of the excitations and the emissions are 5 nm. Fig. 7 displays that INW’s fluorescence spectra consist of a broad band spanning from 290 to 550 nm. It also displays that on dilution of the sample, the fluorescence intensity diminishes. Moreover, it displays that the emission is absent in Milli-Q water, except for a very tiny peak at 310 nm which is attributable to Raman scattering by H2O (49). These findings signify that the H2O aggregates present in INW underlie the fluorescence and that dilution reduces their concentration. The absence of any sharp emission peaks and the smeared out character of the spectra indicate presence of excimers (36, 50-52) (see SI Appendix Text S3).
 (c")
Figure 7. Emission spectra of INW samples and Milli-Q water excited with 280 nm radiation. The fluorescence intensities are plotted as function of wavelength in nm for samples kept at 25 oC. The red line presents the fluorescence of an INW sample with χINW=1300 μS cm-1. The colored lines present the fluorescence of samples obtained by successive dilutions of this χINW=1300 μS cm-1 sample. The sample was diluted with Milli-Q water. The dilution ratio is specified in the inset. The black line presents the fluorescence of the control, i.e., Milli-Q water.
The UV absorbance and fluorescence spectra of INW resemble those of interfacial water adjacent to Nafion membranes (WAN) (compare Fig. 1a of Ref. 28 with Fig. 4b of Ref. 38 and compare Fig. 7 of this paper with Fig. 6 of Ref. 40).** The UV absorbance of INW most closely resembles that of WAN at a distance of about 450 micron from the Nafion membrane (WAN-450). In particular, INW and WAN-450 have in common the strong absorbance enhancement when the wavelength decreases from 240 to 200 nm.†† No such enhancement occurs for WAN much closer to the membrane. The UV absorbance in the 240-200 nm range has not yet been clarified for WAN or other structured waters. Analogous absorbance has been observed for magnetized water (53), suggesting that it is related to the dynamics of electrons in water. Other UV spectral features of WAN also depend on its distance from the membrane. For example, the location of the maximum of WAN’s broad absorbance peak in the 250-320 nm range depends on its distance from the membrane. The location varies between about 265 nm to 280 nm. Moreover, WAN’s fluorescence band’s width and location (typically in the 380 – 530 nm range) and the position of its fluorescence band’s maximum (typically in the 425 – 470 nm range) depend on its distance from the membrane (see Fig. 6 of Ref. 40). The aforementioned dependencies imply that the electronic distribution in WAN’s H2O aggregates is a function of their distance from the membrane.
** The UV fluorescence spectra of WAN resemble those of other structured waters (36, 40, 51, 52). Excimer-type UV-vis fluorescence bands have been observed for water-ethanol mixtures (51) and various aqueous solutions, e.g., solutions of lithium chloride or sucrose (36, 40, 52).
††In the 200 – 240 nm range, the difference between INW’s absorbance of left and right circularly polarized radiation (∆A) is also pronounced (see Figs. 4-6).
‡‡ The quantum mechanics H38O20 excimer-based explanations of the properties of WAN were published nearly simultaneously with explanations based on a quantum dynamic model (52, 54). Noteworthy are the similarities of these quantum mechanics and dynamic models. We present these in SI Appendix, Text S4.
WAN’s H2O aggregates have been analyzed with high-level computations, i.e., with the well established quantum mechanical ab initio derived Complete-Active-Space Self-Consistent-Field second-order perturbation theory (CASPT2) (36, 50, 52). The analyses indicated that WAN’s H2O aggregates are composed of excimers forming networks of multilayer honeycomb ice-like layers (see Fig. 1 and 6 in Ref. 52). The formula of the excimers is H38O20. The formula of the two monomers constituting the excimer is H19O10. The H2O forming the monomer are organized in two fused hexagons.‡‡ The electronic properties of the H38O20 excimer is a function of its inter-monomer distance, i.e., its structural relaxation (52). Thus the dependence of the UV spectral features of WAN on its distance from the Nafion membrane suggest that the structural relaxation of the H38O20 constituting its more outward layers differs from that of its inward layers. The possibility that the aggregates in INW are also composed of H38O20 excimers is supported by the following:
- INW’s UV absorbance features resemble those of WAN, in particular, those of WAN-450.
- The maximum of INW’s UV fluorescence spectrum (see Fig. 7) is blue shifted compared to that of WAN (see Fig. 6 in Ref. 40). For example, it is blue shifted by about 80 nm compared to that of WAN-450. The maximum of the former is at about 360 nm while that of the latter is at about 440 nm. The blue shift is most likely related to the absence of the Nafion membrane in INW. We remind the reader that the membrane is removed after the final INW preparation step. A solid surface may significantly affect the electron distribution of its interfacial water (55, 56). Hence, removal of the membrane may affect the electron distribution and the structural relaxation of its adjacent H2O aggregates composed of H38O20.§§
- INW and WAN have many other similar physicochemical properties (see Table 1 of Ref. 31). Based on these similarities, we concluded the following: On immersing a Nafion membrane in pure water, H2O associate in its interfacial zone; the subsequent stirring of the liquid ruptures clumps of the H2O aggregates and disperse these in the neighboring bulk water.
§§ Another dissimilarity between INW’s UV fluorescence spectrum (Fig. 7) and that of WAN-450M (40) is that the former has some smeared-out features (shoulders and bumps) which are not discernible in the latter. However, this may well be an artifact resulting from the excitation and emission bandwidths, which are narrower for the former (5 nm) compared to those of the latter (10 nm).
The information presented in this section evokes the following: During INW preparation, the H2O aggregates only stretch outward from the membrane by about 450 μm; stirring causes the most outer lying aggregates to disperse into the bulk liquid. Indeed association of H2O in WAN is a rather slow process. 10 minutes after immersing the membrane, the width of its interfacial zone reaches about 600 μm (38, 57); a day has to pass for the width to reach its maximum size of about 1 mm (38, 57).
If indeed H38O20 excimers constitute the INW’s aggregates, the following question arises: What are the transitions underlying the maxima and shoulders in INW’s fluorescence spectrum? Carrying out CASPT2 computations for the H38O20 network, while taking into account the alterations in its electron distribution due to removal of the membrane, might enable assigning INW’s UV spectral features. However, such computations are outside the scope of this paper. Still, the discussion in SI Appendix Text S5 holds some clues.
Discussion
Our analyses, though contributing to the characterization of INW’s supramolecular H2O aggregates, did not elucidate the cause underlying its CD features. The H38O20 unit belongs to the achiral D2h symmetry group. Furthermore, the energy gained by two H2O forming a couple through π-stacking, which underlies the attraction between the two H19O10 monomers constituting the H38O20 excimer, is of the order of 1 eV (36). This value is congruent with the estimate of the energy required for loosening a H2O from a micron-sized aggregate (see paragraph vi). However, it cannot explain the disappearance of the CD of INW on heating it to 90 oC. The energy of thermal fluctuations at 90 oC is only about 0.03 eV (see paragraph vii).
Since our analyses do not enable designation of the CD spectral features of INW, for the time being we suffice with presenting two hypotheses for the observed mirror-symmetry breaking in INW:
- Chiral conformations of the networks of multilayer honeycomb ice-like layers composed of H38O20 units constituting INW’s aggregates could underlie its β-sheets-like CD features. To provide a plausible explanation for formation of such conformations, we recall that the analyses of paragraph vii indicate that INW which has lost its optical activity on heating neither regains it by interacting with an immersed membrane nor by stirring of the liquid. Thus, apparently a chiral conformation evolves during the slow liquid-liquid transition induced by the membrane in its WAN (perhaps in a manner resembling one of those predicted by the computer simulations presented in Ref. 12). We also recall that at surfaces, most physisorbed achiral molecules order chirally. Such local molecular chirality often gets propagated to the supramolecular level (7, 21). With WAN’s electronic distribution depending on its distance from the membrane, it thus is indeed possible that the structural relaxation of the H38O20 network (e.g., in WAN-450) induces a conformation with a symmetry analogous to that of β-sheets. Generation of chiral conformations by surfaces generally leads to equal amounts of right- and left-handed enantiomers (7, 21). Such racemates do not exhibit optical activity. The CD of INW thus signifies excess of one enantiomer type or homochirality. A wide variety of enantioselective processes (even fluctuations affecting bifurcations) are known to induce mirror-symmetry breaking (7, 21-24). One process of particular relevance to INW is stirring. Especially during very slow phase transitions, hydrodynamic flows selecting chiral signs have been observed for various systems (7, 22-24). Therefore, we hypothesize that during INW preparation, the hydrodynamic flows created by stirring of the liquid cause mirror-symmetry breaking of the chiral conformations of the networks of multilayer honeycomb ice-like layers composed of H38O20 units, which slowly form in water that must have had prolonged contact with a Nafion membrane.
- The CD of INW may result from specific properties of its aggregates derivable with the quantum dynamic model, which we cited in footnote ‡‡. These properties have not yet been or perhaps cannot be captured by the quantum mechanics CASPT2 model. According to the quantum dynamic model, the excitations of the aggregates in WAN have cold vortex-like properties (54). External fields affect these vortexes. Thus it is plausible that their interactions with the Nafion membrane and/or with the Earth’s magnetic field result in mirror-symmetry breaking.
In regard of our hypotheses, as first steps aimed at uncovering the causes underlying the CD and absorbance spectral features of INW in the 240 nm to 200 nm range, we call for future research directed at expanding the CASPT2 computations and extending the quantum dynamic model’s description of its vortexes.
Conclusions
In this paper we showed that perturbing pure water with a Nafion membrane and stirring leads to mirror-symmetry breaking. The circular dichroism spectral features of the perturbed water are attributable to micron-sized supramolecular H2O aggregates. These aggregates formed during the liquid-liquid transition triggered by the perturbations. The sizable differences between the perturbed water’s absorbance of left and right circularly polarized light signal that the circular dichroism is not the result of contaminants. To spot contaminants and eliminate suspicion that these underlie our findings, we carried out extensive analyses. Our mass spectroscopy analyses evince that the aggregates are composed of H2O (see SI Appendix, Fig. S2). Our MALDI-TOF/mass spectroscopy and gas chromatography/mass spectroscopy analyses show that only miniscule amounts of organic or biological contaminants are present in the perturbed water (see SI Appendix, Fig. S3-4). These contaminants cannot account for formation of the micron-sized aggregates. Our ion chromatography analyses show that the sole inorganic molecules released by the Nafion membranes are Fluorine and Sulfate ions. In the perturbed water, these ions are present at concentrations of about 10-6 mol / L. These ions cannot account for formation of its micron-sized aggregates, its high electric conductivity or low pH. Also the UV absorbance and fluorescence spectra of the perturbed water cannot be ascribed to contaminants, nor to molecules released by the Nafion membranes. Conversely, the spectra resemble those of other structured waters. These spectra indicate that the ordering of part of the H2O within these waters is compatible with that predicted by the high level ab initio derived quantum mechanic CASPT2 model, i.e., H2O ordering in H38O20 excimers which form networks of multilayer honeycomb ice-like layers.
Significance and Implications.
The significance and implications of our findings are so vast that just providing an overview is impossible. After all these pertain to water, and to part of its H2O ordering in chiral supramolecular aggregates with dimensions of macro-biomolecules. So we suffice with pointing out some broad science and technology categories for which we expect our findings to have consequences.
Chiral supramolecular systems — Chiral supramolecular aggregates, including those composed of achiral molecules, play important roles in many technological processes, artificial and biological systems (6, 7, 13). For instance, these underlie processes in chiral genesis, molecular and chiral recognition, chiral separation and stereochemical assignment, asymmetric synthesis and catalysis, non-linear optic devices, biomimetic systems, biological self-assembly resulting in DNA or membrane formation. The chirality of supramolecular aggregates impinges on parts or the whole of multi-component systems (their structure, dynamics, performance) (6, 7, 22). Thus, for example, chiral solvents may induced mirror symmetry breaking in circular dichroism-silent or optically-inactive solutes (small molecules, supramolecular aggregates or polymers) (6-8). In this regard, we anticipate that water containing chiral supramolecular H2O aggregates, even just in its widespread use as a solvent, may affect aforementioned processes and systems.
H2O aggregates research — During the last decades, studies of H2O aggregates were undertaken by many research groups (9-11, 28-33, 36, 37, 39, 41, 43, 44, 52, 54). Such studies continue to be carried out, because these may shed light on some of the many yet unexplained properties of water (10, 27). Another motivation for undertaking such studies is that H2O aggregates dispersed in bulk water may affect its physicochemical properties and thus have technological implications (28-32, 37, 43, 44), e.g., for chemical reactions, catalyses, corrosion and bioprocesses. The SEM, AFM, circular dichroism and fluorescence findings presented in this paper contribute to delineation of characteristics of supramolecular H2O aggregates.
Biohomochirality — The origin of biohomochirality is still inexplicable (1, 4, 6, 22). Based on our data, we surmise that mirror-symmetry breaking of water may significantly contribute to the origin as well as pervasiveness of biohomochirality. It is plausible that homochiral supramolecular H2O aggregates form when water very slowly flows near surfaces with properties resembling those of Nafion membranes, and that these aggregates affect the ordering of biomolecules. The hitherto published characteristics of H2O orderings in interfacial water adjacent to Nafion membranes are congruent with those published for H2O orderings forming adjacent to other hydrophilic membranes as well as adjacent to reactive metal sheets (31, 38, 58). Thus, measuring the circular dichroism of water perturbed by repeatedly immersing other types of hydrophilic membranes or reactive metal sheets and gently stirring the liquid is called for. If indeed such perturbations carried out with many types of solid surfaces cause mirror-symmetry breaking, we suggest to investigate the impact of chiral supramolecular H2O aggregates on prebiotic chemical reactions and abiogenesis processes.
Limitations of this study.
The main limitation of our study is that it does not shed light on the underlying cause of the chirality of the supramolecular H2O orderings. Our experimental data are also insufficient for elucidating whether the chiral ordering of H2O is induced by the membrane or by the stirring. Moreover, the data cannot demonstrate whether in the perturbed water one type of enantiomer is in excess or that its supramolecular H2O orderings are homochiral. Another limitation is that the quantum models, which we employ for interpreting our results, are not sufficiently developed to explain several features in our UV spectra.
In spite of the above mentioned limitations, data are data. Hence, our findings indicate that the search for exploiting the chirality of the micron-sized (macrobiomolecule-sized) supramolecular H2O aggregates present in water perturbed by a Nafion membrane can take off, for example in biotechnology, biomimetic processes or artificial devices.
Materials and Methods
Preparation of INW samples — The protocol for preparing INW samples has been detailed in Ref. 28-31. The main challenge in preparing these samples is the patience required for carrying out the tedious manual preparation procedure. Much persistence is needed for implementing the sequence of immersing the Nafion membrane in Milli-Q water, stirring of the liquid, measuring χ, turning over the membrane, repeating tens of times this sequence of stirring, χ measurement and membrane turn over, removing and drying of the membrane and subsequent repeating all these steps 10, 20 times or more. Yet, we prepared hundreds of INW samples.
Analytical methods — All analytical techniques employed in this study are commonly used. Their application for analyzing INW or its residues is the same as for other common liquids or solids. Therefore their details we provide in the SI Appendix, Materials and Methods section. The techniques include Fluorescence microscopy, Scanning electron microscopy, Atomic force microscopy, Gas chromatography, Matrix-assisted laser desorption/ionization time of flight, Ion Chromatography, circular dichroism spectroscopy and UV Fluorescence spectroscopy.
Acknowledgments
The authors thank Dr. Osvalda Senneca and Luciano Cortese (Istituto di Ricerche sulla Combustione, CNR, Napoli, Italy) for the SEM image, and Prof. Marco Trifuoggi and Dr. Antonella Giarra (Analytical Chemistry for Environment Institute of the Chemical Science Department of the “Federico II” University of Naples, Italy) for the IC analyses. Tamar Yinnon thanks Prof. A.M. Yinnon for his support and proof reading of the manuscript. She also expresses her appreciation and thankfulness to Jesús Aguilar for his assistance with the literature search.
References
1. Klabunovskii EI (2012) Homochirality and its significance for biosphere and the origin of life theory. Russ J Org Chem 48(7):881-901.
2. Pasteur L (1848) Recherches sur les relations qui peuvent exister entre la forme cristalline, la composition chimique et le sens de la polarisation rotatoire. Ann Chim Phys 24:442–459.
3. Pasteur L (1858) Mémoire sur la fermentation de l’acide tartrique. C R Hebd Séances Acad sci 46:615-618
4. Pavlov VA, Klabunovskii EI (2014) Homochirality origin in nature: Possible versions. Curr Org Chem 18(1):93-114.
5. Scolnik Y, et al. (2006) Subtle differences in structural transitions between poly-L- and poly-D-amino acids of equal length in water. Phys Chem Chem Phys 8(3):333-339.
6. Fujiki M (2014) Supramolecular chirality: Solvent chirality transfer in molecular chemistry and polymer chemistry. Symmetry 6(3):677-703.
7. Hembury GA, Borovkov VV, Inoue Y (2008) Chirality-sensing supramolecular systems. Chem Rev 108(1):1-73.
8. Bosnich B (1967) Asymmetric syntheses, asymmetric transformations, and asymmetric inductions in an optically active solvent. J Am Chem Soc 89(24):6143–6148.
9. Pugliano N, Saykally RJ (1992) Measurement of quantum tunneling between chiral isomers of the cyclic water trimer. Science 257(5078): 1937-1940.
10. Keutsch FN, Saykally RJ (2001) Water clusters: Untangling the mysteries of the liquid, one molecule at a time. Proc Natl Acad Sci 98(9):10533-10540.
11. Drechsel-Grau C, Marx D (2015) Tunneling in chiral water clusters: Protons in concert. Nat Phys 11(3):216-218.
12. Lozynski M (2015) Liquid water: The helical perspective of structure. Chem Phys 455:1-6.
13. Shen Y, Chen C-F (2012) Helicenes: synthesis and applications. Chem Rev 112(3):1463–1535.
14. Takezoe H, Takanishi Y (2006) Bent-core liquid crystals: Their mysterious and attractive World. J Appl Phys Jpn 45(2A):597-625.
15. Link DR, et al. (1997) Spontaneous formation of macroscopic chiral domains in a fluid smectic phase of achiral molecules. Science 278(5345):1924-1927.
16. Sekine T, et al. (1997) Origin of the helix in banana-shaped molecular systems. Jpn J Appl Phys 36(10):6455-6463.
17. Niwano H, et al. (2004) Chiral memory on transition between the B2 and B4 phases in an achiral banana-shaped molecular system. J Phys Chem B 108(39):14889-14896.
18. Jákli A (2013) Liquid crystals of the twenty-first century – nematic phase of bent-core molecules. Liq Cryst Rev 1(1):65-82.
19. Panov VP, et al. (2011) Microsecond linear optical response in the unusual nematic phase of achiral bimesogens. Appl Phys Lett 99(26):261903.
20. Cestari M, et al. (2011) Phase behavior and properties of the liquid-crystal dimer 1”,7”-bis(4-cyanobiphenyl-4’-yl) heptane: A twist-bend nematic liquid crystal. Phys Rev E 84(3):031704.
21. Ernst KH (2012) Molecular chirality at surfaces. Phys Status Solidi B 249(11):2057-2088.
22. Weissbuch I, Lahav M (2011) Crystalline architectures as templates of relevance to the origins of homochirality. Chem Rev 111(5):3236-3267.
23. Ribó JM, Crusats J, Sagués F, Claret J, Rubires R (2001) Chiral sign induction by vortices during the formation of mesophases in stirred solutions. Science 292(5524):2063-2066.
24. Ribó JM, El-Hachemi Z, Crusats J (2013) Effects of flows in auto-organization, self-assembly, and emergence of chirality. Chirality in chemistry and biophysics. Rend Fis Acc Lincei 24(3):197-211.
25. Dressel C, Reppe T, Prehm M, Brautzsch M, Tschierske C (2014) Chiral self-sorting and amplification in isotropic liquids of achiral molecules. Nat Chem 6(11):971–977.
26. Smallenburg F, Filion L, Sciortino F (2014) Erasing no-man’s land by thermodynamically stabilizing the liquid–liquid transition in tetrahedral particles. Nat Phys 10(9):653-657.
27. Nilsson A, Pettersson LGM (2015) The structural origin of anomalous properties of liquid water. Nat. Commun. 6:8998 doi: 10.1038/ncomms9998.
28. Elia V, et al. (2013) Experimental evidence of stable aggregates of water at room temperature and normal pressure after iterative contact with a Nafion® polymer membrane. Water 5:16-26.
29. Elia V, Napoli E, Niccoli M (2013) Physical–chemical study of water in contact with a hydrophilic polymer: Nafion. J Therm Anal Calorim 112(2):937-944.
30. Elia V, Lista L, Napoli E, Niccoli M (2014) A Thermodynamic characterization of aqueous nanostructures of water molecules formed by prolonged contact with the hydrophilic polymer Nafion. J Therm Anal Calorim 115(2):841-1849.
31. Yinnon TA, Elia V, Napoli E, Germano R, Liu Z-Q (2016) Water ordering induced by interfaces: an experimental and theoretical study. Water 7:96-128.
32. Elia V, Germano R, Napoli E (2015) Permanent dissipative structures in water: The matrix of life? Experimental evidences and their quantum origin. Curr Top Med Chem 15(6):559-571.
33. Capolupo A, et al. (2014) Self-similarity properties of Nafionized and filtered water and deformed coherent states. Int J Mod Phys B 28(3):1450007.
34. Zhang Y, Takizawa S, Lohwacharin J (2015) Spontaneous particle separation and salt rejection by hydrophilic membranes. Water 7:1-18.
35. Mauritz KA, Moore RB (2004) State of understanding of Nafion. Chem Rev 104:(10)4535-4586.
36. Segarra-Martí J, Coto PB, Rubio M, Roca-Sanjuán D, Merchán M (2013) Towards the understanding at the molecular level of the structured-water absorption and fluorescence spectra: A fingerprint of π-stacked water. Mol Phys 111(9-11):1308–1315.
37. Yinnon TA, Liu Z-Q (2015) Domains formation mediated by electromagnetic fields in very dilute aqueous solutions: 2. Analyses of experimental data on solutions of strong electrolytes. Water 7:48-69.
38. Zheng JM, Chin WC, Khijniak E, Khijniak E Jr., Pollack GH (2006) Surfaces and interfacial water: Evidence that hydrophilic surfaces have long-range impact. Adv Colloid Interface Sci 127(1): 19–27.
39. Lo S-Y (1996) Anomalous state of ice. Mod Phys Lett 10(19): 909-919.
40. Chai B-H, Zheng J-M, Zhao Q, Pollack GH (2008) Spectroscopic studies of solutes in aqueous solution. J Phys Chem A 112(11):2242-2247.
41. Yinnon CA, Yinnon TA (2009) Domains in aqueous solutions: theory and experimental evidence. Mod Phys Lett 23(16):1959-1973.
42. Ryzhkina IS, et al. (2012) Self-organization of Sodium Chloride solutions in the absence and presence of a biologically active substance of low concentration under common and hypoelectromagnetic conditions. Dokl Phys Chem 446(2):184-189.
43. Konovalov AI (2013) The formation of nanosized molecular ensembles in highly dilute aqueous solutions. Her Russ Acad Sci 83(6):513–519.
44. Konovalov AI, Ryzhkina IS (2014) Reviews: Formation of nanoassociates as a key to understanding of physicochemical and biological properties of highly dilute aqueous solutions. Rus Chem Bull Int Ed 63(1):1-14.
45. Cabral do Couto P, Chipman DM (2012) Insights into the ultraviolet spectrum of liquid water from model calculations: The different roles of donor and acceptor hydrogen bonds in water pentamers. J Chem Phys 137(18):18430.
46. Quickenden TI, Irvin JA (1980) The ultraviolet absorption spectrum of liquid water. J Chem Phys 72(8):4416-4428.
47. Fasman GD Ed. (1996) Circular Dichroism and the Conformational Analysis of Biomolecules (Springer Science+Business Media, New York).
48. Suresh SJ, Naik VM (2000) Hydrogen bond thermodynamic properties of water from dielectric constant data. J Chem Phys 113(21):9727-9732.
49. Belovolova LV, Glushkov MV, Vinogradov EA, Babintsev VA, Golovanov VI (2009) Ultraviolet fluorescence of water and highly diluted aqueous media. Phys Wave Phenom 17(1):21-31.
50. Liu Y-J, Roca-Sanjuán D, Lindh R (2012) Computational photochemistry and photophysics: the state of the art. Photochemistry 40:42-72.
51. Liu Y, Song C-Y, Luo X-S, Lu J, Ni X-W (2007) Fluorescence spectrum characteristic of ethanol–water excimer and mechanism of resonance energy transfer. Chin Phys Soc 16(5):1300-1306.
52. Segarra-Martí J, Roca-Sanjuán D, Merchán M (2014) Can the hexagonal ice-like model render the spectroscopic fingerprints of structured water? Feedback from quantum-chemical computations. Entropy 16(7):4101-4120.
53. Pang X-F (2014) Water: Molecular Structure and Properties (World Scientific Publishing, Singapore), pp. 217-219.
54. Del Giudice E, Tedeschi A, Vitiello G, Voeikov V (2013) Coherent structures in liquid water close to hydrophilic surfaces. J Phys:Conf Ser 442:012028.
55. Carrasco J, Santra B, Klimeš J, Michaelides A (2011) To wet or not to wet? Dispersion forces tip the balance for water-ice on metals. Phys Rev Lett 106(2): 026101.
56. Ferri N, DiStasio RA Jr., Ambrosetti A, Car R, Tkatchenko A (2015) Electronic properties of molecules and surfaces with a self-consistent interatomic van der Waals density functional. Phys Rev Lett 114(17):176802.
57. Bunkin N, et al. (2013) Study of the phases states of water close to the Nafion interface. Water 4: 129-154.
58. Chai B, Mahtani AG, Pollack GH (2012) Unexpected presence of solute-free zones at metal-water interfaces. Contemp Mater 3(1):1-12.
59. Preparata G (1995). QED Coherence in Matter. World Scientific, Singapore, New Jersey, London, Hong Kong.
60. Fiorini RA (2016) Arbitrary multi-scale (AMS) systems biology and biomedical engineering effective modeling and simulation. International Journal of Biology and Biomedical Engineering (BIBIEN) 10:61-71.
61. Buch V, Tarbuck T, Richmond GL, Groenzin H, Li I, Shultz MJ (2007) Sum frequency generation surface spectra of ice, water, and acid solution investigated by an exciton model. J Chem Phys 127(20): 204710.
62. Noguchi H, Hiroshi M, Tominaga T, Gong JP, Osada Y, Uosaki K (2008) Interfacial water structure at polymer gel/quartz interfaces investigated by sum frequency generation spectroscopy. Phys Chem Chem Phys10 (32): 4987-4493.
63. Mártonfalvi Z and Kellermayer MSZ (2008) Nanomechanics of exclusion-zone water. Proceedings of 2008 Meeting on Physics, Chemistry and Biology of Water, Mount Snow, Vermont, USA.
64. So E, Stahlberg R, Pollack GH (2011) Exclusion zone as intermediate between ice and water. In: Water and Society. WIT Press, Southampton.
65. Chai B, Yoo H, Pollack GH (2009) Effect of Radiant Energy on Near-Surface Water. J Phys Chem B 113: 13953-13958.
66. G. Vitiello (2014) On the Isomorphism between Dissipative Systems, Fractal Self-Similarity and Electrodynamics. Toward an Integrated Vision of Nature. Systems 2:203-216.
67. Yinnon TA, Liu Z-Q (2015a). Domains Formation Mediated by Electromagnetic Fields in Very Dilute Aqueous Solutions: 1. Quantum Electrodynamic Aspects. WATER Journal 7: 33-47.
68. Yinnon TA, Liu Z-Q (2015) Domains formation mediated by electromagnetic fields in very dilute aqueous solutions: 3. Quantum Electrodynamic Analyses of Experimental Data on Solutions of Weak Electrolytes and Non-electrolytes. Water 7:70-95.
69. Ryzhkina IS, Kiseleva YuV, Timosheva AP, Safiullin RA, Kadirov MK, Valitova YuN, Academician Konovalov AI (2012) Low-Concentration Aqueous Solutions of an Amphiphilic Calix[4]resorcinarene Derivative: Self-Organization, Physicochemical Properties, and Biological Activity under Common and Hypoelectromagnetic Conditions. Dokl Phys Chem 447: 193-199.
70. Pershin SM, Bunkin AF, Grishin MYa , Davydov MA, Lednev VN, Palmina NP, Fedorov AN (2015) Correlation of Optical Activity and Light Scattering in Ultra_Low_Concentrated Phenosan–Potassium Aqueous Solutions. Dokl Phys 60:114–117.
Discussion with Reviewers
Anonymous Reviewer: The authors make reference to papers where Nafionized wa-ter’s quantum dynamics is discussed. Their observations are, however, at a molecular level. Can they better clarify where in their measurements the “quantum connection” appears as an essential ingredient?
V. Elia, T.A. Yinnon, R. Oliva, E. Napoli, R. Germano, F. Bobba, A. Amoresano: The size of the aggregates in INW may reach tens of microns (µm), as for example evidenced by Fluorescence microscopy — see Fig. 1. In depth analyses, carried out by G. Preparata, have shown that self-organization of such large molecular structures is mediated by electro-dynamic (ED) interactions, i.e., by interactions between electromagnetic fields and the molecules (59). The span of these interactions is in the range of sub-microns to hundreds of microns.
The customary models of liquids assume that only short (nm) range electro-static (ES) interactions significantly affect the structure of liquids. Coulomb forces among molecules underlie these interactions. These customary models explicitly include ES interactions, but describe ED interactions as small perturbations or often ignore these altogether. These ES models can only account for self-organization of clusters with sizes of a few nm. A recent elaborate discussion of the implications of ED interactions for modeling and simulations has been presented in Ref. 60. For the µm sized H2O ordering in water induced by Nafion, or by other hydrophilic membranes or by reactive metal surfaces (38, 58), the customary classical physics or quantum mechanics ES models proved to be inadequate, as discussed in Refs. 31, 32 and 54. For example, molecular dynamics simulations solely including ES interactions, carried out in tandem with experiments, have shown that polarization by polar surface groups can only lead to few nm sized H2O orderings adjacent to hydrophilic surfaces (61, 62). Yet, experiments have shown that on immersing a Nafion membrane, or another hydrophilic membrane or a reactive metal sheet in water, a wide interfacial zone forms (38, 58). The width of the zone depends on the properties of the membrane or sheet. It may reach tens or hundreds of microns. Tests showed that the zone is not due to pressure by polymer strands dissociating via reptation, pressure by entropic polymer brush or direct force resulting from moving phase boundaries (63). The zone’s properties signify it is a kind of intermediate between ice and bulk water (64). The analyses which we presented in Ref. 31 indicated that during the preparation of INW, the immersion of a Nafion membrane in pure water caused part of the H2O to aggregate in its interfacial water and to form the zone; the subsequent stirring of the liquid ruptured clumps of the H2O aggregates and dispersed these in the neighboring bulk water.
The need for an ED model for elucidating properties of the zone’s water is also apparent from the following phenomena: The zone widens on irradiation and narrows on onset of darkness (65). The effects of irradiation were shown not to be attributable to temperature changes.
The prerequisite for a quantum ED (QED) model for elucidating properties of INW, is apparent from their following characteristics:
The self-similar and dissipative characteristics of INW imply that QED interactions play a role in these liquids (33, 66).
Aspects of the thermodynamics of the residue left over after lyophilizing INW were shown to conform to effects caused by QED interactions. The QED model of aqueous systems has predicted that the dispersion interactions among H2O and the dispersion interactions between H2O and a hydrophilic membrane lead to stabilization of an aggregate type denoted as ![]() (31, 54). Accurate description of dispersion forces requires a QED approach (54, 59, 67). In 1995, G. Preparata predicted the transition temperature below which
(31, 54). Accurate description of dispersion forces requires a QED approach (54, 59, 67). In 1995, G. Preparata predicted the transition temperature below which ![]() may form is 227 oC at ambient pressures (59). In Ref. 31, we presented the first experimental verification for this temperature.
may form is 227 oC at ambient pressures (59). In Ref. 31, we presented the first experimental verification for this temperature.
Anonymous Reviewer: Figures 3 and SI Appendix Fig. S1 — I was surprised by seeing a polymeric network formed on the surface. What is a possible source of fibrils that link aggregates?
V. Elia, T.A. Yinnon, R. Oliva, E. Napoli, R. Germano, F. Bobba, A. Amoresano:As noted in the main text, the residues left over after lyophilizing INW were composed of H2O, as their mass spectroscopy, MALDI-TOF and GC coupled to electron impact ionization analyses evidenced. The residues only contained minuscule amounts of contaminants. Thus, impurities cannot underlie the hundreds of nm sized fibrils and irregularly shaped aggregates (chunks).
The residue is composed of two different types of H2O orderings (31). Thermogravimetry of the residue revealed thermodynamic aspects of these two types of orderings (31). One type had characteristics typical of the ![]() mentioned above. The other type was denoted as
mentioned above. The other type was denoted as ![]() in Ref. 31. A
in Ref. 31. A ![]() is composed of H2O which resonate between their ground electronic state and an excited electronic state. The size of a
is composed of H2O which resonate between their ground electronic state and an excited electronic state. The size of a ![]() is about 100 nm. An
is about 100 nm. An ![]() is composed of H2O which resonate between two rotational states. The H2O in
is composed of H2O which resonate between two rotational states. The H2O in ![]() are ferroelectric ordered. Accordingly,
are ferroelectric ordered. Accordingly,![]() have a net electric dipole moment. The size of an
have a net electric dipole moment. The size of an ![]() may reach hundreds of microns.
may reach hundreds of microns.![]() and
and ![]() may agglomerate into supra-orderings, i.e., supra-
may agglomerate into supra-orderings, i.e., supra-![]() and supra-
and supra-![]() . Supra-
. Supra-![]() are not ensembles of molecules but agglomerates of
are not ensembles of molecules but agglomerates of ![]() , like domains in liquid crystals. Also supra-
, like domains in liquid crystals. Also supra-![]() are not ensembles of molecules but agglomerates of
are not ensembles of molecules but agglomerates of ![]() . Within a supra-
. Within a supra-![]() , the electric dipole moments of
, the electric dipole moments of ![]() may be parallel or anti-parallel aligned. Supra-
may be parallel or anti-parallel aligned. Supra-![]() may contain supra-
may contain supra-![]() . The H2O of supra-
. The H2O of supra-![]() contained in supra-
contained in supra-![]() reside in a state which is a superposition of the state of H2O in
reside in a state which is a superposition of the state of H2O in ![]() and in
and in ![]() . As discussed in Ref. 31, the various measured physicochemical properties of INW and its residues are attributable to its aggregates consisting of supra-
. As discussed in Ref. 31, the various measured physicochemical properties of INW and its residues are attributable to its aggregates consisting of supra-![]() which contain supra-
which contain supra-![]() .
.
The fibrils in SI Appendix Fig. S1 likely were ![]() . The irregularly shaped chunks observable in SI Appendix Fig. S1 likely were supra-
. The irregularly shaped chunks observable in SI Appendix Fig. S1 likely were supra-![]() . Similar fibrils and chunks have been observed in the deposit of very dilute (10-10 mol/L) aqueous solutions, which were prepared by serial dilutions combined with vigorously shaken after each dilution step (see Fig. 14f in Ref. 44). Analyses of the fibrils and chunks present in such diluted solutions indicated that these structures have the typical properties of, respectively, supra-
. Similar fibrils and chunks have been observed in the deposit of very dilute (10-10 mol/L) aqueous solutions, which were prepared by serial dilutions combined with vigorously shaken after each dilution step (see Fig. 14f in Ref. 44). Analyses of the fibrils and chunks present in such diluted solutions indicated that these structures have the typical properties of, respectively, supra-![]() and supra-
and supra-![]() (68). In other words, it is credible that the polymeric network revealed by AFM in the residues of evaporated drops of INW were supra-
(68). In other words, it is credible that the polymeric network revealed by AFM in the residues of evaporated drops of INW were supra-![]() containing supra-
containing supra-![]() . These supra-orderings constituted the aggregates floating in the INW. On depositing a few drops of INW on the mica substrate and subsequent evaporation of the drops, these supra-orderings were left over. Additional experiments to verify the above explanations for the orderings observable in SI Appendix Fig. S1 are called for. Such experiments might include some of those reviewed in Ref. 44.
. These supra-orderings constituted the aggregates floating in the INW. On depositing a few drops of INW on the mica substrate and subsequent evaporation of the drops, these supra-orderings were left over. Additional experiments to verify the above explanations for the orderings observable in SI Appendix Fig. S1 are called for. Such experiments might include some of those reviewed in Ref. 44.
Anonymous Reviewer: What could be the effect of dissolved carbon dioxide on the electric conductivity of INW?
V. Elia, T.A. Yinnon, R. Oliva, E. Napoli, R. Germano, F. Bobba, A. Amoresano: The electrical conductivity of INW typically is two or three orders of magnitude higher than that of the Milli-Q water from which it is prepared. Therefore, the carbon dioxide contribution to the conductivity of INW is irrelevant.
Anonymous Reviewer: To my understanding, Nafion membrane was initially equilibrated with concentrated sulfuric acid to replace the sodium ion, a counter-ion of Sulfonate group, therefore, it may release proton (H+) to the liquid water during immersing the membrane in the liquid water. Please comment on this as a plausible impact to the CD analysis.V. Elia, T.A. Yinnon, R. Oliva, E. Napoli, R. Germano, F. Bobba, A. Amoresano:The following pH phenomena have been observed when a zone of ordered water built up adjacent to a hydrophilic mebrane (65): First, the pH of the water at the outer border of the zone went sharply downwards. Subsequently, this pH recovered. Yet, its value remained lower than that of the pH of the water prior to immersion of the membrane. The changes in pH began later in water located at larger distances from the membrane. These phe-nomena were interpreted as a wave of pro-tons emerging from the direction of the zone (65).
The pH phenomena were explained by the QED model (31, 54). The electromagnetic field resulting from plasma oscillations of charged particles on the surface of the membrane interacts with the zone’s ![]() ,
,![]() and with the plasma oscillations of its H+ and OH-. These interactions lead to enhanced dissociation of H2O and/or surface groups. The negative charges on the surface resonate with the oscillating negatively charged
and with the plasma oscillations of its H+ and OH-. These interactions lead to enhanced dissociation of H2O and/or surface groups. The negative charges on the surface resonate with the oscillating negatively charged ![]() and solvated ions. The positive charged solvated particles resonate at a different frequency. Consequently, these get expelled from the zone and accumulate at its outer border.
and solvated ions. The positive charged solvated particles resonate at a different frequency. Consequently, these get expelled from the zone and accumulate at its outer border.
The pH of INW is significantly lower than that of bulk water. The pH of INW may reach values as low as 2.5 (28, 29). The QED analyses of INW has indicated that its pH values are attributable to its aggregates being composed of containing (31). Protons released by the membrane cannot have a significant net effect on the pH value. Their counter-ions are linked to the backbone of Nafion. Indeed, the pH phenomena were not affected by prolonged (months) reuse of the membrane.
As to protons impacting on the circular dichroism (CD) of INW, we have not yet been able to conjecture any possible mechanism for the achiral protons inducing optical activity. Moreover, we did not observe optical activity for other solutions containing ![]() and
and ![]() . For example, we searched in vain for optical activity in very dilute aqueous solutions, which were at least 12 times centesimally diluted and vigorously shaken after each dilution step. We showed that these solutions contained aggregates (32). Our analyses of many of the physicochemical variables of such solutions indicated that their aggregates consist of
. For example, we searched in vain for optical activity in very dilute aqueous solutions, which were at least 12 times centesimally diluted and vigorously shaken after each dilution step. We showed that these solutions contained aggregates (32). Our analyses of many of the physicochemical variables of such solutions indicated that their aggregates consist of ![]() and
and ![]() (32, 37, 68). However, only for such solutions prepared from specific solutes, optical activity was observed. For example, optical activity was observed for serially diluted vigorously shaken solutions of a membranotropic amphiphilic calix[4] resorcinarene containing tris(hydroxy-methyl)methylamide functional groups (69). The concentration of the solute was in the 10-9-10-10 M range. [This is a compound with structure and properties rendering it a simple synthestic model of natural polypeptide cluster glycoconjugates inducing cascades of physiological reactions when binding to cell membranes (69).] It was also observed when the solute was potassium phenosan [potassium salt of beta-(4-hydroxy-3,5-ditretbutyl-phenyl)-propionic acid] (70). The concentration of the solute was in the 10-4-10-14 M range. INW does not contain such complex solutes. It only contains Fluorine and Sulfate ions at concentration of about 10-6 M. Therefore, its circular dichroism seemingly is due to a chiral conformation of aggregates evolving during the slow liquid-liquid transition induced by the membrane in its adjacent water.
(32, 37, 68). However, only for such solutions prepared from specific solutes, optical activity was observed. For example, optical activity was observed for serially diluted vigorously shaken solutions of a membranotropic amphiphilic calix[4] resorcinarene containing tris(hydroxy-methyl)methylamide functional groups (69). The concentration of the solute was in the 10-9-10-10 M range. [This is a compound with structure and properties rendering it a simple synthestic model of natural polypeptide cluster glycoconjugates inducing cascades of physiological reactions when binding to cell membranes (69).] It was also observed when the solute was potassium phenosan [potassium salt of beta-(4-hydroxy-3,5-ditretbutyl-phenyl)-propionic acid] (70). The concentration of the solute was in the 10-4-10-14 M range. INW does not contain such complex solutes. It only contains Fluorine and Sulfate ions at concentration of about 10-6 M. Therefore, its circular dichroism seemingly is due to a chiral conformation of aggregates evolving during the slow liquid-liquid transition induced by the membrane in its adjacent water.
Supplementary Information Appendix
I. Supplementary Information Texts
- Text S1 — Examples of presuppositions for the origins of biohomochirality
- Text S2 — Chiral liquid crystals composed of achiral molecules
- Text S3 — Excimers and their UV fluorescence spectra
- Text S4 — The quantum mechanic H38O20 excimer-based description of water adjacent to Nafion (WAN) versus the quantum dynamic description
- Text S5 — Possible transitions underlying the UV-vis spectra of INW
II. Supplementary Information Materials and Methods
II.1 Materials
II.2 Methods
II.2.1 Fluorescence Microscopy
II.2.2 Scanning electron microscopy — SEM
II.2.3 Atomic force microscopy — AFM
II.2.4 Gas Chromatography (GC) coupled with Mass Spectrometry (MS)
II.2.5 Matrix-assisted laser desorption/ionization time of flight (MALDI-TOF) coupled with mass spectroscopy (MS)
II.2.6 Ion Chromatography (IC)
II.2.7 Electric conductivity measurements
II.2.8 CD spectroscopy
II.2.9 Thermal treatment of INW samples
II.2.10 Fluorescence spectroscopy
III. Supplementary Information Figures
- Figure S1 — Topographic AFM measurements of INW
- Figure S2 — Mass spectrum of principal components eluting at 1.6 min from RINW
- Figure S3 — MALDI-TOF mass spectrum of RINW
- Figure S4 — Mass chromatogram of RINW
- Figure S5 — CD of oven-heated INW
IV. Supplementary Information Tables
Table S1 – Concentration of the main inorganic molecules present in Nafion membranes
V. Supplementary Information Video
Video S1 — Fluorescence microscopy of the dynamical behavior of INW and of the control bulk Milli-Q water
I. Supplementary Information Text
Text S1 — Examples of presuppositions for the origins of biohomochirality
Processes hypothesized to underlie biohomochirality vary widely (4), e.g., synthesis of organic racemates in primeval Earth’s conditions and in Space, with deracemization via asymmetric photolysis by the action of circularly and elliptically polarized light; photosynthesis of optically active compounds; parity violating energy differences and magnetochiral dichroism; optically active amino acids in meteorites; chiral amplification of enantioselectivity, asymmetric autocatalyses or asymmetric adsorption by crystals.
The possibility that certain properties of water play a role in biomolecular homochirality has been put forward. For example the differences between the two spin isomers of H2O (ortho-H2O wherein the protons are parallel and para-H2O wherein the protons are anti-parallel) might play a role. Deviation from physical invariance between dextro- and levo-rotatory polyamino acids might stem from differences in their hydration. Experimental findings allude to ortho-H2O, which constitutes 75% of bulk H2O, has a preferential affinity to levo-rotatory polyamino acid enantiomers (5).
Text S2 — Chiral liquid crystals composed of achiral molecules
Some liquid crystals (LC) composed of achiral molecules are chiral (14-20), e.g.:
- LC composed of some bent-core molecules (BCM) are chiral. BCM contain two mesogenic groups linked through an aromatic ring, e.g., 1,3-phenylene bis[4-(4-n-alkoxyphe-nyl-iminomethyl benzoates] (14). Causes underlying the chirality of LC BCM do vary. For example, in their B2 phase, the combination of uniform tilt and unidirectional ordering of the bows of the closely packed BCM in the smectic layers brings about the chirality (see Fig. 2 in Ref. 14). In their B4 phase, conformational chirality plays a role: it results from the two ester groups of the BCM being twisted with respect to their central ring and not being perpendicular to the molecular long axis (See Fig. 41 in Ref. 14). Right- and left-handed optical domains constitute these LC. The ratio of the areas of the domains is alterable. For instance, irradiation with circularly polarized light or chiral surfaces may alter the ratio (14).
- Some LC composed of achiral hydrocarbon chain-linked mesogenic dimers (HCLMD) recently were shown to be chiral, e.g., HCLMD like cyano-biphenyl-base dimer with a chain length of 9, or 1ʺ,7ʺ-bis (4-cyanobiphenyl-4 ʹ-yl)heptane) (19, 20). These HCLMD have a LC nematic phase wherein their molecules are organized in chiral domains of opposite handedness. Analyses carried out hitherto indicate that the HCLMD organizing in twist-bend helical structures underlie their properties.
Text S3 — Excimers and their UV fluorescence spectra
Excimers play crucial roles in many biological processes (50). The main characteristics of excimers are the following ones (36, 50): An excimer is composed of two identical molecules (monomers). The monomers in their ground electronic state repel each other. However, when one of the monomers resides in an excited electronic state and its partner resides in its ground electronic state, these attract each other. An excimer forms by a monomer absorbing ambient UV radiation to access one of its excited electronic states, and subsequently it binds a monomer residing in its ground electronic state. For the binding to take place, the distance between the monomers has to be sufficiently small, i.e., the density of the monomer ensemble should be large enough. The bonding of the monomers in excimers is due to resonance: the excited monomers emit radiation and return to their ground electronic state, while their partners absorb the radiation and transit to their excited electronic state; iteration of the emission and absorption processes by the monomers constituting the excimer bind these together.
The UV-vis fluorescence spectra of excimers characteristically consist of rather featureless broad bands. To appreciate the properties of the electronic transitions underlying such bands, we remind that UV fluorescence typically is the end result of the following processes (50): Molecules absorb UV radiation, causing their excitation to an excited electronic state. Subsequently, the molecules collide with other molecules, resulting in their deexcitation to the lowest vibrational level of their excited electronic state. After that, the molecules emit UV radiation and transit to their ground electronic state. Whenever various vibrational levels are superimposed on the ground electronic state, the molecules may transit to each level, resulting in sharp peaks in the fluorescence spectrum. When no such vibrational levels exist, the emission spectrum has no sharp peaks. Excimers do not have vibrational levels in their ground state (36, 50, 51) – a “deexcited excimer”has no inter-monomer vibrational levels, because the monomers in their ground electronic state repel each other. Hence the wavelengths of the radiation emitted by excimers span a continuum.
Text S4 — The quantum mechanic H38O20 excimer-based description of water adjacent to Nafion (WAN) versus the quantum dynamic description
In the H38O20 excimer, each of the two central (fused) H2O of one monomer attracts its opposite central (fused) H2O of the other monomer (See Fig. 6 in Ref. 52). The attractive interaction is due to π-stacking. In the H38O20 networks, supposedly constituting WAN, the π-stacked H2O resonate between their ground and an excited electronic state (52), i.e., about 10 percent of the H2O constituting WAN are simultaneously electronically excited.
According to the quantum dynamic description of WAN (54), on immersing a hydrophilic membrane in water, its adjacent H2O get electronically excited by ambient radiation with wavelength λ. These H2O deexcite by emitting photons which immediately get absorbed by H2O located within a distance λ. The subsequent repetitive excitation-deexcitation processes associate these H2O into an aggregate (which in accordance with Ref. 31 we denote as ). About 10 percent of the H2O within a simultaneously reside in their excited electronic state (54).
A significant similarity between the H38O20 and models is their prediction of the percentage of the H2O simultaneously residing in their excited electronic state. One of the differences between the models is that the former predicts that the π-stacked H2O resonate between two of their electronic states (52), while the latter predicts that all of the about 106 H2O composing a resonate between two of their electronic states (31, 54).
Text S5 — Possible transitions underlying the UV-vis spectra of INW
The UV-vis fluorescence spectra of INW consist of a broad band with the following features (see Fig. 7):
- Two broad shoulders at about 385 nm and 325 nm.
- A maximum with a shallow dent, i.e., two bumps at about 360 nm and 340 nm. The bump at 360 nm is slightly higher than that at 340 nm, i.e., the maximum of the spectrum is at about 360 nm.
Assigning the transitions underlying these features requires CASPT2 or other computations. Such computations are outside the scope of this paper. Still we can gain some clues from the CASPT2 explanations for the measured fluorescence of water adjacent to Nafion at a distance of 450 micron from the membrane (WAN-450). As noted in the main text, the UV absorbance features of INW closely resemble those of WAN-450.
On exciting WAN-450 with 270 nm radiation (the radiation at which the absorbance of WAN-450 is maximal), the maximum in the resulting fluorescence band is at about 440 nm (40). According to CASPT2 (52), WAN-450’s absorbance maximum is due to the H38O20’s singlet → singlet electronic transition from its 11Ag groundstate to its 21B1u excited state, which is mediated by 271 nm photons (see Fig. 8 in Ref. 52). Subsequent to this transition, interactions between the 21B1u and some other excited states result in the H38O20 accessing its 31Ag state, which is the only low-lying excited state with a minimum in its potential energy curve. From its 31Ag state the H38O20 unit deexcites by emission of 441 nm photons (see Fig. 8 in Ref. 52). The differences between the excited states responsible for the absorption maximum at 270 nm (21B1u) and the fluorescence maximum at 441 nm (31Ag) explain the large Stokes shift. The differences are related to the inter-monomer distance (R) within the H38O20. R symbolizes the separation between the monomers’ fused O atoms (see Fig. 6b in Ref. 52). For H38O20 in their 11Ag groundstate R equals 2.115 Å, while in their excited 31Ag state R equals 2.390 Å.
The authors of the abovementioned CASPT2 results noted in their recently published paper that they are carrying out additional calculations directed at a full characterization of the triplet manifold of H38O20 (52). Yet they already reported a few wavelengths of such transitions for H38O20 (52). Some are close to those of INW’s fluorescence features. We emphasize that their closeness does not mean that we can assign the features to these transitions. Interactions among electronic states are intricate (50), e.g., transitions may be forbidden, their oscillation strength may be very small and adiabatic processes may be important. Each assignment requires detailed computations. Nevertheless mentioning the closeness hopefully will stimulate such computations. So we cite the following:
- The lowest triplet state 13B2u and the lowest singlet state 11Ag are degenerate and the predicted wavelength of the 13B2u↔23B3g triplet ↔ triplet vertical transition is 318 nm (52), i.e., like that of one of the shoulders of the fluorescence band of INW.
- The predicted wavelength of the transition between the minimum of the excited 31Ag state and the 11Ag ground state is 387 nm (52), i.e., close to that of the other shoulder of INW’s fluorescence band.
- The predicted wavelength of the vertical transition between the minimum of the 11Ag ground state and the 31Ag state is 357 nm (52), i.e., like that of the maximum in the fluorescence of INW. This vertical transition is particularly noteworthy, because WAN-450 has a sharp absorbance peak at about 360 nm (see Fig. 4 in Ref. 38).
II. Supplementary Information Materials and Methods
II.1 Materials
The materials used for preparation of INW, its preparation protocol and the method for obtaining its solid residues are detailed in Ref. 28-31.
II.2 Methods
II.2.1 Fluorescence Microscopy
The illumination source of the microscope is a 100 W Hg lamp. A specific wavelength of excitation and emission of light has been selected through a set of dichroic filters. Images generated from the emission of fluorescence have been observed both by an ocular and through a Hamamatsu ccd/cmos 20x photo-camera via an inverted Olympus x71. The max resolution of the photo-camera was 1920 x 1440 pixel with a ratio of 8.26 pixel/micron. 1% in weight of a polystyrene latex beads solution dispersed in 1 ml of sample (INW) and in 1 ml of Milli-Q water (control) has been used in order to observe the Brownian motion of the particles dispersed in INW and in the control. The beads of carboxylate-modified polystyrene had a size of 200 nm and each particle carried fluorescent green probes purchased from The Thermo Scientific. These had internally dyed microsphere suspensions that feature bright, high contrast colors emitting bright and distinct colors when illuminated by 465 nm light. Trace amounts of surfactant to inhibit agglomeration and promote stability were present on the surface of each bead.
II.2.2 Scanning electron microscopy – SEM
RINW images were obtained with the SEM – EDX FEI – Ispect S, Column E-SEM W. Source: 200V – 30 kV. Filament: tungsten. Microanalysis: EDAX.
II.2.3 Atomic force microscopy – AFM
AFM measurements were performed using a Multimode Nanoscope V system (VEECO, Santa Barbara, CA), equipped with a 15 µm scanner (EVLR-scanner), in tapping mode configuration. For imaging under dry conditions, antimony (n) doped Si cantilevers with a spring constant of about 30N/m and a nominal tip radius of 10 nm (NCHV VEECO) were used. The cantilever resonant frequency was about 284 kHz with a quality factor Q of 254. Topographic AFM were acquired in tapping mode. (Typical scan rate ranged in 1-2 Hz and the average tapping force in 0.2-0.6 Nn). AFM samples were prepared by dropping 10 µl of INW onto a freshly-cleaved mica surface, dried with nitrogen and transferred to the AFM microscope for imaging. AFM experiments were performed in a glove-box in order to keep the temperature constant (during one hour it oscillates by less than 0.3 °C) and to reduce acoustic noise interferences.
II.2.4 Gas Chromatography (GC) coupled with Mass Spectrometry (MS)
The GC analyses were performed with a Agilent 6890 Series GC, coupled to a detector MS 5973. A DB-5ms capillary column (30 m × 0.25mm ID, 0.25µm film, 5% phenyl 95% polydimethylsiloxane) was used for the analyses by using Helium flushed as carrier gas at a flow-rate of 1.0 mL/min. The gradient used for analysis was as follows: 45 °C for 3 min, 150 °C to 12 °C/min, 230 °C to 18 °C/min, 250 °C to 19 °C/min. The analyzer of the GC was maintained at 250 °C. The collision energy in the source was set to 70 eV and the resulting fragment ions were analyzed in the mass range 18-450 m/z.
II.2.5 Matrix-assisted laser desorption/ionization time of flight (MALDI-TOF) coupled with mass spectroscopy (MS)
MALDI-TOF spectra were acquired by using a 4800 Plus MALDI-TOF/TOF mass spectrometer from AB Sciex. Aliquots of samples (1 L) were directly mixed on the plate sample holder with an equal volume of α-cyano matrix dissolved in 70% ACN, 30% formic acid 0.1% (10 mg/mL). The analyses were performed in positive mode, setting the instruments in the reflector mode, in the mass range 100-500 m/z. Laser power was set to 3500 V for MS spectra acquisition. Each spectrum represents the sum of 3000 laser pulses from randomly chosen spots per sample position. All analyses were performed in triplicate. Raw data were analyzed using Data Explorer Software, version 4.9 (build 115), from Applied Biosystems. The data are reported as monoisotopic masses.
II.2.6 Ion Chromatography (IC)
We determined the concentration of inorganic molecules, which hypothetically might be present in the Nafion membranes, by the following processes: We incinerated membranes in an alkaline environment, dissolved the calcinated samples in aqueous HNO3 and investigated the resulting solutions with IC. The details of these processes are: We thoroughly minced a membrane sheet weighing 134.8 ± 0.1 mg, and subsequently mixed it with 2.5 g of alkaline Eschka (MgO / Na2CO3 in 2:1 ratio); we calcined the mixture in a muffle at 600 °C, for 3 hours, in a porcelain crucible with a lid; the calcinated sample we dissolved in aqueous HNO3 1M; the resulting solution we neutralized by adding aqueous NaOH 1M until its pH was 7; to obtain a 200 ml solution, we added ultrapure water (conductivity <0.06 μS/cm); we investigated the presence of inorganic molecules in the solution with the APAT IRSA CNR 4020 Man 29/2003 IC method. We used a Metrohm IC 883 with conductivity detector, with an ASupp7 column (250 mm length, 4.0 mm diameter) consisting of a stationary phase of polyvinyl alcohol functionalized by quaternary ammonium groups with a particle size of 5 μm and a mobile phase consisting of a solution of sodium carbonate 3.6 mM. The IC results we compared with those obtained by analyzing a “blank”. The “blank” we prepared according to the same procedures, using the same reagents at the same quantities as those used for preparing the aforementioned solution, with the sole difference that no Nafion was added. The IC analyses’ results are presented in table S1. The results show that only Fluorine (F-) and Sulfate (HSO4–) ions at concentrations, respectively, of 171 mg/g (17% ww) and 73 mg/g (7% ww) are present in the Nafion membranes.
IC analyses of INW samples show that the only inorganic ions present in this liquid are F- and HSO4– ions at concentrations of about 10-6 mol / L.
II.2.7 Electric conductivity measurements
See Ref. 29 – 31.
II.2.8 CD spectroscopy
We recorded Far-UV CD spectra using a JASCO J-715 spectropolarimeter (Jasco Corporation, Tokyo, Japan) as an average of 3 scans with 20 nm/min scan speed, 4 s response time, and 2 nm bandwidth, using a 0.1 or 0.5 cm path length quartz cuvette, at temperature of 20 °C.
II.2.9 Thermal treatment of INW samples
The samples were treated for 20 minutes by the spectropolarimeter at each of the following temperatures: 20/30/50/70/80/ 90 °C, and a spectrum was recorded in the far-UV range as indicated above.
II.2.10 Fluorescence spectroscopy
The fluorescence spectroscopy measure-ments were performed by a Fluoromax-4 from Horiba Scientific (Edison, NJ, USA). It is equipped with a Xenon source. The slits on both the excitation and emission monochromators have a width of 5 nm. The samples were loaded in quartz cuvettes with 1 cm path length. After their loading, we enabled a 15 minutes thermal equilibration. The spectra were recorded at the temperature of 25 oC. As to the successive diluted INW samples, after each dilution we waited at least 15 minutes for their thermal equilibration at 25 °C.
III. Supplementary Information Figures
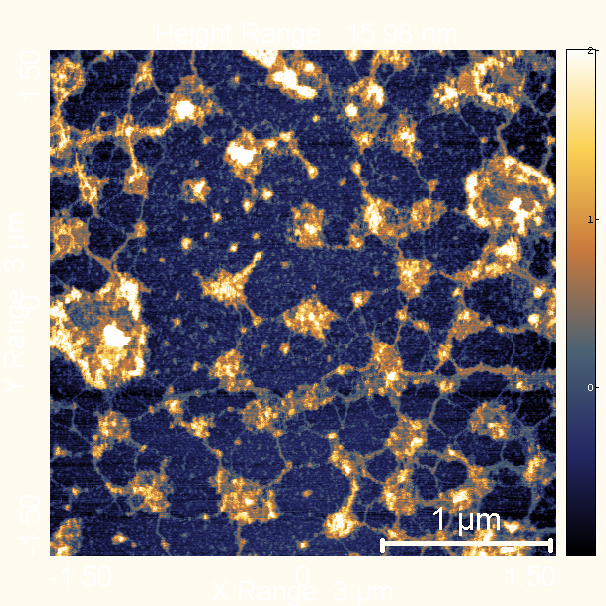
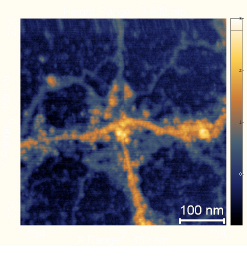
Figure S1. Topographic AFM measurements of INW at 1 µm scale (top) and 100 nm scale (bottom). The false color bar expresses the height of residues in nanometers.
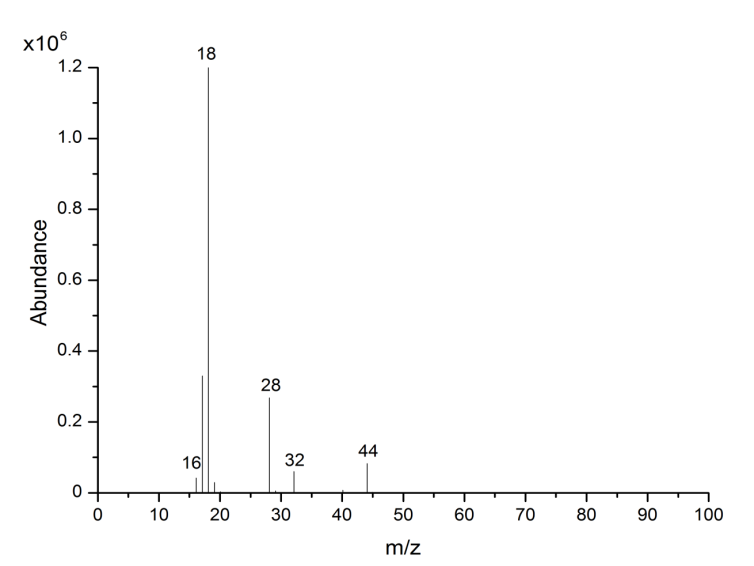
Figure S2. Mass spectrum of principal components eluting at 1.6 min from RINW.The x-axis represents the mass as m/z (mass/valence) ratio of the species and the y-axis represents its abundance. The spectrum shows that the major detectable species are OH, H2O, N2, O2 and CO2. Similar results were obtained for INW.
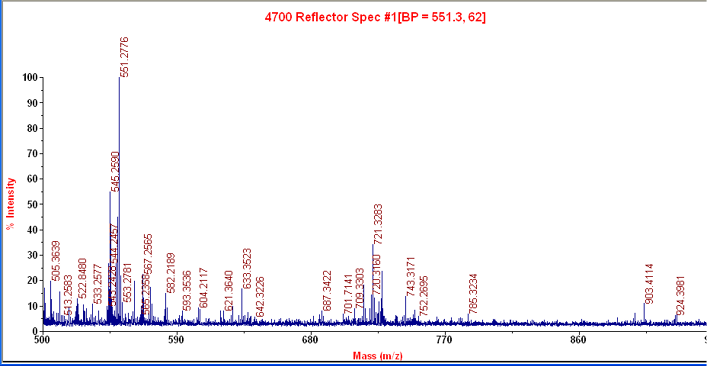
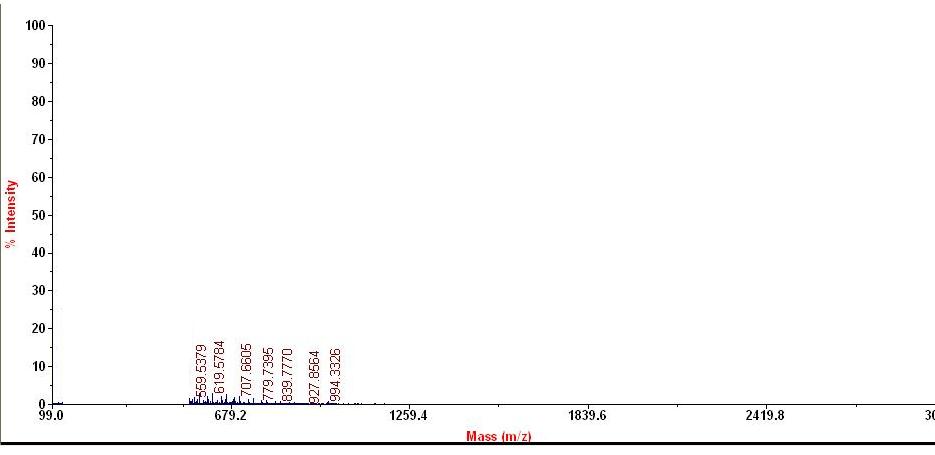
Figure S3. MALDI-TOF mass spectrum of RINW. The x-axis represents the mass as m/z (mass/valence) ratio of the species and the y-axis represents its signal intensity. The top panel displays the spectrum of a RINW aliquot. The bottom panel displays the magnification of the central mass region of the upper spectrum. No major species are detectable. The spectra displays a few weak signals, likely corresponding to miniscule amounts of organic- and bio-molecules in RINW (less than 2% of its mass).

Figure S4. Mass chromatogram of RINW. The x-axis represents the retention time and the y-axis represents the total ion current constituting RINW. No peaks were detected in the samples except for H2O eluting at Rt3.5 min and identified on the basis of the electron impact fragmentation spectrum. Similar results were obtained for INW.
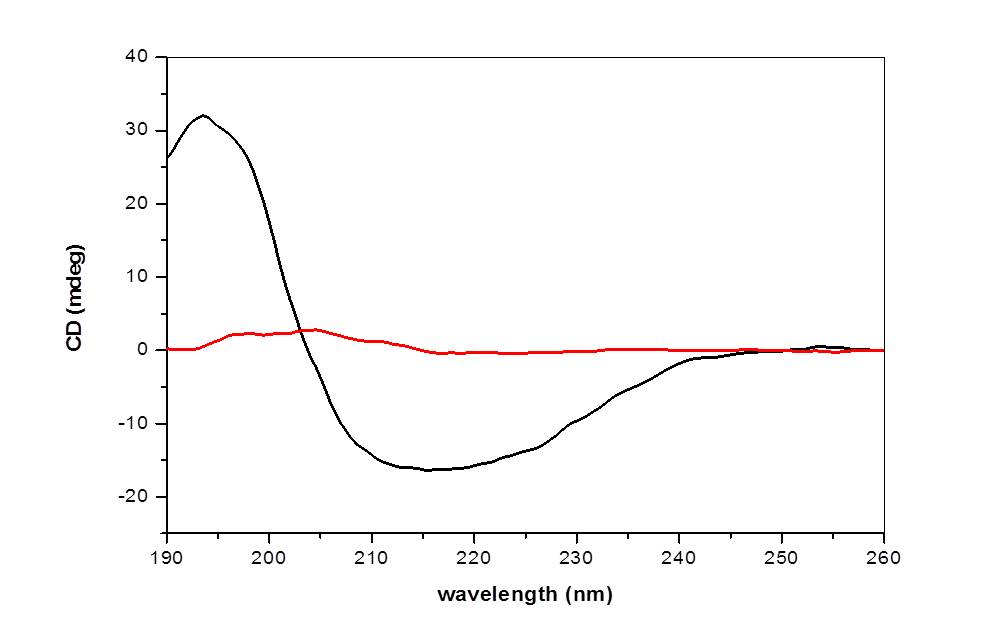
Figure S5. CD of oven-heated INW. The CD in mdeg is plotted as a function of the wavelength in nm for an INW sample with electric conductivity of 610 µS cm-1 at 20 oC (black line), and after it was heated at 90 °C in an oven for three days (red line).
IV. Supplementary Information Table
Table S1 – Concentration of the main inorganic molecules present in Nafion membranes.
|
Material |
Chlorine (mg/g) |
Fluorine (mg/g) |
Sulfur (as sulphate) (mg/g) |
Bromine (mg/g) |
Phosphorus (as phosphate) (mg/g) |
|
Nafion |
< 5* |
171 |
73 |
< 5 |
< 5 |
|
Blank |
< 5† |
< 5 |
< 5 |
< 5 |
< 5 |
*The measured value is 2.9 mg/g; however, it is below the statistical threshold of quantification, 5 mg/g
†The measured value is 3.5 mg/g; however, it is below the statistical threshold of quantification, 5 mg/g
V. Supplementary Information Video
Video S1. Fluorescence microscopy of the dynamical behavior of INW and of the control bulk Milli-Q water.
The video displays the fluorescent microscope images of a 1% in weight carboxylate-modified polystyrene latex beads solution dispersed in INW, and in the control (bulk Milli-Q water). The 200 nm sized beads carry green fluorescent probes and emit bright, high contrast colors when illuminated by 465 nm light. In the control (bulk Milli-Q water) the beads participate in the standard Brownian motion. In INW, irregularly shaped structures are observable. The movements of the beads in INW are constrained in comparison to those in Milli-Q water, demonstrating that the viscosity of the structures is higher than that of bulk water.