
 Daily pH Flux in the Water Media of the Chrysanthemum Root Zone Suggests Evidence of a Circadian Rhythm
Gorman RT1*, Tioran ME1, Sykes AL1, Leidy RB1, Gordon AM1, Harris EP1
1 Research Triangle Park Laboratories, Inc., 7201 ACC Blvd., Suite 104, Raleigh NC 27617
* Correspondence: Phone: (919) 510-0228; Fax: (919) 510-0141; Email: rtg@rtp-labs.com
Key Words: pH flux, circadian rhythm, aquaculture, splitting water, biological clock, plants
Received 4 October 2010; Revised 2 March 2011; Accepted 23 April 2011; Published 22 June 2011; Available Online 1 July 2011
Summary
Cycles in nature have long been observed and recorded, yet only a portion of the biological clock has been described and the origin of the cyclical process remains obscure. The potential causes of circadian rhythms are many—among which light, chemical, and temperature variations are the most likely. We examined the relationship of temperature, nitrogen compounds in water, and pH under both light and dark conditions to determine if a pH oscillation exists. The pH flux observed in the water media of our studies of Chrysanthemum plants indicates a daily circadian rhythm that is reproducible, predictable, and unaffected by the presence or absence of light or nutrients in the media. Moreover, this circadian rhythm was found to occur in one other species. Parity of temperature revealed the pH flux, which has a sine-wave function with observed amplitude of six-plus pH units from pH <3 to pH >9. The trough of pH <3 was attributed to acid exudates in the root environment. The peak of pH >9 was considered to be the result of hydroxyl groups produced by the splitting of water. Peak values of pH >9 observed in this study suggest that a single activity occurs independent of light or dark. If water splitting is the source of this high pH, then proton separation resulting in the formation of hydroxyl groups may be independent of light energy. Water splitting may thus be a common occurrence, although the source of this activity remains unknown. This circadian rhythm—as evidenced by a pH flux—potentially represents a form of biological clock in which the pH flux is an energy-transfer system, which could in turn contribute to some biological activity. The ramifications are that water splitting appears to be independent of light-energy input and a pH change within the cell could have a major influence on metabolic activity.
Article Outline
Introduction
Cycles in nature have been observed and recorded as early as ~300 BC by Theophrastus, and others were later described by De Marian in 1729 AD (Theophrastus, 1916; De Marian, 1729). To this day these early observations have inspired biologists to seek further evidence of rhythms in nature. Despite the many studies that have been performed, the biological clock has yet to be defined. Only a portion of the cellular timepiece has been described, and the driving force of this cyclical process remains obscure. The potential effectors of this circadian rhythm are boundless—with light, chemical, and temperature variations being among the most likely factors.
Frantz studied daily temperature changes of plant communities for 37 days. In his study, night (dark) temperatures had a minimal effect on plant respiration and growth when compared to day (light) temperatures. (Frantz et al., 2004) Tolley and Raper conducted a 31-day study with Glycine max plants comparing low (14ºC) to high (22ºC) temperatures and determined that nitrogen uptake is influenced by temperature. (Tolley LC, Raper CD, 1985) Wurts described both yearly and daily cycles of temperature, pH, and ammonia concentrations in pond water. (Wurts WA, 2003) The ammonia levels peaked during the heat of the day (daylight hours) at the time of increased pH values. High ammonia levels are toxic to fish in pond water, and a relationship between ammonia (NH4-N) excreted from fish gills, high pH (pH >7) levels, and increased temperatures appears to exist. In nutrient-media studies, Mengel and Kirkby noted that nitrate (NO3) increases the pH, and ammonia (NH4-N) depresses the pH. (Mengel K, Kirkby EA, 2001) Thus, the ammonia references reported in these earlier studies are inconsistent.
In a study of proton-chloride symport, an artificially imposed pH gradient was found to mediate chloride influx across the plasmalemma of barley roots (Jacoby B and Rudich B, 1980). In this study, excised barley roots were incubated at 30ºC and pH 6.5, then washed with 10 mM CaSO4 at 10ºC. Changing the external pH to 3.7 from the original pH 6.5 had no effect on the roots. This artificially imposed acidification was the only driving force for transport of Cl- with a H+ symporter present. A study of proton and calcium flux oscillation revealed that at 25ºC under microscope lighting and pH 5.2 (control: pH 6.0) a change in pH could produce the same results. (Shabala SN and Newman IA, 1997) From these investigations of the roles of cations and anions with H+ co-transport, one may conclude that a correlation between H+ flux oscillation and root movement exists. However, selection of a single or several temperature points with a single or several pH values produces a static rather than dynamic observation.
Roos and Boron stated that pH influences cellular functions, one example of which was metabolic control of cell division. (Roos A, Boron WF, 1981) Gerson and Burtron proposed an influence of pH flux on cell division in Physarum, and Gillies and Deamer suggested that Tetrahymena has the same type of pH flux observed in Physarum. (Gerson DF, Burton AC, 1977; Gillies RJ, Deamer DW, 1979) Epel postulated a possible role of pH in the fertilization of sea urchin gametes. (Epel D, 1978) Setlow and Setlow suggested that pH is involved in germination of bacterial spores. (Setlow B, Setlow P, 1980) Lettau et al. suggested a daily cycle or rhythm of pH flux in the cockroach, Leucophaea madera, a multi-cellular organism, and Mori proposed that sea pen, Cavernularia obesa, may have a pH flux on a daily basis. (Lettau J et al., 1977; Mori S, 1960) However, Johnson demonstrated that changes in intracellular pH were not correlated with the circadian rhythm of Neurospora cultures in liquid medium. (Johnson CH, 1983)
Objectives
This relationship of temperature, nitrogen compounds in water, and pH presents questions for further study using Chrysanthemum plants. The objectives of this study were:
- To determine if a pH oscillation or flux exists.
- If found, determine the duration and amplitude of this oscillation or flux.
- To investigate if light or chemicals are involved in pH change.
- To identify if any variable is responsible for a major circadian rhythm in the plant and investigate the casual agent or agents.
- To evaluate root media for by-products related to pH flux.
- To determine if these results are unique to a single plant species.
Methods
Preparation of Test Plants
All plants, (Chrysanthemum x morifolium x michelle hybrid, Yoder Brothers® Inc., www.glplants.com) were grown in aqua culture for this study. Chrysanthemums are a shallow-rooted perennial that have evolved to be a winter hardy plant. The Chrysanthemum plant grows well in much of the northern latitudes where the root mass is frozen in the soil with temperatures below 0ºC for much of the winter. Chrysanthemum plants thrive under these conditions with no ill effects and return every spring to produce fall flowers.
Plant cuttings (~5 cm height) were rooted in a 15-L aqua-culture rooting bed (50.8 cm x 152.4 cm x 20.3 cm). The rooting bed was a recycling, aerated, flow-controlled environment using distilled water without nutrients as growth medium. The cuttings developed into immature plants with a normal root system and obtained a length of ~10 cm from tip of root to top of leaf. At this stage the plants were transferred to the outside ambient environment and grown to attain a 30-g mass (~30 cm height) for testing. The plants were then set into one of two systems: ambient outside (AE, n=100) or the controlled inside (CE, n=100).
The stem and leaf environments defined AE and CE sets, as they shared a similar root media supply from the CE area. These larger systems were the recycling type modified after Hoagland and Arnon with an 8-minute cycle time. (Hoagland DR, Arnon DI, 1938) The AE system (150 cm x 60 cm x 25 cm) was subjected to full sunlight, ambient temperature, and relative humidity. Four 100-watt grow lights and one 450-watt metal-halide light provided artificial lighting for the CE system. The temperatures ranged from 20ºC to 25ºC and relative humidity ranged from 40% to 60%. Light data were not recorded in this study.
Both AE and CE systems received 0.1 Normal (Nitrogen = 22 ppm) in distilled water, a liquid plant-growth medium. This was a modified version of Hoagland’s medium, which contains a full complement of macronutrients (224 ppm N) and micronutrients. Monitoring of pH, temperature, time of day, and date in these systems was maintained continuously 24 hrs/day over the growing season. The experiments conducted in the larger systems (n=100 plants/set) were designed to monitor and establish baseline patterns of pH.
The 4-plant aqua system (n=4 plants/set) consisted of an inner and outer system. This was a modified Hewitt system in which the outer unit was a controlled-temperature water bath that regulated temperatures of the inner unit. (Hewitt EJ, 1966) Testing of the plants for pH change in the select media (~350 mL) at a set temperature was conducted in the inner unit, which contained the pH probe, thermocouple, air frit (standard glass midget impinger, www.skc.com) set to a flow rate 50 mL/min, and thermometer for each plant. The media consisted of either distilled water (no chemicals) or 0.1 Normal plant-growth medium. Temperatures selected for this study were 5ºC, 10ºC, 15ºC, and 20ºC (41ºF, 50ºF, 59ºF, 68ºF).
The first step for testing plant-root environment for pH change in the 4-plant system was the selection of plants from the ambient system. Testing for pH change required a new untested plant for each experiment. These plants received two gentle rinsings with distilled water at the same temperature as the growth media prior to incubation by insertion of the plant into an individual container of 350 mL distilled water and transfer to a dark refrigerator. The refrigerator was set at a specific temperature (5ºC, 10ºC, 15ºC, or 20ºC) for each test. The refrigerator was equipped with a pH probe, thermocouple, air frit (flow rate 50 mL/min), and thermometer for each plant in the pre-test incubation. After incubation, these plants received a rinsing with fresh distilled water at the selected testing temperature and were transferred to fresh distilled water at the selected temperature for the test. The root temperature was consistent with the incubation temperature, with the leaves receiving a temperature adjustment. An additional container with no plant and containing the same growth media was subjected to identical conditions to serve as a control.
Sample Analysis
Analysis of pre- and post-use distilled water and 0.1 Normal plant-growth media was performed with a Shimadzu LC® (www.shimadzu.com) SPD-10A UV detector for acetic acid. Confirmation of acetic acid in the pre- and post-use root media was conducted with a Varian 3400® (www.varian.com) GC-FID with a 105 M Vocol column. Analysis of pre- and post-use distilled water and 0.1 Normal plant-growth media for ammonia and nitrates was performed with an Orbeco Model 975 MP Analyst® (www.krackeler.com). A Perkin-Elmer ELAN 6100 ICP-M® (www.perkinelmer.com) was used for analysis of titanium, silica, and iron in plant tissues (n=24) following EPA Method 6020.
Test Monitoring
Data collection and storage were performed with a Campbell Scientific CR23X Micrologger® (www.Campbellsci.com). Two pH meters (Corning® pH 103 and CMS Labcraft®pH 103) were used for calibrating the pH probes. The pH probes employed in this study were manufactured by Corning® (476530 and 476531), Fisher® (13-620-290), and Orion® (8102BN), and were randomly selected to eliminate any probe effect. When the media temperature equilibrated to the selected test temperature, the pH probes were calibrated in pH 7 buffer at the designated temperature prior to use.
Results
Changes in root environment pH under ambient and controlled conditions in plant-growth media
Chrysanthemum plants (n=100) were rooted and grown in 0.1 Normal (22 ppm Nitrogen) plant-growth media in aquaculture systems for testing. The ambient outside environment (AE) systems were exposed to a normal 24-hour daily light/dark cycle and the controlled environment (CE) systems contained artificial light that mimicked the daily outside cycle for growing plants. A pH flux was observed on only 10 occasions during the growing season in the AE system, but daily in the CE systems. The pH flux data of both AE and CE plotted as a sine-wave function (Figure 1). The pH range for the AE system was from 4.10 to 8.02 and the pH range for the CE system was from 4.04 to 8.14. The control pH mean was 6.77. The control (no plants) represented 10 days of pH data that were expressed as the mean pH values obtained from 120 days of monitoring. These control pH values were obtained from 0.1 Normal plant-growth media in an AE system. Monitoring of the root environment for any pH change was continuous in all test systems (AE, CE) and the control system (PC), which was maintained without the introduction of plants. The pH flux observed occasionally in AE, and daily in CE, consisted of three phases. The first, a rapid increase in pH, and the second, a slower decrease in pH, were followed by a third, another rapid increase in pH.
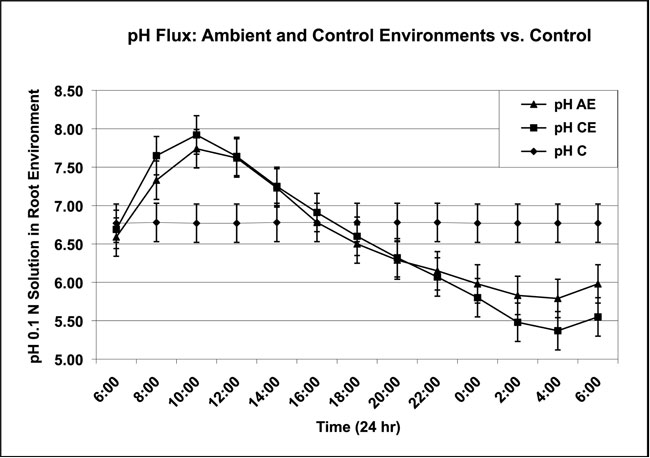
Figure 1: The pH flux displayed by the mean of ambient outside environment (pH AE) and controlled inside environment (pH CE). (Data collected from 200 Chrysanthemum plants in 0.1 Normal plant-growth media. Controls = pH C. All temperatures ±1ºC)
• pH AE: Full sunlight, air temperatures of 5ºC – 40ºC and root temperatures of 18ºC – 28ºC; mean of 10 days of pH flux taken over 120 days of monitoring.
• pH CE: Artificial light, air temperatures of 20ºC – 25ºC and root temperatures of 21ºC – 24ºC; mean of 10 days of pH flux taken over 120 days of monitoring.
• pH C: 0.1 Normal plant-growth solution without introduction of plants in ambient outside environment; mean of 10 days of data taken over 120 days of monitoring.
Effects of Nitrogen on pH Flux Under Ambient and Controlled Conditions
To study the first phase, pH increase, and the possible relationship between pH flux and the presence of nitrogen, a four-plant aqua-culture system in the controlled environment (CE) was required for testing a small group of plants in distilled water. A comparison of data from the 0.1 Normal plant-growth media to a distilled-water medium was the first step. This four-plant system produced a well-defined pH increase in the root environment. This pH flux duplicated the flux observed in the AE and CE systems (n=100), as shown in Figure 1. This pH increase occurred independent of the presence of nitrogen. In light of these data, our goal was to establish a reason for this increase of pH in the absence of nitrogen compounds.
Effects of Parity and Nonparity of Temperature in Ambient and Controlled Environments
The data from the AE and CE (n=100) systems revealed a parity of temperature. Parity occurs when the root temperature and leaf temperature are of equal value. This equality of temperature correlated with an observed pH flux. (Data for parity and nonparity temperatures are not shown.) The parity was constant for a period of time, but not a specific temperature. The pH increased after parity occurred, and a strong correlation was observed between parity of temperature and an increase in pH.
Nonparity and pH Decrease in Distilled Water Alone Under Ambient Conditions
To test the association between nonparity and pH decrease, a four-plant aquaculture system was employed using 500-mL containers that held an air frit (flow 50 mL/minute per plant), pH probe, and 350 mL media for each plant. Overnight pre-testing conditions of four treatment sets (n=4/set) were: 5ºC (roots 5ºC, leaf 10ºC), 10ºC (roots 10ºC, leaf 15ºC), 15ºC (roots 15ºC, leaf 20ºC), and 20ºC (roots 20ºC, leaf 25ºC). Pre-testing incubation treatment temperatures were ±1ºC. Nonparity occurred when the root and leaf temperatures were unequal. Nonparity produced a decrease in pH with in increase in temperature. A very strong correlation was observed between nonparity of temperature and an decrease in pH (Figure 2).
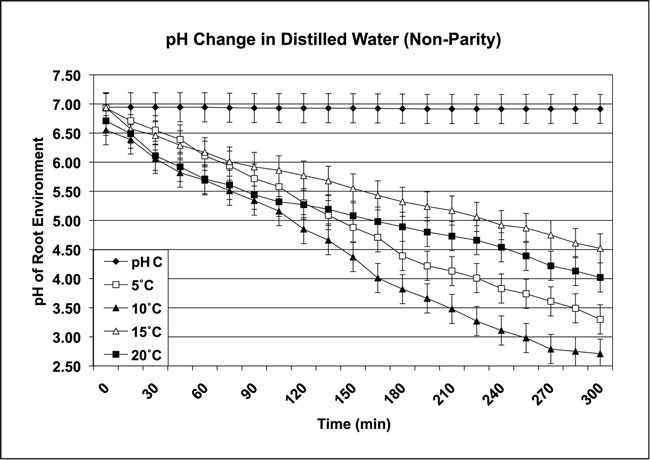
Figure 2: The nonparity pH response of controls (pH C) and four Chrysanthemum plants grown in distilled water. (Data collected from controls and four Chrysanthemum plants in each treatment group over four repetitions. Control liquid media was 5ºC; air temperatures ranged from 21ºC – 36ºC in full sunlight, ambient outside environment. All temperatures ±1ºC)
All roots were subjected to pre-testing incubation treatment temperatures. During the day, leaf temperatures increased: 5ºC (leaf 10ºC – 36ºC), 10ºC (leaf 15ºC – 34ºC), 15ºC (leaf 20ºC – 30ºC), and 20ºC (leaf 25ºC – 31ºC). The leaf area was found to be responsive to ambient outside environment (AE) conditions, with an increase in leaf temperature producing a decrease in pH. The pH range was from 6.52 at start to 2.33 for the test period. A pre- and post-analysis of the distilled water in this test revealed the presence of acetic acid (>1.0 mg/L) in the post-test liquid. This acetic acid was not detected in the pre-test media.
Relationship of Parity, Light, Dark, and pH Increase in 0.1 Normal vs. Distilled Water Media in a Controlled Environment Following Parity Conditions
The four-plant system was used to examine the response of pH following parity conditions. Two sets of four Chrysanthemum plants were equilibrated overnight at one of four temperatures: 5ºC, 10ºC, 15ºC, and 20ºC ±1ºC in (a) distilled water with no chemicals and (b) a 0.1 Normal plant-growth media set (n=4/set). Although Chrysanthemum are frost-tolerant plants, these media test temperatures were intentionally set well above freezing to avoid the possibility of a chilling injury response. The test was conducted in a controlled inside environment with artificial lights or no light as leaf temperatures were increased to 25ºC. The roots were maintained at the overnight temperatures for the test ±1ºC. Measurements from both light and dark environments produced the same increase in pH as leaf temperatures were increased. The results demonstrated the influence of parity on pH (Figures 3a and 3b). The pH range for Figure 3a was 6.98 to 8.99; the pH range for Figure 3b was 6.98 to 8.83. The control pH (pH C) was that of the media without plants, and ranged from pH 6.56 to 6.57 under the same conditions as the results shown in Figures 3a and 3b.
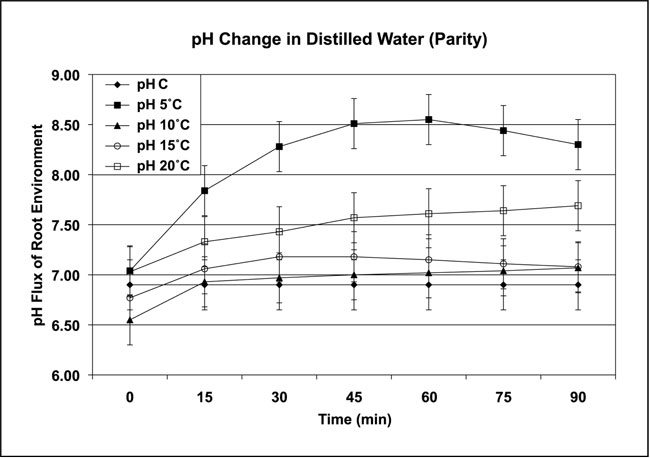
Figure 3a: Parity temperatures and pH response of the root environment grown in distilled water in a controlled inside environment under artificial light or no light. (Data collected from controls [pH C] and four Chrysanthemum plants in each treatment group over four repetitions. Control liquid media was 5ºC; air temperatures ranged from 20ºC – 28ºC. All temperatures ±1ºC)
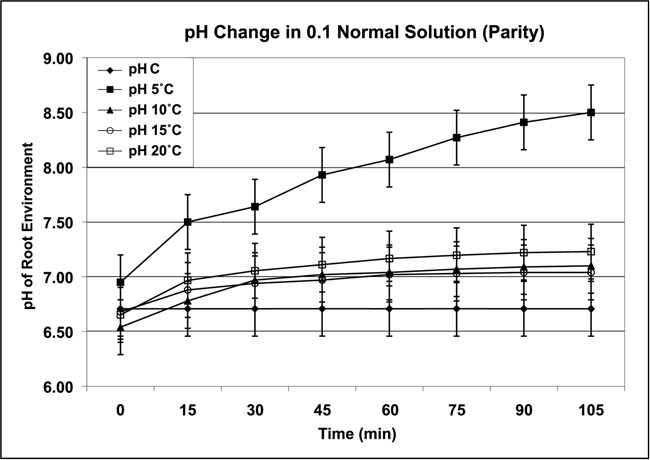
Figure 3b: Parity temperatures and pH response of the root environment grown in 0.1 Normal growth media in the ambient outside environment in full sunlight. (Data collected from controls [pH C] and four Chrysanthemum plants in each treatment group over four repetitions. Control liquid media was 5ºC; air temperatures ranged from 20ºC – 26ºC. All temperatures ±1ºC)
Because light is the principal activator of many plant activities, the objective of this part of our study was to compare data from two groups of Chrysanthemum plants to evaluate the increase in pH in the presence or absence of light. The parity overnight temperature for all plants (roots and leaves) was 5ºC. Under testing conditions, the root temperature remained at 5ºC and the leaf temperature increased to 15ºC ±1ºC. Artificial lighting was provided by two Sylvania® Cool White™ fluorescent tubes (48 inch; 34 W; 2,650 lumens; 4,200 K; other light data not recorded) mounted 2 M above each 4-plant group.
The pH range under artificial light exposure was pH 6.97 to 9.14; under dark conditions the pH range was from pH 6.98 to 9.18 (Figure 4). The mean pH Control was the pH of distilled water without plants under the same conditions as the controlled inside environment in the dark. The pH range for controls was pH 6.77 to 6.93. This phenomenon was duplicated in a repeat experiment with another 4 plants/group, for a total of 8 plants for each treatment group. Under parity conditions, the plants produced an increase in pH, regardless of light vs. dark environment.
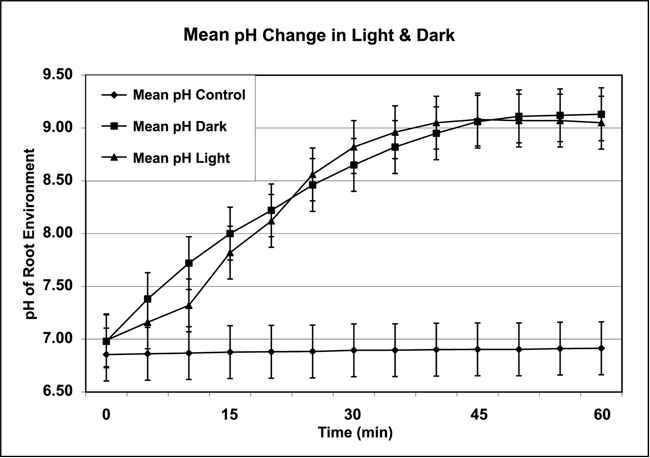
Figure 4: Monitored pH flux data in distilled water as root temperature remained constant at 5ºC and leaf temperature increased to 15ºC ± 1ºC. (Data collected from plant-growth media in the root environment of controls [Mean pH Control] and two groups of eight Chrysanthemum plants under artificial light [Mean pH Light] and dark [Mean pH Dark] conditions at 5ºC liquid media and 15ºC air temperature over four repetitions. All temperatures ±1ºC. Light data not recorded.)
The Effect of Plants vs. Media on pH Change
Is this change in pH due to the media or the plant, and will the pH change in the media by removing the plant during the test? The parity overnight temperature for all plants (roots and leaves) was 5ºC. Under testing conditions in the 4-plant system, the root temperature was maintained at 5ºC while increasing the leaf temperature to 15ºC ±1ºC. The pH of the distilled water growth media of this trial was 6.89, and after the plant was inserted the pH of the media increased to 8.47. After withdrawing the plant from the pH 8.47 media, the pH of the media declined to 6.90. After reinserting the plant in the media, the pH of the media increased to 8.50. The total elapsed time of this experiment was 15 minutes.
This test was repeated in 0.1 Normal plant-growth media with exchange of each probe to remove any probe effect (n=4). Two of the tests were performed in the AE environment and two were in the CE environment. This test was repeated in distilled-water media after the probes were exchanged (n=4). Two of the tests were under artificial lights and two were in the dark in the CE system. The pH of the 0.1 Normal plant growth media of this trial was 6.59 at start and increased to 8.38 after the plant was inserted. After withdrawing the plant the pH of the media declined to 6.64. After reinserting the plant in the media, the pH of the media again increased to 8.47. The results of these tests demonstrated an increase in pH with plants in the media and a decline in pH with plants out of the media. These findings suggest that the plant was influencing the media pH. This test was completed in 15 minutes.
The Role of the Roots vs. Leaves
The role of a temperature differential between the roots and the leaves became obvious, suggesting that the role of the roots required further evaluation. The roots and 4-cm of stem of one Chrysanthemum plant were submerged in distilled water overnight at 5ºC in preparation for this test. (All temperatures ±1ºC.) The leaf temperature was maintained at 5ºC. The control pH was the pH of distilled water without plants under the same conditions in the controlled inside environment with a canopy air temperature of 20ºC. This test was performed in the controlled inside environment. After the incubation period and before the test, the plant received fresh distilled water at 5ºC. The roots were removed ~2 cm below the water surface, keeping the tip of the cut stem submerged.
Testing and measurements were performed with the submerged stem at 5ºC and the remaining stem with leaves exposed to the air at 20ºC. The result was a pH increase without the presence of the root. Data from this single plant (pH 6.9 to pH 8.4) were similar to data shown in Figure 3a. These findings suggest that an elevation in pH may occur even in the absence of roots.
Species Specificity
The relationship between species and pH flux also required further examination to determine if this pH flux was unique to the Chrysanthemum. One Liriodendron tulipifera L., Yellow Poplar tree (28cm x ~40g), was tested. In preparation for this test, the roots of this tree were submerged in 15ºC of distilled water overnight in a refrigerator set at 15ºC ±1ºC. This permitted the roots and leaves to achieve the set parity temperature. The tree in the container was removed from the refrigerator after ~12 hours of overnight incubation. The plant received fresh distilled water at 15ºC before the test.
This test was conducted in the controlled inside environment. Testing and measurements were done with the roots at 15ºC and the remaining stem with leaves in the air at 20ºC – 23ºC for 3 hours. The data from this test were similar to data shown in Figure 3a. The pH range for this test was pH 6.74 to 7.14. This tree was less then 6 months old and the leaf area was less than 25% that of a Chrysanthemum of the same age. With only one immature tree used in this test, it is not surprising that a minimal pH change was observed. These results suggest, however, that the observed pH flux was not species specific.
Effect of Temperature Alone
The effects of direction of temperature change on Chrysanthemum plants required further evaluation in distilled water. One group (Group 1, Parity) of plants (n=4) received a final air temperature of increased value. A second group (Group 2, Nonparity) of plants (n=4) received a final air temperature of decreased value. The pre-test overnight temperature for both roots and leaves was 24ºC ±1ºC. During this test, the root temperature was maintained at 24ºC ±1ºC for both groups. In Group 1, leaf temperature was increased to 30ºC; in Group 2, leaf temperature was decreased to 20ºC. In Group 1 (Parity), an increase in leaf temperature produced an increase from pH 6.97 at start to 7.81. This was similar to the response illustrated in Figure 4. In Group 2 (Nonparity), a decrease in temperature of the leaves produced a decreased pH from pH 6.97 at start to 6.30. This decline of pH to 6.3 was similar to but not as pronounced as the response shown in Figure 2. Total elapsed time for this test was 15 minutes. Control pH ranged from 6.97 to 6.94 in Group 1 and 6.97 to 6.99 in Group 2.
These findings suggest the sine-wave pattern observed with the AE and CE (n=100) systems (Figure 1) may have been the result of temperature change. Could it be possible to reproduce this sine-wave pattern with temperature change alone? To test this theory, the four-plant CE system was used. Chrysanthemum plants were placed in distilled water with an overnight incubation period to equilibrate at room temperature (23ºC). At the start of the test, the plants were quickly transferred to a 5ºC refrigerator with the roots changed to 5ºC distilled water. The pH increased from a mean of 6.84 (SD=0.11) to 7.98 (SD=0.13) over 70 minutes. After returning the plants to a room temperature of 23ºC the pH declined to the original pH (6.8) within 60 minutes. The pH continued to decline overnight (17 hours) to a mean low of 4.28 (SD=0.32). After returning the plants to the refrigerator at 5ºC air temperature with a correspondingly rapid change to 5ºC distilled water for the roots, the pH rose by 2 pH units within 30 minutes. The pH continued to climb to a mean of 7.39 units (SD=0.05) over the next 110 minutes. The control pH was recorded in the media without plants under the same conditions and ranged from pH 6.83 to 6.98 (Figure 5). This test was terminated at 24 hours.
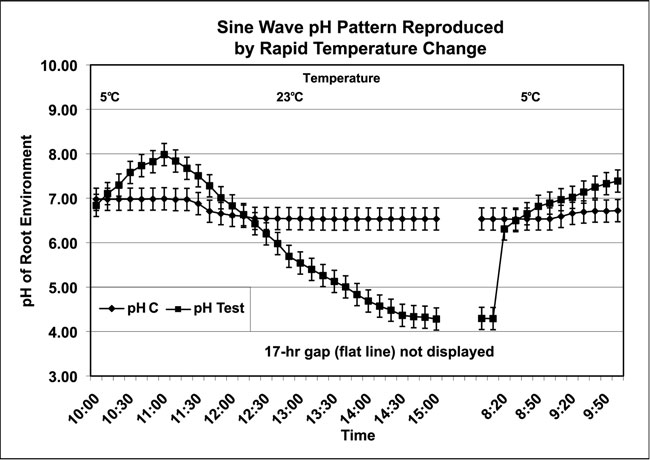
Figure 5: Temperature change alone reproduces a sine-wave pattern of pH flux in distilled water. (Data collected from the AE and CE systems shown in Figure 1. Controls [pH C] and four Chrysanthemum plants in each of two treatment groups [pH Test] received exposure to both dark and artificial light over two repetitions. Control and test liquid media began at 5ºC; air temperatures ranged from 5ºC to 23ºC then back to 5ºC. All temperatures ±1ºC)
As shown in Figure 4, the pH could increase under either dark or light conditions. The results presented in Figure 5 demonstrate that the pH ranged from a low of 3.83 to a high of 8.17. These data have shown that the sine-wave pattern was reproducible by changing the air temperature in the dark as well as artificial light, which replicates the sine-wave pattern first shown in Figure 1. The difference in pH of media with plant and control without plants was statistically significant (p<0.01). A statistical analysis of the pH data collected from the plants in this study is presented in Table 1.
Table 1: Statistical analysis of 510 data points collected from the 5ºC root environment of Chrysanthemum plants.
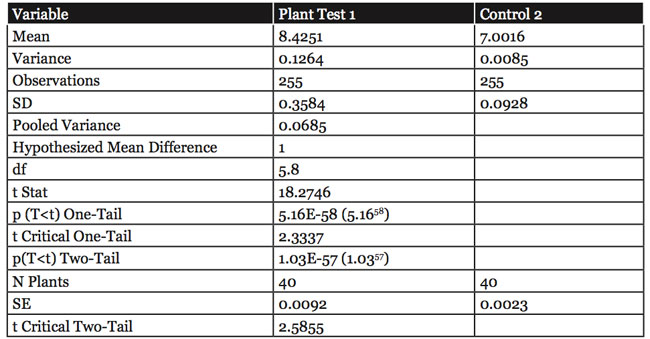
df = degrees of freedom
t Stat = the maximum number from one-tail and two-tail tests
p(T<t) = probability of significance, p<0.01
(The pH changes observed here were from 15 replications in distilled water or 0.1 Normal growth media, with and without plants. The difference in pH of media with plant and control without plants was significantly greater than that recorded at the p<0.01 Normal level. The statistical analysis was a t-Test (Two–Sample Assuming Equal Variance) to distinguish between two samples, one with plants and one without plants.)
Other Measurements
The ammonia concentrations were nondetectable at <0.8 mg/L and nitrates at <1.0 mg/L in pre-use distilled water. Acetic acid (>1 mg/L) was present in the post-use pH <7 liquids and <1.0 mg/L in the pre-use liquid. Metal analysis of dry Chrysanthemum plants from the four-plant systems (n=24) in this study detected titanium (50 ppm w/w), silica (0.40% w/w), and iron (105 ppm w/w).
Discussion
The presence of ammonia or nitrates as causal agents of the pH flux we found in the root environment of the Chrysanthemum plant is questionable. The observations of pH change both while plants were in plant-growth media and after plants were removed from media provide evidence of the plants’ influence upon pH. These observations were made with both 0.1 Normal plant-growth media and distilled water under both light and dark conditions. A pH flux occurred independently of the presence of nitrogen compounds. The 0.1 Normal plant-growth media produced a pH value >9, the distilled-water media also produced a pH value >9 (even though no chemicals were added), and the pH values of both media were of equal magnitude.
Reason would dictate that there is a relationship between temperature and pH activity, with temperature as the causal agent. The pH flux observed in our aquaculture studies indicates that a circadian rhythm occurs in plants that is reproducible, predictable, and unaffected by the presence or absence of light or nutrients in the media. Moreover, this circadian rhythm does not appear to be species specific.
Parity of temperature revealed this pH flux for observation. In the first phase with parity of temperature, an increase in temperature results in an increase in pH. When nonparity occurs, an increase in temperature produces a decrease in pH.
This sine wave, a pH flux, (Figure 1) detected in the root environment was therefore temperature dependent. Although the activity that produced the observed pH increase may remain undefined at this time, the cyclic rise and fall of pH was observable after parity at any time of the day. This pH change occurred even in the absence of roots and this phenomenon was not limited to light or dark conditions (Figure 4).
The sine-wave function of this pH flux had an amplitude of more than 6 pH units (~355 mV potential). The peak of this pH flux was pH >9 and the trough was pH <3. These data provide some explanation to the sporadic observations in the ambient outside system. This AE system (n=100) experienced a wide flux of temperature from 5ºC to 40ºC. This temperature flux resulted in a lesser likelihood of parity. Parity occurred daily in the CE system (n=100) where air temperature was maintained in the range of 20ºC to 25ºC. The root temperatures in the AE system ranged from 18ºC to 28ºC, while root temperatures in the CE system ranged from 21ºC to 24ºC. The production of a pH flux (pH <3 to pH >9) in response to fluxing temperature suggests a circadian rhythm may have been involved. Could one conclude that this circadian rhythm, as evidenced by a pH flux, may potentially represent a form of biological clock? If so, this potential clock mechanism may represent an energy-transfer system, and the energy from this pH flux could contribute to some biological activity. These findings suggest that further trials are warranted to clarify this phenomenon.
In the second phase of this pH flux after parity (after the increase in pH), a decrease in pH is observed. Our results demonstrated that with parity, an increase in air temperature results in a decrease in pH. Conversely, a decrease in air temperature increases pH under parity.
This pH flux was independent of the presence of ammonia or nutrient chemicals (Figures 2, 4), light (Figure 5), and roots. This pH flux also occurred in one other test species (Liriodendron tulipifera L.). The pH<7 could be explained at least in part by the presence of acetic acid. Both high-performance liquid chromatography (HPLC) and gas chromatography (GC) analyses confirmed the presence of acetic acid (>1 mg/L) in the post-use pH <7 liquids. This acetic acid detected in the post-test media may have contributed to the decrease in pH. The presence of acid exudates support the findings of Rivière and Moghimi et al. (Rivière J, 1960; Moghimi A et al., 1978) In both these studies the investigators concluded that organic acids (acetic, propionic, butyric, valeric, 2 keto-gluconate, and others) are plant root exudates. One may assume that when plant temperature increases, metabolism increases, which may in turn increase acid production. This increased acid production would then yield an increase in acid root exudates (Figure 2).
Current wisdom dictates that a catalyst needs to be present in a plant for water to split. The pH values >7 that we found were possibly due to the splitting of water according to the Hill reaction, which used a catalyst of Fe(CN)6. (Hill R Whittingham CP, 1955). Demuth showed that titanium disilicide (TiSi2) will split water, (Web ref. 1) and water splitting under visible light has also been demonstrated in a mixture of cadmium sulfide (CdS) and molybdenum disulfide (MoS2), which serves as an efficient photocatalyst. (Zong X et al., 2008) However, the water splitting reactions described by Demuth and Zong et al. were observed without the use of plants. Emsley determined the concentration of titanium (1 to 80 ppm w/w) in a wide variety of plants. (Emsley J, 2001) Epstein suggested that silica should be added to the plant nutrient list, and analysis of plants (n=24) in his study revealed the presence of titanium (50 ppm w/w), silica (0.40% w/w), and iron (105 ppm w/w). (Epstein E, 1994) The water-splitting activities with Fe(CN)6, TiSi2, and (CdS+MoS2) are different, but all seem to require light.
One might assume that the increase in pH observed in this study was the result of the hydroxide ion released by the splitting of water. The work of Hill and Whittingham employing Fe(CN)6 and light could explain this rise in pH. (Hill R, Whittingham CP, 1955) Hill stated that the splitting of water in the presence of light, in a stepwise reaction, produced hydrogen and a hydroxyl group. The Trebst model suggests that proton separation in the process of photophosphorylation excludes the hydroxide ion from the thylakoid interior, and this reaction results in a matrix pH of approximately 8. (Trebst A, 1974) Schopfer noted the formation of hydroxyl groups in the embryo and seed coat during germination. (Schopfer P et al., 2001) This hydroxyl group appeared to progress to the root. In our study, the results indicate that hydroxyl groups formed within the plant cells and influenced the root environment, even in the dark (Figure 4).
As temperatures increase, so do root-acid exudates due to increased metabolism. The acetic acid found in the post-treatment pH<7 samples is evidence of this process. The production of these acid exudates in a sense masks the presence of the hydroxyl groups. As temperatures decline, so too would metabolic rate, which would result in a reduction of acid exudates. This decline in acid exudates would then permit the observation of a pH increase. This implies that the splitting of water is a constant, with periodic masking of the process by released acid exudates. Could it be possible that the individual cells of the plant may also experience a pH flux equal to or greater than the magnitudes found in this study?
One hypothetical explanation for this increase in pH under light or dark conditions is that it may be effected by a water-splitting system in the plant. (Figure 6) In such a system, the formation of hydroxyl groups at the water-splitting site would produce a pH of 9.2+, which would serve as a sink for hydrogen ions. This sink would be responsible for a mass movement of hydrogen along the water chain from one molecule to the next. At the root membrane, outer surface water would be split, with water crossing the membrane at rate A and hydrogen crossing the membrane at rate B, and this difference in rate may be observed as a increase in pH. The migration of hydrogen along the chain of water would allow a pH of ~7 to be maintained throughout the plant and at the same time accumulate massive amounts of hydrogen in a reservoir. The hydroxyl groups [n(OH-)] would then be converted to peroxide [n(H2O2)], which would subsequently decompose to oxygen [n(O2)] and water [n(H2O)] molecules. The oxygen gas would evolve to the atmosphere and the water would be returned to the water chain. The water splitting system and activities under light and dark conditions have yet to be defined.
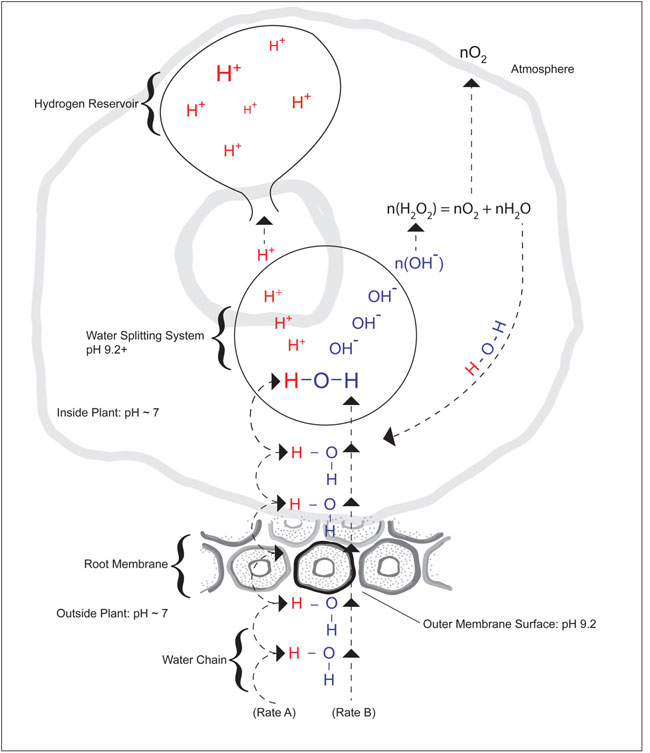
Figure 6: Diagram of a potential pH increase mechanism under light or dark conditions.
The peak values of pH >7 found in this study suggest that a single activity occurs in both light and dark. This “single activity” found in germinating seeds is evidence of the existence of a hydroxyl group. (Schopfer P et al., 2001) Many seeds do germinate in the dark before the development of chlorophyll. This may indicate that water splitting is not dependent on light energy. Current data suggest that water splitting occurs in plants, but is the plant responsible for the splitting of water? This question is now open for debate.
The list of chemical elements that split water is increasing, and may eventually identify the source of water splitting. However, if the splitting of water occurs in the presence of a catalyst, the concentration of the catalyst may be so low as to be beyond the sensitivity of our current instrumentation.
Another plausible explanation was offered by Pollack et al., who observed that more than one function may be served by the free protons that are generated from environment-supplied energy (such as radiant or geothermal energy). External energy appears to precipitate the formation of protons or hydronium ions, and the formation of hydronium ions must be accompanied by formation of a hydroxyl group as well. (Pollack GH et al., 2009)
Earlier studies of the charge at the gas/liquid surface of water have resulted in considerable disagreement. Some investigators have proposed that the surface charge is positive because of the presence of surface-active hydrogen ions, whereas others have maintained that the charge is negative due to the presence of surface-active hydroxyl ions. Studies by Chaplin have suggested that water may exist in two states, low-density water (LDW) and high-density water (HDW). This interpretation describes water as rapidly interconverting LDW clusters and HDW clusters. (Chaplin MF, 2000) Whereas the molecular movements in liquid water require rapid breaking and reorganization of individual hydrogen bonds at a picosecond rate, at any given time the level of hydrogen bonding remains very high at ≥95%. (Musumeci F et al., 2009)
Other studies have indicated that the greater strength of the hydrogen bonds on the surface of water are partly the result of reduced competition from nearby water molecules and partly the result of greater cooperativity and less anticooperativity.(Chaplin M, 2000) A buildup of extensive near-surface water ordering has been associated with charge separation, which is attributed to incident radiant energy. It is thus possible that a large fraction of the electromagnetic energy that is absorbed by water is instrumental in the creation of order and separation of charge. (Chai B et al., 2009) These interpretations imply that massive amounts of water are splitting and recombining on the atomic level, in which case a large amount of hydrogen would become available to any organisms that may be present.
The exclusion zones (EZ) that have been observed adjacent to many hydrophilic surfaces could play a major role in the splitting of water, and thus the formation of life in the universe. As an EZ is formed, protons are released to bulk water where they associate with the water to form hydronium ions. The concentration of hydronium ions is considerable, which results in unexpectedly large changes in pH. (Zhao Q et al., 2009) One important attribute of the interfacial EZ is the separation of charge. The EZ is normally negative and the region of bulk water is normally positive, and the positive potential can be measured directly with pH-sensitive dyes and miniature pH probes, which indicate a sharp drop of pH (often >3) in the area immediately beyond the EZ. (Pollack GH, 2001; Pollack GH, 2008; Pollack GH et al., 2009; Web ref. 2)
Several recent studies have demonstrated that the growth of this more orderly near-surface zone is accompanied by a charge separation, and the energy source is assumed to be radiant energy. It is interesting to note that the wavelengths of light energy considered most responsible for building this zone are predominantly the same wavelengths most actively absorbed by water, and this light energy may produce the same effect on individual molecules as a change in temperature. Thus, a considerable fraction of the energy (electromagnetic, radiant, and/or thermal) absorbed by water could be employed to build order and separate charge. (Chai B et al., 2009)
The known universe contains many of the elements of the periodic table that could provide a surface for the formation of an exclusion zone. One would assume that water splitting may possibly be a common event throughout the universe. If water splitting is common, what could extract or harvest the hydrogen and oxygen from this system? In plants, metabolic products such as acid root exudates are an example of the end result of this harvesting process and one that could represent a form of energy transfer. This process of water splitting and harvest would create a potential difference of H+ and OH-. The potential difference—a pH flux—may be a type of biological clock that would provide energy. This energy would thus be available to the plant’s systems and functions, and it would be unlikely that this energy would escape to the universe unused. Potential applications of this system and activity are intriguing.
Our primary objective in this study was to monitor pH dynamically over a 24-hr period. Our results may appear surprising to many, but we feel they indicate that the time is long overdue for taking a new look at some of these basic concepts using modern technology.
Acknowledgments
The authors thank Bill Senger, Rebecca G. Beck, and Maryann Appel for their editorial and graphics assistance in the preparation of this manuscript.
References
Chai B, Yoo H, Pollack GH (2009). Effect of radiant energy on near-surface water. J Phys Chem 113: 13953-13958, PDF.
Chaplin M (2009). Theory vs experiment: What is the surface charge of water? WATER 1: 1-28.
Chaplin MF (2000). A proposal for the structuring of water. Biophys Chem 83(3): 211-21 (abstract).
De Mairan M (1729). Observation Botanique. Histoire de l’Académie Royale des Sciences, p. 35.
Emsley J (2001). Nature’s Building Blocks: An A-Z Guide to the Elements. Oxford University Press, Oxford, pp. 451–453.
Epel D (1978). Mechanisms of activation of sperm and egg during fertilization of sea urchin gametes. Curr Top Dev Biol 12: 185–246.
Epstein E (1994). The anomaly of silicon in plants, Proc Natl Acad Sci USA 91: 11–17.
Frantz JM, Cometti NN, Bugbee B (2004). Night temperature has a minimal effect on respiration and growth in rapidly growing plants. Ann Bot 94(1): 155–166.
Gerson DF, Burton AC (1977). The relation of cycling of intracellular pH to mitosis in the acellular slime mold Physarum polycephahum. J Cell Physiol 91(2): 297–303.
Gillies RJ, Deamer DW (1979). Intracellular pH change during the cell cycle in Tetrahymena. J Cell Physiol 100(1): 23–31.
Hewitt EJ (1966). Sand and Water Culture Methods Used in the Study of Plant Nutrition, Rev 2nd Ed., Technical Communication No. 22, Commonwealth Agricultural Bureaux, Farnham Royal, England.
Hill R, Whittingham, CP (1955). Photosynthesis. Methuen and Company, Ltd., London.
Hoagland DR, Arnon DI (1938). The Water-Culture Method for Growing Plants Without Soil, Circular 347 California Agricultural Experiment Station, Berkeley.
Jacoby B, Rudich B (1980). Proton-chloride symport in barley roots. Ann Bot 46: 493-498.
Johnson CH (1983). Changes in intracellular pH are not correlated with the circadian rhythm of Neurospora. Plant Physiol 72: 129–133.
Lettau J, Foster WA, Harker, JE, Treherne JE (1977). Diel changes in potassium activity in the haemolymph of the cockroach Leucophaea maderae. J Exp Biol 71: 171–186.
Mengel K, Kirkby EA (2001). Principles of Plant Nutrition, 5th ed., Dordrecht: Kluwer Academic Publishers, p. 419.
Moghimi A, Tate ME, Oades JM (1978). Phosphate dissolution by rhizosphere products. II Characterization of the rhizosphere products especially a ketogluconic acid. Soil Biol Biochem 10: 283–286.
Mori S (1960). Influence of environmental and physiological factors on the daily rhythmic activity of a sea-pen. Cold Spring Harbor Symp Quant Biol 25: 333–344.
Musumeci F, Grasso R, Lanzanò L, Scordino A, Triglia A, Tudisco S, Gulino, M (2010). Aqueous Ionic Solutions Investigated by Time Resolved Delayed Luminescence. WATER 2 (Suppl 1): 23-24.
Ovchinnikova K, Pollack GH (2009). Can water store charge? Langmuir 25: 542-547, PDF.
Pollack GH (2001). Cells, Gels and the Engines of Life: A New, Unifying Approach to Cell Function, Ebner & Sons, Seattle WA, USA,. ISBN: 0-9626895-2-1, Chapters 1-4, 15-16.
Pollack GH, Figueroa X, Zhao Q (2009). Molecules, water, and radiant energy: New clues for the origin of life. Intl J Mol Sci 10: 1419–1429, PDF.
Rivière J (1960). Studies on the ribosphere of wheat. Ann Agron 11: 397–440.
Roos A, and Boron WF (1981). Intracellular pH, Physiol Rev 61: 296–434.
Schopfer P, Plachy C, Frahry G (2001). Release of reactive oxygen intermediates (super oxide radicals, hydrogen peroxide, and hydroxyl radicals) and peroxidase in germinating radish seeds controlled by light, gibberellin, and abscisic acid, Plant Physiol 125: 1591–1602.
Setlow B, Setlow P (1980). Measurement of the pH within dormant and germinated bacterial spores. Proc Natl Acad Sci USA 77: 2474–2476.
Shabala SN, Newman IA (1997). Proton and calcium flux oscillations in the elongation region correlate with root nutation. Physiologia Plantarum 100: 917-926.
Theophrastus (1916). Enquiry into Plants, trans. by Arthur Hort, Loeb Classical Library, Vol. I, Books 1–5.
Tolley LC, Raper CD (1985). Cyclic variations in nitrogen uptake rate in soybean plants. Plant Physiol 78: 320–322.
Trebst A (1974). Energy conservation in photosynthetic election transport of chloroplasts. Ann Rev Plant Physiol 25: 423–458.
Wurts WA (2003). Pond pH cycle and ammonia toxicity. World Aquaculture 34(2): 20–21.
Zhao Q, Ovchinnikova K, Chai B, Yoo H, Magula J, Pollack GH (2009). Role of proton gradients in the mechanism of osmosis. J Phys Chem B 113: 10708–10714.
Zheng J-M, Wexler A, Pollack GH (2009). Effect of buffers on aqueous solute-exclusion zones around ion-exchange resins. J Colloid Interface Sci 332: 511-514, PDF.
Zong X. Yan,H, Wu G, Ma G, Wen F, Wang L, Li C (2008). Enhancement of photocatalytic H2 evolution on CdS by loading MoS2 as cocatalyst under visible light irradiation, J Am Chem Soc 130 (23): 7176–7177.
Web References
1. Demuth M (2006). Biomimetics with photons mimicking non-oxidative biosynthesis via photo induced electron transfer. Max Planck Institute for Bioinorganic Chemistry, http://ewww.mpi-muelheim.mpg.de/bac/ [10/11/2010]
2. Pollack GH (2008). Water, Energy, and Life: Fresh Views From the Water’s Edge. In Proceeding of University of Washington 32nd Annual Faculty Award Lecture, University of Washington Television: Seattle, USA [10/01/10].
Discussion With Reviewers
Wei-Chun Chin1: What is the possible energy source to split water in your model?
Roy Gorman, et al: Although the concept of water dissociation is well established and accepted in the scientific community, the extent of this dissociation is open for discussion. Chaplin and Chai have suggested that massive amounts of water are splitting and recombining on the atomic level at any given time. (Chaplin MF, 2000; Chai B et al., 2009) Musumeci noted that the molecular movements in liquid water require rapid breaking and reorganization of individual hydrogen bonds at a picosecond rate, and at any given time the level of hydrogen bonding remains very high at ≥95%. (Musumeci F et al., 2009) This could be interpreted to mean that some 5% of the water is dissociated. A gram mol of water equals 18 grams or 6.02 X 10²³ molecules. A conservative value of 1% would mean that 6.02 X 10²¹ molecules would be in a dissociated state, which represents a massive amount of free energy that the organism could harvest. This free energy is dynamic in the sense that as energy is harvested by the organism a new equilibrium is established, and thus a free flow energy is constant. The only energy input is that required is heat to maintain the water in a liquid state.
Chin: Do you think the mechanism you proposed in this paper is limited to plants? For animal cell or single cell phytoplankton, is this mechanism possible?
Gorman, et al: The diversity of organisms on earth is almost infinite, yet the need for water is one trait in common to all. The dissociated water we observed (high pH) could provide two rewards for any organism: free energy and a circadian rhythm. Single-cell organisms, the first link of the evolutionary chain, could have used this energy and perhaps benefited from the biological clock. In nature, if a system is successful it is used repeatedly in the evolutionary chain. Our studies were conducted on a multicellular organism (Chrysthanthemum) that is modestly advanced in the evolutionary chain. Reason would dictate that this process, the opportunistic use of energy and circadian rhythm, would not begin with a multicellular organism but would rather be inherited from some preceding organism. It is quite possible that this process would be found at all levels of the evolutionary chain because all organisms need water, all will use free energy, and all will benefit from a biological clock.
Chin: You proposed several transition metal ions as possible catalysts. Which metal (or ions) do you think is more likely than others?
Gorman, et al: Many theories regarding ions and transition metal-ion catalysts have been offered, and with evolving technology a definitive metal ion catalyst may some day be revealed. However, most metal ion catalysts require sunlight to split water. Our results present evidence that water is also split in the dark as well as light. Our study included a distilled water subset to which no chemicals were added. The plants were also conditioned over night in distilled water and then washed in fresh distilled water at the start of the experiment to remove any chemicals from the surface and free space of the plant. Presumably this pretreatment would preclude any chemicals from being exuded from the roots. With no chemicals added to the growth media the root environment would be free of any metal ion catalysts. Chaplin and Chai suggested that massive amounts of water are splitting and recombining on the atomic level at any given time. (Chaplin MF, 2000; Chai B et al., 2009) Musumeci stated that the molecular movements in liquid water require rapid breaking and reorganization of individual hydrogen bonds at a picosecond rate, and at any given time the level of hydrogen bonding remains very high. (Musumeci F et al., 2009) Even if only 1% of the water were dissociated, this would produce a massive amount of free hydrogen that could be harvested by the organism. This free hydrogen (energy) is dynamic, in that as energy is harvested by the organism (i.e., plants in our study) a new equilibrium is established, and thus the free flow of energy is constant. Consequently, we would conclude that metal catalysts are not necessarily involved in the breaking of water molecules.
1 University of California, Merced, School of Engineering, 5200 North Lake Rd, Merced, CA 95343 Correspondence: wchin2@ucmerced.edu, Tel: (209) 228-8668